Abstract
Background. Minimally invasive treatment of white spot lesions (WSLs) requires predictable and stable aesthetic outcomes.
Objectives. This in vitro study aimed to systematically analyze the color dynamics of resin-infiltrated WSLs across all relevant treatment phases and to develop a color atlas as a clinical and scientific reference.
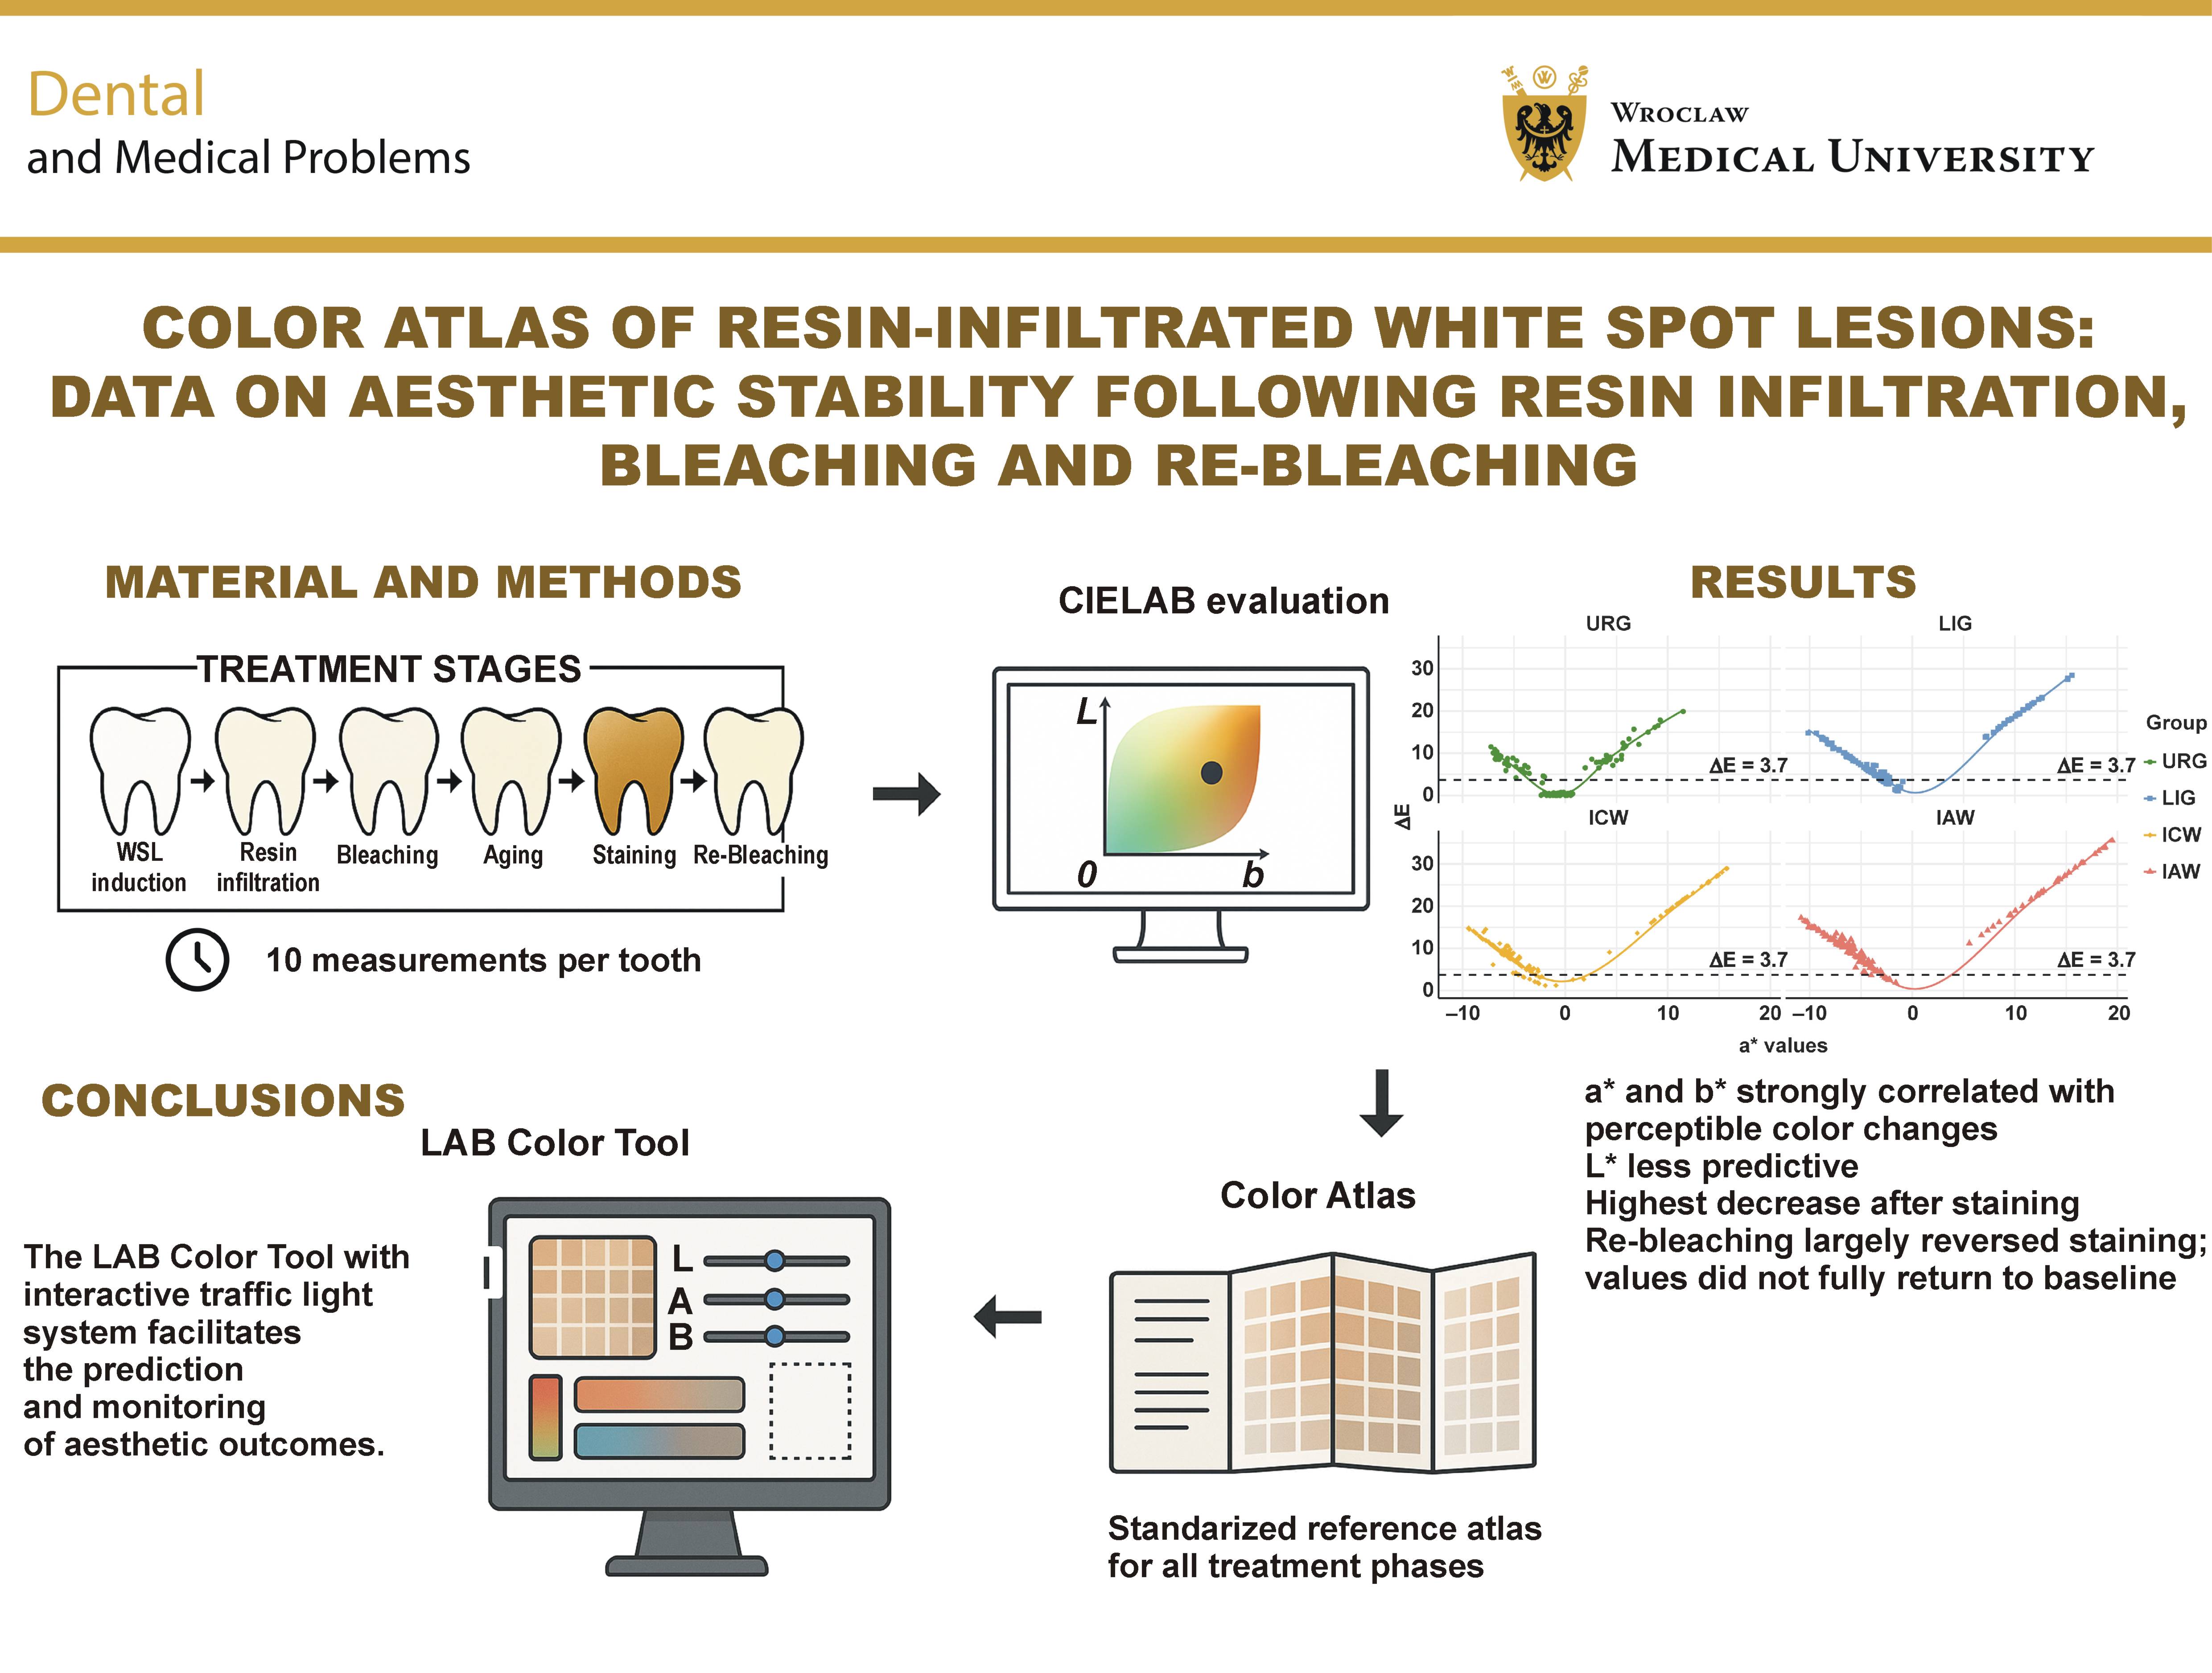
Material and methods. Sixty extracted, caries-free third molars were randomly assigned to 4 groups: untreated control (URG); lesion + infiltration (LIG); lesion + infiltration + in-office bleaching (ICW); and lesion + infiltration + at-home bleaching (IAW). Standardized colorimetric measurements (L*, a*, b*) and ΔE values were collected at 10 defined stages (T0–T9): baseline (T0); post-WSL creation (T1); post-infiltration (T2); post-bleaching (T3); post-bleaching storage in distilled water for 14 days (T4); post-aging (thermocycling; T5); post-staining (coffee, day 6 and day 12; T6 and T7); post-re-bleaching (T8); and final water storage for 14 days (T9). Bleaching protocols included either four 15-min in-office bleaching applications or 5 days of at-home bleaching with 10% carbamide peroxide. Color changes were assessed using calibrated digital image analysis. A browser-based LAB Color Tool was developed to evaluate L*, a* and b* values against study-derived 95% and 99% confidence intervals (CIs), providing real-time traffic light feedback.
Results. Chromatic coordinates a* and b* showed a strong linear correlation with ΔE values, whereas lightness (L*) exhibited a non-linear distribution with high variability, especially after bleaching. At-home bleaching (IAW) resulted in the highest ΔE values after staining (group mean: 25.1 at T7), followed by the ICW (23.6), LIG (21.1) and URG groups (12.9). As ΔE values above 3.7 are generally considered perceptible at conversational distance, most post-staining changes in the bleaching groups, and all values above 10, represent clinically visible discoloration. Re-bleaching markedly reduced staining-induced discoloration in all groups and shifted a* and b* back to or below their post-infiltration levels. However, final mean ΔE values relative to baseline remained above the 3.7 threshold because residual differences persisted across all 3 CIELAB coordinates.
Conclusions. Chromatic parameters (a*, b*) are more predictive of perceptible color differences in resin-infiltrated WSLs than lightness (L*) alone. These findings support the use of a* and b* as primary metrics in aesthetic diagnostics. The developed color atlas and browser-based LAB Color Tool offer a standardized reference for clinical decision-making and future research.
Keywords: white spot lesion, resin infiltration, color mapping, colorimetry, CIELAB color system
Introduction
In recent years, aesthetic dentistry has become a central pillar of modern dental practice, reflecting growing patient demand for improvements in tooth appearance and color.1 As patients increasingly value the appearance of their teeth, clinicians are more frequently confronted with concerns regarding discoloration of the anterior dentition, especially white opacities such as white spot lesions (WSLs) and dental fluorosis, as well as trauma-induced changes and yellowish-brown stains associated with molar–incisor hypomineralization (MIH).2 These enamel defects, particularly WSLs, often exhibit a heterogeneous microstructure characterized by water and air inclusions that alter the refractive index of enamel and cause variations in appearance depending on the depth of the lesion.3 In particular, orthodontically induced WSLs represent a frequent and clinically relevant challenge, and various adjunctive strategies have been investigated to effectively manage or prevent these lesions.4, 5 Patients frequently perceive these opacities as unaesthetic, leading to a growing demand for minimally invasive treatment options that can provide both immediate and long-term aesthetic improvement.3 The primary therapeutic goal is the restoration of a visually homogeneous tooth color and the maintenance of color stability over time.6
The resin infiltration technique (RI) involves selective etching of the lesion body with 15% hydrochloric acid (HCl), followed by capillary-driven infiltration of a low-viscosity, triethylene glycol dimethacrylate (TEGDMA)-based resin into the porous enamel structure. This method has shown promising results in optically masking lesions and enhancing their mechanical stability.7 However, despite its initially high aesthetic efficacy, the long-term color stability of infiltrated lesions remains uncertain due to various extrinsic factors.8 For instance, studies have demonstrated that composite and resin-infiltrated materials show increased susceptibility to staining and bleaching-induced surface degradation, which can influence both color and surface texture over time.9, 10, 11 In patients with fixed orthodontic appliances, tooth bleaching poses additional challenges due to limited agent diffusion and uneven whitening outcomes, necessitating careful consideration of timing and technique.12 Furthermore, concerns regarding the cytotoxicity of bleaching agents, particularly in combination with restorative materials, have gained increasing attention.9
To date, most studies have assessed color changes only at isolated time points, without capturing the continuous, dynamic progression of color alterations throughout the entire treatment and aging cycle. This lack of longitudinal color mapping across multiple clinically relevant stages, such as bleaching, staining and re-bleaching, limits the ability to predict and standardize long-term outcomes.
The CIELAB color system, widely used in dentistry, enables precise quantification of color differences through its 3 coordinates: L* (lightness, ranging from 0 = black to 100 = white); a* (green–red axis, ranging from −128 = green to 127 = red); and b* (blue–yellow axis, ranging from −128 = blue to 127 = yellow).13 Since its introduction in 1976, the CIELAB color space has been the standard in dental colorimetric analysis.14 Although the ΔEab formula has been criticized for its reliance on uniform Euclidean distances,15 the more recent CIEDE2000 (ΔE00) formula has improved accuracy by successfully capturing subtle color differences.16 However, recent detailed colorimetric studies have demonstrated that the ΔEab formula, contrary to earlier assumptions, aligns more closely with visually assessed color differences than the ΔE00 formula, reaffirming its clinical value in dentistry.16 Thus, the CIELAB system remains the gold standard due to its universal compatibility, ease of use and essential role in precise and reproducible color measurements in aesthetic dentistry.13
The ΔE value, which quantifies color differences, serves as a key parameter in evaluating color stability over time and enables both pre- and post-treatment assessments and comparisons between different teeth. Among the various proposed thresholds, a ΔE value of 3.7 has been established as a threshold for visual perceptibility at a natural conversational distance and is therefore considered the most clinically relevant benchmark from the patient’s perspective.17 At or above this value, color differences become noticeable to the average observer without the aid of magnification or special lighting. In addition, ΔE values ≤1.0 are often interpreted as imperceptible, and those between 2.0 and 3.3 as clinically acceptable. Nonetheless, these alternative criteria are applied inconsistently, whereas the ΔE threshold of 3.7 has emerged as a more reliable and pragmatic predictor of patient satisfaction.18 Such benchmarks are essential for the standardized evaluation of long-term treatment efficacy, though variations in clinical context may necessitate adjustments to perceptibility limits.
Resin-infiltrated WSLs exhibit increased surface roughness due to their altered microstructure, which promotes the adhesion of pigments from the oral environment and facilitates extrinsic staining from food and beverages.19 In addition, the infiltrant contains TEGDMA in combination with camphorquinone as a photoinitiator, which has a naturally yellowish hue. This color may partially persist after polymerization, prompting some patients to request additional tooth whitening shortly after treatment.20 Over time, infiltrated teeth are subjected to thermocyclic aging, which induces microstructural changes and further increases their susceptibility to discoloration, possibly necessitating repeated bleaching interventions.21 These factors underscore the multifactorial nature of long-term color stability in resin-infiltrated WSLs.
To date, studies investigating the color stability of infiltrated teeth have typically focused on isolated treatment phases, without accounting for the continuous color changes that occur throughout the full course of treatment.22 The existing gap in the literature emphasizes the need for a systematic and standardized approach to tracking color changes throughout all treatment phases, thereby enabling a deeper understanding of the dynamics of color stability. Comprehensive mapping of CIELAB values at each treatment stage may contribute to the development of evidence-based reference standards. Accordingly, the primary aim of the present secondary analysis was to systematically quantify L*, a*, b*, and corresponding ΔE values across all clinically relevant treatment stages of resin-infiltrated WSLs, including lesion creation, resin infiltration, bleaching, aging, staining, and re-bleaching, and to compile this data into a standardized, evidence-based color atlas for clinical and research use. As a secondary objective, a prototype of a digital LAB Color Tool was developed to operationalize the atlas data and provide clinicians and researchers with an interactive platform for comparing individual measurements against reference ranges. Additionally, Cohen’s d was calculated to determine the effect size of color changes, providing a quantitative basis for interpretation and planning of future controlled studies.
Material and methods
This study represents a secondary analysis of data derived from a previously conducted in vitro investigation involving 60 extracted, caries-free human third molars.23 The teeth were obtained following clinical extractions performed for reasons unrelated to the research. Written informed consent was obtained from all donors, and the study was approved by the Ethics Committee of the Faculty of Medicine, University of Cologne, Germany (reference No. 23-1472; March 28, 2024). The present manuscript was prepared in accordance with the CRIS (Checklist for Reporting In-vitro Studies) guidelines to ensure transparent and standardized reporting of the study design, methodology and results.24
To minimize interspecimen variability, only caries-free human third molars of comparable size, morphology and shade (A2–A3 on the VITA Classical Shade Guide) were included. All specimens were stored in distilled water at 4°C until use and were randomly allocated to experimental groups to ensure comparability of baseline characteristics.
The specimens were assigned to the following experimental groups:
• URG – initially untreated reference group; sound enamel without WSL creation, resin infiltration or initial bleaching, serving as the reference for natural color stability. Like all groups, URG specimens subsequently underwent thermocycling, coffee staining and re-bleaching;
• LIG – lesion + infiltration group; artificial WSL creation using a 21-day pH-cycling protocol (16 h of demineralization at pH 4.3 and 8 h of remineralization per day), followed by 56 h of storage in artificial saliva, a single 2-min application of 15% HCl gel, ethanol drying, and resin infiltration (3 min, repeated for 1 min, each light-cured for 40 s) with a low-viscosity, TEGDMA-based infiltrant (Icon; DMG Dental, Hamburg, Germany); no initial bleaching was applied;
• ICW – lesion + infiltration + in-office bleaching group; the same WSL creation and resin infiltration protocol as in the LIG group, followed by in-office bleaching using the Zoom! Protocol (Discus Dental Europe, Rotterdam, the Netherlands): four 15-minute applications of 25% hydrogen peroxide gel, simulating a professional chairside whitening procedure;
• IAW – lesion + infiltration + at-home bleaching group; the same WSL creation and resin infiltration protocol as in the LIG group, followed by at-home bleaching with 10% carbamide peroxide gel (Opalescence 10% PF; Ultradent Products, South Jordan, USA) applied for 8 h per day on 5 consecutive days at 37°C, simulating a patient-administered whitening protocol.
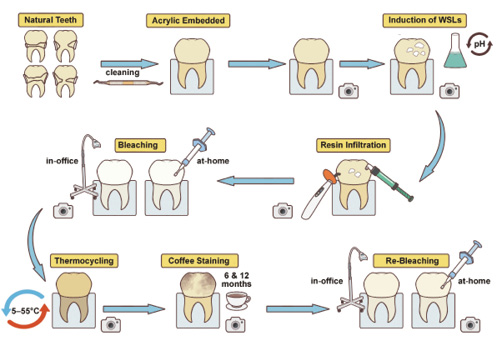
Specimen handling, storage and processing were standardized across groups, with treatment protocols applied according to group assignment. After staining, all specimens were re-bleached: URG, LIG and ICW with the in-office protocol; and IAW with the at-home protocol described above. Given that this was a secondary analysis of an existing dataset, no additional stratification was introduced. Instead, randomization and uniform baseline selection in the original study helped minimize interspecimen heterogeneity. All treatment steps are summarized in the flowchart presented in Figure 1. The materials used are listed in Table 1.
Color measurements were obtained at 10 defined stages: T0 – baseline; T1 – after WSL creation; T2 – after resin infiltration; T3 – after bleaching (ICW and IAW only); T4 – after 14 days of storage in distilled water; T5 – after thermocycling (5,000 cycles, 5–55°C); T6 – after 6 days of coffee staining; T7 – after 12 days of coffee staining; T8 – after re-bleaching (all groups); and T9 – after a final 14-day storage in distilled water. The ΔE values were calculated relative to the individual baseline values (T0).
Color analysis
Color analysis was performed using standardized digital photographs taken at each of the 10 treatment stages. For each specimen at each treatment stage, measurements were performed in triplicate (using 3 independent standardized photographs obtained under identical conditions), and the mean CIELAB values from these triplicate images were used for analysis. All camera settings and flash configurations followed the imaging protocol established by Schoppmeier et al.,6 ensuring uniform imaging conditions throughout the study.
A controlled photographic environment was used, incorporating a PULUZ lightbox (40 cm, 24 W, 5,500 K white light; PULUZ, Shenzhen, China) and a tripod to stabilize the camera. The surface contour was delineated on the first image to ensure consistent region-of-interest alignment, and the same outline was applied to subsequent images, maintaining consistent size, orientation and position. Calibration was performed for each image using a ColorChecker Passport Photo neutral gray reference card (X-Rite, Inc., Grand Rapids, USA) placed adjacent to the specimen. This allowed for the correction of white balance and brightness standardization directly within Adobe Photoshop Lightroom 9.4 (Adobe Inc., San Jose, USA). Using the gray reference card, brightness deviations (L*) were corrected, and RGB (red, green, blue) values were extracted under standardized lighting conditions. The extracted RGB values were then converted to the CIELAB color space. Color distributions across all study phases were assessed according to the standards defined by the International Commission on Illumination (CIE).
Color differences (ΔE values) were calculated using the following formula:
A value of ΔE ≥ 3.7 was used to identify color differences equal to or exceeding the predefined threshold of clinical relevance.17
Statistical analysis
The data analyzed in this secondary analysis originated from a previously conducted, single-center in vitro study.23 Although the colorimetric measurements were based on the prior dataset, the statistical analysis, including the estimation of bootstrap-based confidence intervals (CIs) and effect sizes, and the development of the LAB Color Tool and reference atlas were newly designed and implemented for the present manuscript. Colorimetric data (L*, a*, b* and ΔE) was analyzed descriptively and visually to assess temporal changes across all treatment phases. Scatterplots with locally estimated scatterplot smoothing (LOESS), a non-parametric regression technique that fits multiple low-degree polynomials to localized subsets of the data, were used to illustrate dynamic trends and key transition points in color alteration. Color differences (ΔE) were calculated using the CIELAB formula relative to the individual baseline measurement (T0) for each specimen. To account for the limited sample size and potential deviations from normality, bootstrap resampling (5,000 iterations, with replacement; n = 15 per group) was applied to estimate means, medians, standard deviations, and Cohen’s d effect sizes. Between-group effect sizes were calculated as the first-named minus the second-named group (negative d = higher value in the second-named group); within-group effect sizes were calculated as the earlier minus the later time point (negative d = increase over time). Corresponding 95% and 99% CIs were computed to enhance robustness and facilitate comparisons across groups and time points. All statistical analyses were performed using R, v. 4.3.1 (R Foundation for Statistical Computing, Vienna, Austria), employing the boot and ggplot2 packages. This non-parametric approach enabled inference without requiring an assumption of normality.
LAB Color Tool
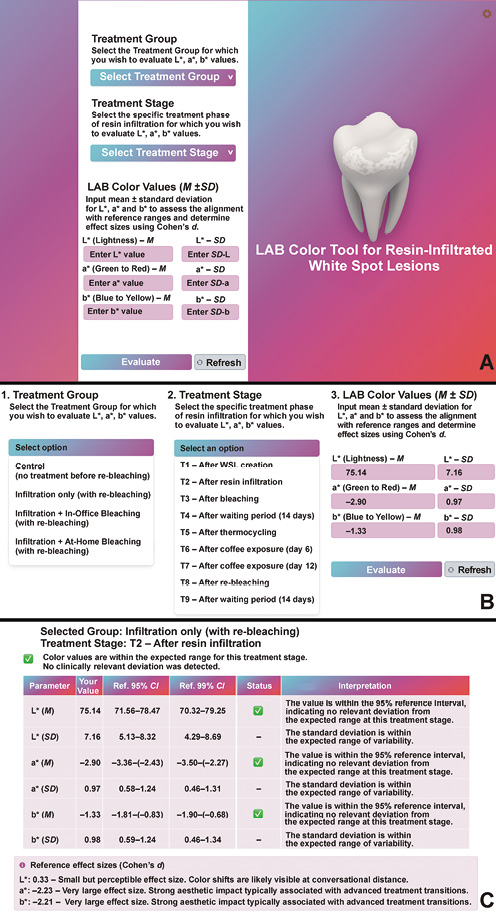
Based on the data generated in this study, a software-based analysis tool was developed (https://color-atlas-wsl.netlify.app) to evaluate CIELAB color values across various treatment phases of resin-infiltrated WSLs (Figure 2A). A comprehensive reference database was created, containing mean values as well as 95% and 99% CIs for L*, a* and b* coordinates across all relevant treatment stages.
The LAB Color Tool allows users to enter individual LAB values (L*, a*, b*) along with optional statistical parameters such as the mean and standard deviation. Users can specify the corresponding treatment stage, e.g., “natural tooth”, “white spot lesion” or “post-infiltration” (Figure 2B).
An internally developed algorithm automatically compares the entered values with the reference ranges and provides real-time feedback via a three-tier traffic light system (Figure 2C):
• green – values within the 95% CI; the measurement is considered consistent with the reference mean;
• orange – values between the 95% and 99% CIs; minor methodological adjustments are recommended to optimize alignment with reference data;
• red – values outside the 99% CI; the system advises checking the experimental setup or measurement conditions due to a significant deviation from expected norms.
In addition to qualitative color assessment, the tool calculates Cohen’s d as a measure of effect size, allowing for the quantification of the practical significance of deviations from reference values. This facilitates interpretation within an experimental context and supports accurate sample size estimation for future studies.
The tool was implemented as a browser-based web application (HTML/JavaScript) with the reference database embedded; all calculations are performed locally in the browser. The primary aim of the tool is to assist users in standardizing the evaluation of color changes, detecting methodological inconsistencies early, and enhancing the interpretive quality of aesthetic assessments in dental research and clinical practice.
Results
Analysis of CIELAB color parameters in relation to ΔE values
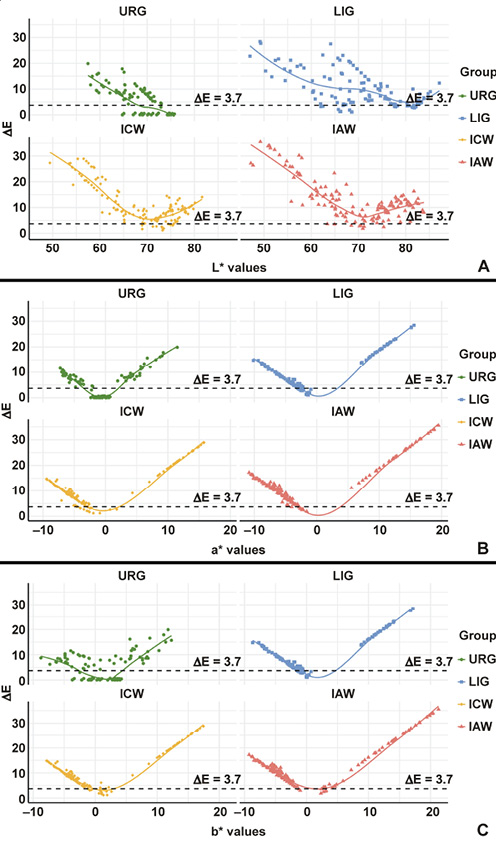
Effect sizes were interpreted according to Cohen’s conventional thresholds, with d = 0.2–0.49 indicating a small effect, d = 0.5–0.79 – a medium effect, and d ≥ 0.8 – a large effect. Additionally, values ≥1.2 were categorized as very large effects. Unlike the chromatic components (a* and b*), the lightness parameter (L*) in the CIELAB color space showed no linear correlation with the calculated ΔE values (Figure 3). The L* value reflects the brightness of a color on a scale from 0 (black) to 100 (white), with higher values indicating lighter tooth shades. While both a* and b* values demonstrated an approximately linear relationship with ΔE, the L* component exhibited a non-linear distribution. Particularly in the medium-to-high brightness range (L* > 60), a greater dispersion of ΔE values was observed, without a consistent increase in ΔE as lightness increased.
In the control group (URG), the L* values remained stable at approx. 71 up to T5, with ΔE values far below the threshold of 3.7 (≤0.5). Only coffee staining produced large deviations (ΔE: 8.7–12.9 at T6–T7), which re-bleaching reduced but did not eliminate (ΔE: 7.2 at T9) (Figure 3A). The LIG group showed a comparable pattern at a slightly higher lightness level (URG vs. LIG at T9: d = –0.25, 95% CI: –1.07, 0.47 for L*; d = –0.87, 95% CI: –1.81, –0.20 for ΔE). In contrast, both bleaching groups showed higher L* values and greater variability after bleaching (URG vs. ICW at T3: d = –1.57, 95% CI: –2.54, –0.98; URG vs. IAW at T3: d = –1.80, 95% CI: –3.14, –0.97). High ΔE values (>10) were observed both at high L* levels (>75; LIG vs. ICW at T3: d = –3.02, 95% CI: –4.39, –2.34) and in the mid-range after staining. The overall distribution of L* and ΔE data points was non-linear, with marked variability, especially in the bleaching groups.
The a* parameter (green–red axis) showed a largely linear relationship with ΔE across all groups (Figure 3B). The a* values ranged from negative (greenish) to strongly positive (reddish), depending on group and stage. Low ΔE values (<3.7) were predominantly observed near a* ≈ 0. With increasing a* values, ΔE also increased, most notably in the bleaching groups during staining (URG vs. IAW at T6: d = –2.80, 95% CI: –4.47, –2.05; at T7: d = –2.25, 95% CI: –3.51, –1.56). In the control group, a* and ΔE remained within narrow limits up to T5 (URG, T1 vs. T5: d = –0.35, 95% CI: –1.12, 0.34).
A similar positive correlation was found between the b* values (blue–yellow axis) and ΔE (Figure 3C). Higher b* values (increased yellowness) were associated with greater color deviation. In the IAW group, the b* values exceeding 15 were associated with ΔE > 10 (URG vs. IAW at T7: d = –2.15, 95% CI: –3.29, –1.47). The bleaching groups also showed negative b* values immediately after bleaching, likewise accompanied by high ΔE values (URG vs. ICW at T3: d = 2.97, 95% CI: 2.22, 4.43). The control group demonstrated a narrower range of b* values and low ΔE values up to T5.
Temporal progression of CIELAB components across 9 treatment time points (T1–T9)
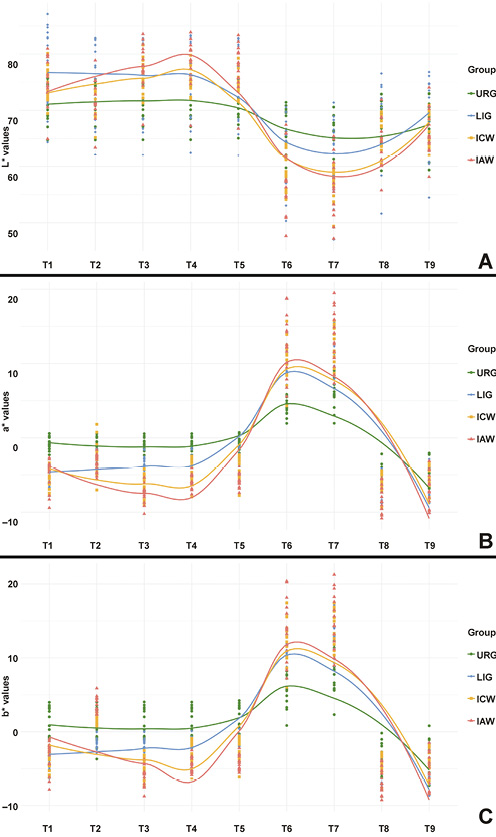
The progression of the L* values revealed group-specific patterns (Figure 4A). In the control group, L* remained constant at approx. 71 from T1 to T5. Coffee staining caused a marked decline to approx. 64 at T7 (URG, T5 vs. T7: d = 2.00, 95% CI: 1.37, 2.99), followed by a partial recovery to approx. 67 after re-bleaching (T7 vs. T9: d = –0.79, 95% CI: –1.62, –0.09).
In the LIG group, lesion creation raised L* to approx. 78 (T1), and resin infiltration reduced it to approx. 75 (LIG, T1 vs. T2: d = 0.33, 95% CI: –0.38, 1.08; URG vs. LIG at T2: d = –0.70, 95% CI: –1.65, –0.02). Values remained at this level up to T5, dropped to approx. 61 during staining (T5 vs. T7: d = 1.85, 95% CI: 1.21, 2.74) and recovered to approx. 68 at T9 (T7 vs. T9: d = –1.02, 95% CI: –1.85, –0.37).
The bleaching groups exhibited more dynamic L* profiles. In the ICW group, L* increased from approx. 70 after infiltration to 76 after in-office bleaching (ICW, T2 vs. T3: d = –2.11, 95% CI: –3.18, –1.50; URG vs. ICW at T3: d = –1.57, 95% CI: –2.54, –0.98) and remained at approx. 75 at T4 (URG vs. ICW at T4: d = –1.49, 95% CI: –2.40, –0.86). The IAW group reached approx. 78 after at-home bleaching (URG vs. IAW at T3: d = –1.80, 95% CI: –3.14, –0.97). During staining (T6–T7), both bleaching groups showed the most pronounced decrease, reaching a minimum of approx. 57 at T7 (URG vs. ICW: d = 1.84, 95% CI: 1.22, 2.90; URG vs. IAW: d = 1.44, 95% CI: 0.75, 2.47). After re-bleaching, L* rose again to approx. 66 at T9 in both groups (ICW, T7 vs. T9: d = –3.28, 95% CI: –4.44, –2.70; IAW, T7 vs. T9: d = –1.96, 95% CI: –3.07, –1.29), no longer differing from the control group (URG vs. ICW at T9: d = 0.19, 95% CI: –0.54, 1.04; URG vs. IAW at T9: d = 0.29, 95% CI: –0.38, 1.13).
The a* values also followed distinct group-specific trajectories (Figure 4B). In the control group, they remained close to the neutral axis (a* ≈ –1) through T5. From T6 onward, a noticeable increase in redness was observed, peaking at approx. 7 at T7 (URG, T5 vs. T7: d = –3.84, 95% CI: –6.02, –2.94). After re-bleaching of the control specimens with the in-office protocol (T8), the a* values fell to approx. –5 and remained there at T9 (T7 vs. T9: d = 5.51, 95% CI: 4.50, 8.21).
In the LIG group, the a* values were negative after lesion creation (approx. –5 at T1) and shifted toward neutral after resin infiltration (approx. –3 at T2; LIG, T1 vs. T2: d = –2.23, 95% CI: –3.19, –1.65; URG vs. LIG at T2: d = 2.36, 95% CI: 1.57, 3.82). They remained at this level up to T5, rose to approx. 10–11 during staining (T5 vs. T7: d = –7.40, 95% CI: –10.92, –6.11) and dropped to approx. –7 after re-bleaching (T7 vs. T8: d = 8.67, 95% CI: 7.35, 11.82).
In the bleaching groups, the a* values decreased further into the negative range (<–5) following whitening (URG vs. ICW at T3: d = 5.03, 95% CI: 4.15, 6.92), with a more pronounced decrease in the IAW group (URG vs. IAW at T3: d = 6.51, 95% CI: 5.26, 9.33). After stabilizing during T4–T5, the values increased substantially during staining (URG vs. IAW at T6: d = –2.80, 95% CI: –4.47, –2.05). The IAW group exhibited the highest a* values recorded in the study at T7 (approx. 14; URG vs. IAW: d = –2.25, 95% CI: –3.51, –1.56). After re-bleaching (T8), the a* values declined again across the groups, remaining below –5 at T9 (URG vs. IAW: d = 1.02, 95% CI: 0.38, 1.95).
The b* values also displayed characteristic patterns (Figure 4C). In the control group, values remained stable around b* ≈ 1 until T5. From T6 onward, yellowness increased, reaching a maximum of approx. 8 at T7 (URG, T5 vs. T7: d = 2.76, 95% CI: –4.08, –2.06). After re-bleaching, values decreased and became negative (approx. –3 at T9; URG, T7 vs. T9: d = 4.54, 95% CI: 3.60, 6.34).
In the LIG group, the b* values were approx. –4 after lesion creation and approx. –1 from T2 to T5 (URG vs. LIG at T5: d = 1.13, 95% CI: 0.45, 2.18). Staining caused an increase to approx. 13 at T7 (T5 vs. T7: d = –7.29, 95% CI: –10.78, –5.96), and re-bleaching reduced them to approx. –5 (T7 vs. T8: d = 8.65, 95% CI: 7.32, 11.92).
In the bleaching groups, a marked decline in b* was observed after bleaching (T3), with minima of approx. –5 (ICW) and –6 (IAW) (URG vs. ICW: d = 2.97, 95% CI: 2.22, 4.43; URG vs. IAW: d = 3.65, 95% CI: 2.83, 5.23); values remained below –2 at T4 (URG vs. ICW: d = 1.93, 95% CI: 1.24, 3.02). During the subsequent aging and staining phases (T5–T7), the b* values increased sharply. The ICW group reached approx. 14 (URG vs. ICW at T7: d = –2.38, 95% CI: –3.61, –1.75), while the IAW group exhibited the highest values recorded throughout the study (b* > 15 at T7; URG vs. IAW: d = –2.15, 95% CI: –3.29, –1.47). After re-bleaching (T8), values decreased again, returning to the negative range at T9 (b* < –4; IAW, T7 vs. T9: d = 6.73, 95% CI: 5.63, 9.38; URG vs. IAW at T9: d = 0.88, 95% CI: 0.20, 1.79).
Discussion
This study provides a detailed visual and quantitative depiction of the aesthetic appearance of resin-infiltrated WSLs and changes in their color across the entire course of a multiphase treatment protocol. By simulating a clinically relevant discoloration cycle, we generated a comprehensive color atlas that may serve as a practical reference for both clinicians and researchers. While color atlases for dental hard tissues have been proposed in previous semi-quantitative ΔE studies, the novelty of our atlas lies in the combination of raw phase-specific CIELAB data, effect size statistics and visual mapping. The innovative merit of this approach lies not only in the dynamic, stage-by-stage monitoring of colorimetric changes, but also in enabling targeted comparisons between specific treatment points. This dual applicability allows for both longitudinal evaluation and assessments at individual time points, offering a versatile framework for aesthetic diagnostics and treatment planning – an aspect largely underrepresented in the existing literature. The CIELAB parameters and the derived ΔE values formed the basis of the atlas, enabling a nuanced and evidence-based assessment of color dynamics in infiltrated lesions.17, 25 Given the acknowledged differences between measurements obtained using digital image analysis and spectrophotometry, especially in complex enamel morphologies, we implemented a standardized photographic protocol (calibrated light source, neutral background, color calibration chart, 3 photographs per specimen) and used the mean of the 3 measurements for each specimen to minimize random error. Although direct spectrophotometric validation was outside the scope of the present study, the literature suggests that calibrated digital imaging can achieve acceptable agreement with spectrophotometry in determining ΔE values when strict acquisition protocols are followed.6
While previous studies primarily reported aggregated ΔE or ΔLAB values,26 this investigation captured and analyzed individual CIELAB values at each treatment stage, providing a distinct advantage for objective aesthetic evaluation. A ΔE of ≥3.7 was defined as the threshold for clinically relevant color differences (the conservative upper limit), based on the CIE and dental visual perception literature, to ensure a consistent reference. A key finding was the non-linear relationship between lightness (L*) and ΔE. Although the a* and b* values showed a largely linear correlation with color difference, the L* values, especially in the medium-to-high lightness range (L* > 70), exhibited pronounced scatter. This indicates that lightness alone is not a reliable predictor of perceived color change. Notably, ΔE values >10 were observed in the bleaching groups despite comparable L* values, underscoring the dominant role of chromatic components in subjective color perception.
The trajectories of the a* and b* values provided meaningful insights into the dynamics of aesthetic changes throughout treatment. In teeth subjected to bleaching, the a* values, already negative after lesion creation and infiltration, decreased further after bleaching (T3), indicating a reduction in red hues and a shift toward greener tones. In some cases, particularly following at-home protocols, the a* values dropped below –5, reflecting a pronounced chromatic shift. Subsequent exposure to staining agents led to a marked increase in the a* values, underscoring the general susceptibility of bleached enamel to extrinsic pigment uptake. The b* values exhibited characteristic shifts throughout the treatment sequence. Immediately after bleaching (T3), they dropped below 0, indicating a reduction in the yellow component. Following coffee exposure (T7), specimens previously subjected to at-home bleaching showed the most pronounced increase in b* (>15), while those subjected to in-office bleaching reached values of approx. 14. Even untreated control samples exhibited an increase to values exceeding 7. Re-bleaching (T8) led to a marked decrease in both a* and b* values across all experimental groups. At the final assessment (T9), values were below –5 for a* and below –3 for b* in all groups, underscoring the pronounced responsiveness of these colorimetric parameters to both staining and whitening stimuli and supporting their utility for aesthetic monitoring. Before staining, the L* values were approx. 71 in untreated and approx. 75 in resin-infiltrated specimens, within or at the upper margin of the reference range for healthy enamel reported by Karamouzos et al. (L* = 70–75, a* = 3.1–5.0, b* = 15–20).27, 28 Minor deviations in the a* values may be attributed to differences in measurement methodology, particularly between spectrophotometry and digital image23 analysis, highlighting the importance of standardized calibration procedures, especially when assessing teeth with complex surface morphologies, such as premolars or molars.
Consistent with previous studies, the artificial creation of WSLs resulted in an increase in L* and a concomitant decrease in the a* and b* values.29 Comparable studies have reported ΔE values of approx. 7.88 after lesion creation,29 in line with our findings (ΔE: 7.3–7.9 at T1). Resin infiltration partially reversed these effects. The TEGDMA-based infiltrant contributed to the optical blending of the lesion with the surrounding enamel, as reflected in a moderate reduction in the L* values and a partial normalization of the a* and b* values. Knösel et al. reported ΔE values of 5.65, which were slightly above the perceptibility threshold of 3.7.26, 30 In contrast, Schoppmeier et al. found ΔE values below 3.7 in fluorotic lesions treated with triple etching and a 10-minute infiltration protocol.6 Our findings fall between these 2 results, with ΔE values of approx. 3.0–4.1 after infiltration (mean approx. value: 3.6).
Color changes following bleaching closely matched those reported by Sinanovic et al.31 for at-home bleaching and by Jacob et al.32 for in-office bleaching. In the present study, bleaching resulted in an increase in lightness (L*) of approx. 6 units, along with reductions in a* of 3–4 units and in b* of 6–10 units. At-home bleaching induced numerically greater color changes (ΔE: 11.7 vs. 9.8 relative to baseline; ICW vs. IAW at T3: d = –0.80, 95% CI: –1.67, –0.12), although the original study found no significant difference in bleaching effectiveness between the 2 protocols.23
The staining susceptibility of resin-infiltrated enamel is well documented.6, 23, 33 Owing to increased water sorption and a higher affinity for extrinsic pigments, RI-treated surfaces are more prone to staining.34 The extent of coffee-induced discoloration observed in this study is consistent with previous findings,35 showing a marked decline in L* and linear increases in a* and b*, especially in the IAW group (b* > 15; ΔE > 10), underscoring the susceptibility of this group to staining.
For the first time, this analysis documented CIELAB coordinate changes after re-bleaching of previously stained resin-infiltrated lesions. Re-bleaching reversed most of the staining-induced changes: ΔE relative to baseline decreased from 21.1, 23.6 and 25.1 at T7 to 9.5, 8.3 and 10.7 at T9 in the LIG, ICW and IAW groups, respectively (within-group T7 vs. T9 effect sizes for a* and b*: d = 5.5–9.5). However, a complete return to baseline or post-infiltration values was not achieved. The a* and b* values fell below their pre-staining levels (approx. –5 to –7 and –4 to –5, respectively), and L* remained approx. 6–9 units lower than before staining, so that final mean ΔE values exceeded 3.7 in all groups, including the re-bleached control (ΔE = 7.2). At T9, the L* values in the bleaching groups did not differ significantly from those of the control group (URG vs. ICW: d = 0.19, 95% CI: –0.54, 1.04; URG vs. IAW: d = 0.29, 95% CI: –0.38, 1.13), and the ICW group did not differ from the control in ΔE either (d = –0.49, 95% CI: –1.23, 0.23). The IAW group, however, retained a higher ΔE (10.7 vs. 7.2; URG vs. IAW: d = –1.22, 95% CI: –2.22, –0.54) and more negative a* and b* values than the control (d = 1.02, 95% CI: 0.38, 1.95; and d = 0.88, 95% CI: 0.20, 1.79, respectively). Thus, in-office bleaching did not worsen the final outcome compared with untreated enamel subjected to the same staining and re-bleaching protocols, whereas at-home bleaching left a small residual color difference. The convergence of the groups after re-bleaching supports the relative color stability of resin-infiltrated enamel under staining and re-bleaching, whereas the residual deviation from baseline shows that the simulated 12 months of coffee exposure left a persistent change in all groups.
Potential clinical relevance
The color atlas developed in this study may, following validation, provide clinicians with a tool to assist in treatment outcome prediction, planning and patient communication.
A major advantage of the atlas is its standardization of colorimetric evaluation criteria: clinicians can refer to defined reference ranges to objectively determine the effectiveness of each treatment step. This enables the differentiation between acceptable outcomes and those requiring additional interventions, such as re-infiltration or bleaching. By documenting color dynamics over time, the atlas also helps establish realistic expectations regarding potential relapses or long-term changes. Moreover, by capturing the dynamic progression of color changes across multiple treatment phases, the atlas allows clinicians to anticipate potential relapses or long-term aesthetic alterations. Building on this, the dataset may also serve as a foundation for the development of artificial intelligence (AI)-based predictive models. Such models could be trained to estimate post-treatment CIELAB values based on a tooth’s baseline characteristics and the selected therapeutic pathway. In future applications, these predicted color values might be translated into visual representations of the expected outcome, offering clinicians and patients an individualized, data-driven preview of treatment effects. This would not only support shared decision-making but also open new avenues for real-time clinical decision support. Further research is warranted to explore the feasibility, accuracy and clinical applicability of such AI-driven prediction systems within the CIELAB framework. As new data is continuously integrated and the underlying database expands, the precision of the color atlas will improve further. A broader dataset could enhance the differentiation between physiological and treatment-induced color changes and support the development of predictive models for the long-term color stability of resin-infiltrated lesions. In this sense, the atlas need not remain a static reference but could evolve with the growing body of evidence, offering an increasingly precise foundation for clinical and scientific decision-making.
Limitations
Despite providing a robust foundation for understanding color changes in resin-infiltrated WSLs, certain limitations must be acknowledged. The sample was restricted to extracted third molars. Although the simulation protocols expanded the dataset, larger and more diverse samples, particularly including anterior teeth, are needed to ensure broader clinical applicability. It remains unclear whether the observed color change patterns also apply to teeth of greater aesthetic relevance. In this in vitro model, the operator was not blinded to treatment allocation during the procedures such as bleaching or resin application; however, all measurements and data analyses were performed by an examiner blinded to group allocation. Clinical studies with larger, more heterogeneous patient populations are required to validate the long-term aesthetic outcomes of RI treatment. Longitudinal investigations may provide insights into the durability of treatment outcomes and allow for the systematic analysis of patient-dependent factors such as diet and oral care. In addition, the traffic light classification of the LAB Color Tool compares a measurement with the CI of the reference group mean rather than with a prediction interval for individual teeth; it should therefore be regarded as an exploratory aid, not as a diagnostic reference range. Further development of the LAB Color Tool is desirable, with a focus on improving precision and customization in the evaluation of color changes. Such research will help optimize the clinical application of resin infiltration in aesthetic dentistry and improve its predictive value in daily practice.
Conclusions
This study presents a systematically structured, phase-specific documentation of colorimetric changes in resin-infiltrated WSLs, encompassing all clinically relevant stages, from lesion creation to infiltration, bleaching, staining, and re-bleaching. While prior investigations have reported isolated ΔE values at selected time points, the present analysis offers a continuous, multiphase mapping of L*, a*, b*, and ΔE data, thereby enabling a nuanced understanding of dynamic color shifts in minimally invasive enamel therapy.
The results revealed that the chromatic components a* and b* correlated more strongly with measured color differences than the lightness parameter (L*), particularly in the context of bleaching-induced alterations. This underscores the clinical utility of chromatic monitoring in the aesthetic evaluation of infiltrated lesions. The accompanying LAB evaluation tool, while presently a prototype, provides standardized color metrics and a reference-based interpretive framework. By enabling objective phase-specific assessments and facilitating clinician–patient communication, it may support more reproducible decision-making in aesthetic dentistry. Future validation against spectrophotometric gold standards and interface enhancements (e.g., calibration routines, colorblind accessibility) are planned. Finally, re-bleaching largely reversed extrinsic discoloration in infiltrated enamel, although final color values did not fully return to baseline. At the final assessment, lightness did not differ between the bleaching groups and the untreated control, and only the at-home bleaching group retained a small residual color difference. These findings support the potential for aesthetic stability of resin infiltration under simulated aging and staining conditions, provided that discoloration is addressed by re-bleaching.
Ethics approval and consent to participate
The study was approved by the Ethics Committee of the Faculty of Medicine, University of Cologne, Germany (approval No. 23-1472; March 28, 2024).
Data availability
The datasets generated and/or analyzed during the current study are available from the corresponding author on reasonable request.
Consent for publication
Not applicable.
Use of AI and AI-assisted technologies
Claude (Anthropic, San Francisco, USA) was used as a coding assistant for the browser-based implementation of the LAB Color Tool presented in this manuscript. The authors reviewed and validated the generated code and the embedded reference data and take full responsibility for the content of the manuscript.