Abstract
Background. Various parameters are used in cephalometric diagnosis to assess the sagittal discrepancy of the maxillary bases.
Objectives. The aim of this study was to assess the role of the horizontal and vertical dispersion of anthropometric landmarks used for plotting, and to assess the reliability of the selected cephalometric parameters.
Material and methods. The material consisted of 24 randomly selected cephalometric radiographs. They were analyzed twice, 7 days apart, by 15 orthodontists. The horizontal and vertical dispersion (x, y) of individual anthropometric landmarks was assessed using the mean reference value, and the reliability of individual landmarks and measurements was assessed using the intraclass correlation coefficient (ICC(2.1)).
Results. The ICC(2.1) for each landmark ranged from 0.9907 to 0.9998. The ICC(2.1) for individual sagittal discrepancy measurements averaged 0.9370 to 0.9842. The highest reliability was achieved for the ANB, W, Sar, Wits, Tau, and Yen measurements, respectively. The obtained results indicate excellent reliability in determining landmarks. The measurements of the selected parameters assessing the sagittal incongruence relationship between the maxilla and the mandible also demonstrated excellent reliability.
Conclusions. The highest reliability in assessing the sagittal relationship between the maxilla and the mandible continues to be demonstrated by the ANB angle. The high and comparable values of the Sar, W, Tau, and Yen angles indicate the possibility of using these parameters interchangeably or complementarily in diagnosis and treatment planning, especially in borderline cases.
Keywords: orthodontics, algorithms, reproducibility of results, statistics and numerical data, cephalometry
Introduction
The method of choice for precisely assessing the sagittal relationship between the maxilla and the mandible1, 2, 3, 4, 5, 6, 7, 8, 9, 10, 11, 12, 13, 14, 15, 16, 17, 18, 19, 20, 21, 22, 23 is cephalometric analysis. Since the 1930, when Broadbent and Hofrath introduced cephalometry,4 the number of new cephalometric analyses based on new landmarks has been steadily increasing. One reason for this is the desire to find methods that are least susceptible to disturbances that could affect the measurement results. The authors of these analyses5, 7, 8, 12, 19 indicate that the anthropometric points they proposed, which constitute the basis for obtaining measurements, are less sensitive to changes in the skeletal structure related to growth2, 3, 4, 5, 6, 7, 9 or completed orthodontic treatment2, 3, 4, 5, 6, 7, 8, 9, 10, 11, 12, 13, 14, 15 than the previously used ANB,11, 13 Wits,11 Beta,13 μ,16 ODI (Overbite Depth Indicator),2 and APDI (Anteroposterior Dysplasia Indicator)2 measurements. In a systematic review from 2022, the authors identified several new angular measurements (Tau, Yen, Sar, W) based on the new landmarks G, M, W, and T.2
The reliability (i.e., accuracy) of individual Cartesian measurements along the 0X and 0Y axes depends on the repeatability and reproducibility of landmark identification by orthodontists performing the examination. A measurement is considered reliable when it is both precise (repeatable) and consistent across the examiners or repeated assessments (reproducible). In practical terms, reliability is reflected by the overlap of the landmark positions identified by the examiners on the Cartesian coordinate system, or, when perfect overlap is not achieved, by minimal dispersion of the identified points.
Previous studies conducted by Kotuła et al.2, 3, 4, 15, 16, 17 did not demonstrate increased measurement precision with the use of the newly proposed landmarks. Of these, only one study3 evaluated the reliability of the horizontal and vertical dispersion of the landmarks used for the ANB and Tau measurements. The results indicated that clinicians’ knowledge and proficiency in landmark identification play a significant role in improving measurement reliability.
To minimize the limitations of single measurements, especially in borderline cases, clinicians combine parameters from selected analyses and compare them to precisely assess sagittal discrepancy.
The aim of this study was to assess the role of the horizontal and vertical dispersion of 12 anthropometric landmarks. The impact of point identification on the reliability of the Tau, Yen, Sar, W, and Wits angle measurements was assessed in correlation with the ANB angle, considered the “gold standard” (Table 1).
Material and methods
Ethical approval
The study was approved by the Bioethics Committee of the District Medical Chamber (decision 01/173/2023 of March 6, 2023). Written informed patient consent was obtained in accordance with the Declaration of Helsinki.24
Inclusion and exclusion criteria
The following inclusion criteria were established: generally healthy Caucasian patients aged 12–18 years; prior to orthodontic treatment; without developmental defects; with the cephalograms taken at the neutral head position (NHP).
The following exclusion criteria were applied: cephalograms with anatomical abnormalities that hindered the correct identification of landmarks; cephalograms of individuals with significant craniofacial deformities; and cephalograms showing the displacement of bilateral anatomical structures relative to each other.
Characteristics of methods
The sample size (N = 24) was determined assuming a significance level of α = 0.05, an effect size (f) of 0.60, and a statistical power of 80% (1 − β = 0.80). The study included 24 digital lateral cephalograms acquired using a two-dimensional (2D) imaging technique, with 8 radiographs representing each of the 3 skeletal classes. The radiographs were randomly numbered from 1 to 24 and entered into an Excel spreadsheet (Microsoft Corp.; Redmond, USA).
Cephalometric analysis was performed based on the manually identified reference landmarks, using the Ortodoncja software, v. 9.0 (Ortobajt, Wroclaw, Poland), and certified high-resolution NEC MultiSync EA244WMi monitors (NEC, Tokyo, Japan). The monitor specifications included a 24-inch display, a resolution of 1920 × 1200 pixels, a pixel pitch of 0.270 mm, horizontal and vertical viewing angles of 178°, and a contrast ratio of 1000:1. Landmark identification was performed manually on the digital images using a computer mouse. Before analysis, each image was calibrated by one investigator (J.K.) using the 3-centimeter reference ruler available in the software calibration window.
All radiographs were anonymized, randomly coded from 1 to 24, and the orthodontists were blinded to both the image identities and their previous assessments. The anonymized images were distributed to 15 dentists undergoing postgraduate orthodontic training, each with at least 2 years of experience in cephalometric image analysis. After completing the evaluations, the coded datasets were returned to the study supervisor, entered into Excel spreadsheets, and subjected to statistical analysis.
Each examiner performed the cephalometric analyses of the ANB, Wits, Tau, Yen, SAR, and W measurements twice, with a 7-day interval between the assessments. In total, 180 cephalometric analyses were completed, involving the identification of 2,160 anthropometric landmarks and 4,320 measurements along the X- and Y-axes. Overall, 8,640 Cartesian coordinates were analyzed.
The “gold standard” was used only as a reference point for coordinate normalization, not as an absolute diagnostic truth. Its value was defined as the average of the coordinate points identified by the 2 principal investigators (J.K and K.K.). The principal investigators analyzed 1,152 coordinate points. The agreement between them in classifying 24 radiographs into one of the 3 skeletal classes was verified by Fleiss’s kappa coefficient (κ = 0.999). This value indicates excellent inter-individual agreement.
Statistical analysis
Statistical analyses were performed using Statistica, v. 13.3 (TIBCO Software Inc., Palo Alto, USA). The reliability of the horizontal and vertical landmark coordinates, as well as the cephalometric measurements, was assessed using the two-way random-effects intraclass correlation coefficient for absolute agreement (ICC(2.1)). The ICC values were interpreted according to the guidelines proposed by Koo and Li.4
Results
The accuracy of determining the Cartesian coordinates of the 12 cephalometric landmarks determines the reliability of estimating the indices that assess the mutual relationship between the maxilla and the mandible in the sagittal plane.
To accurately assess the location of each of the 12 landmarks on each of the 24 cephalograms included in the study, a reference value was established for each landmark. The reference value was defined as the mean of duplicate measurements of each cephalometric point performed by 2 experts. This reference standard was expressed as Cartesian coordinates (x, y) for each landmark relative to a fixed reference point on each image. The coordinates obtained from each measurement were normalized by subtracting the corresponding reference coordinates for each patient from the measured values.
The ICCs were used to quantify the horizontal and vertical dispersion of individual landmarks.
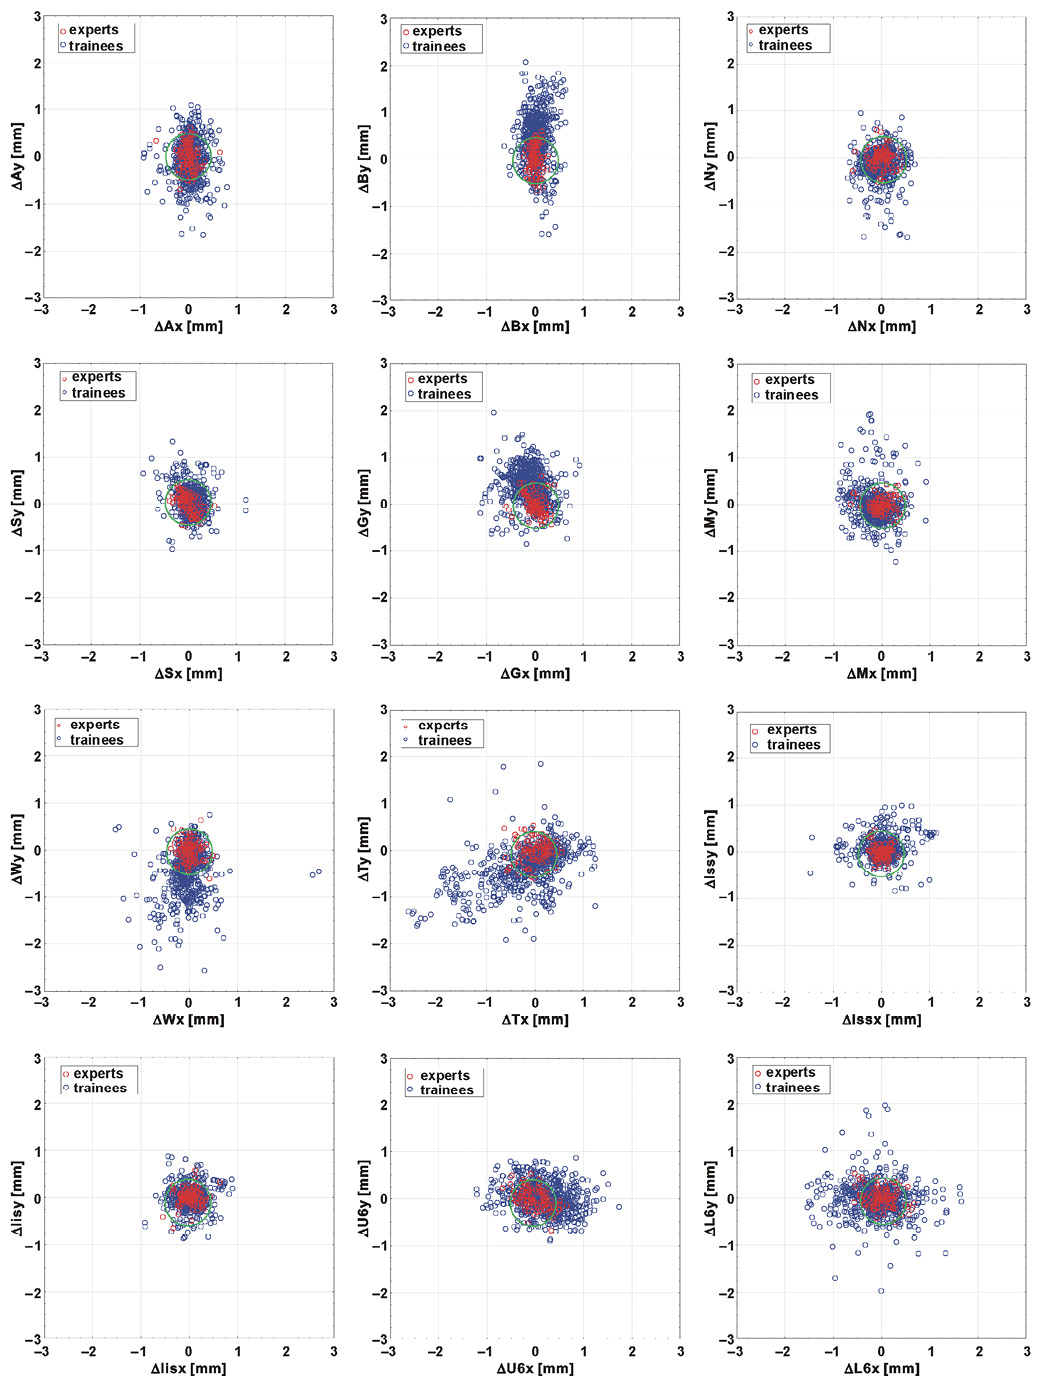
The dispersion of individual landmarks was assessed by comparing the obtained measurements within the corresponding ranges of the identified points at p < 0.001 and a 95% confidence interval (CI) (Figure 1).
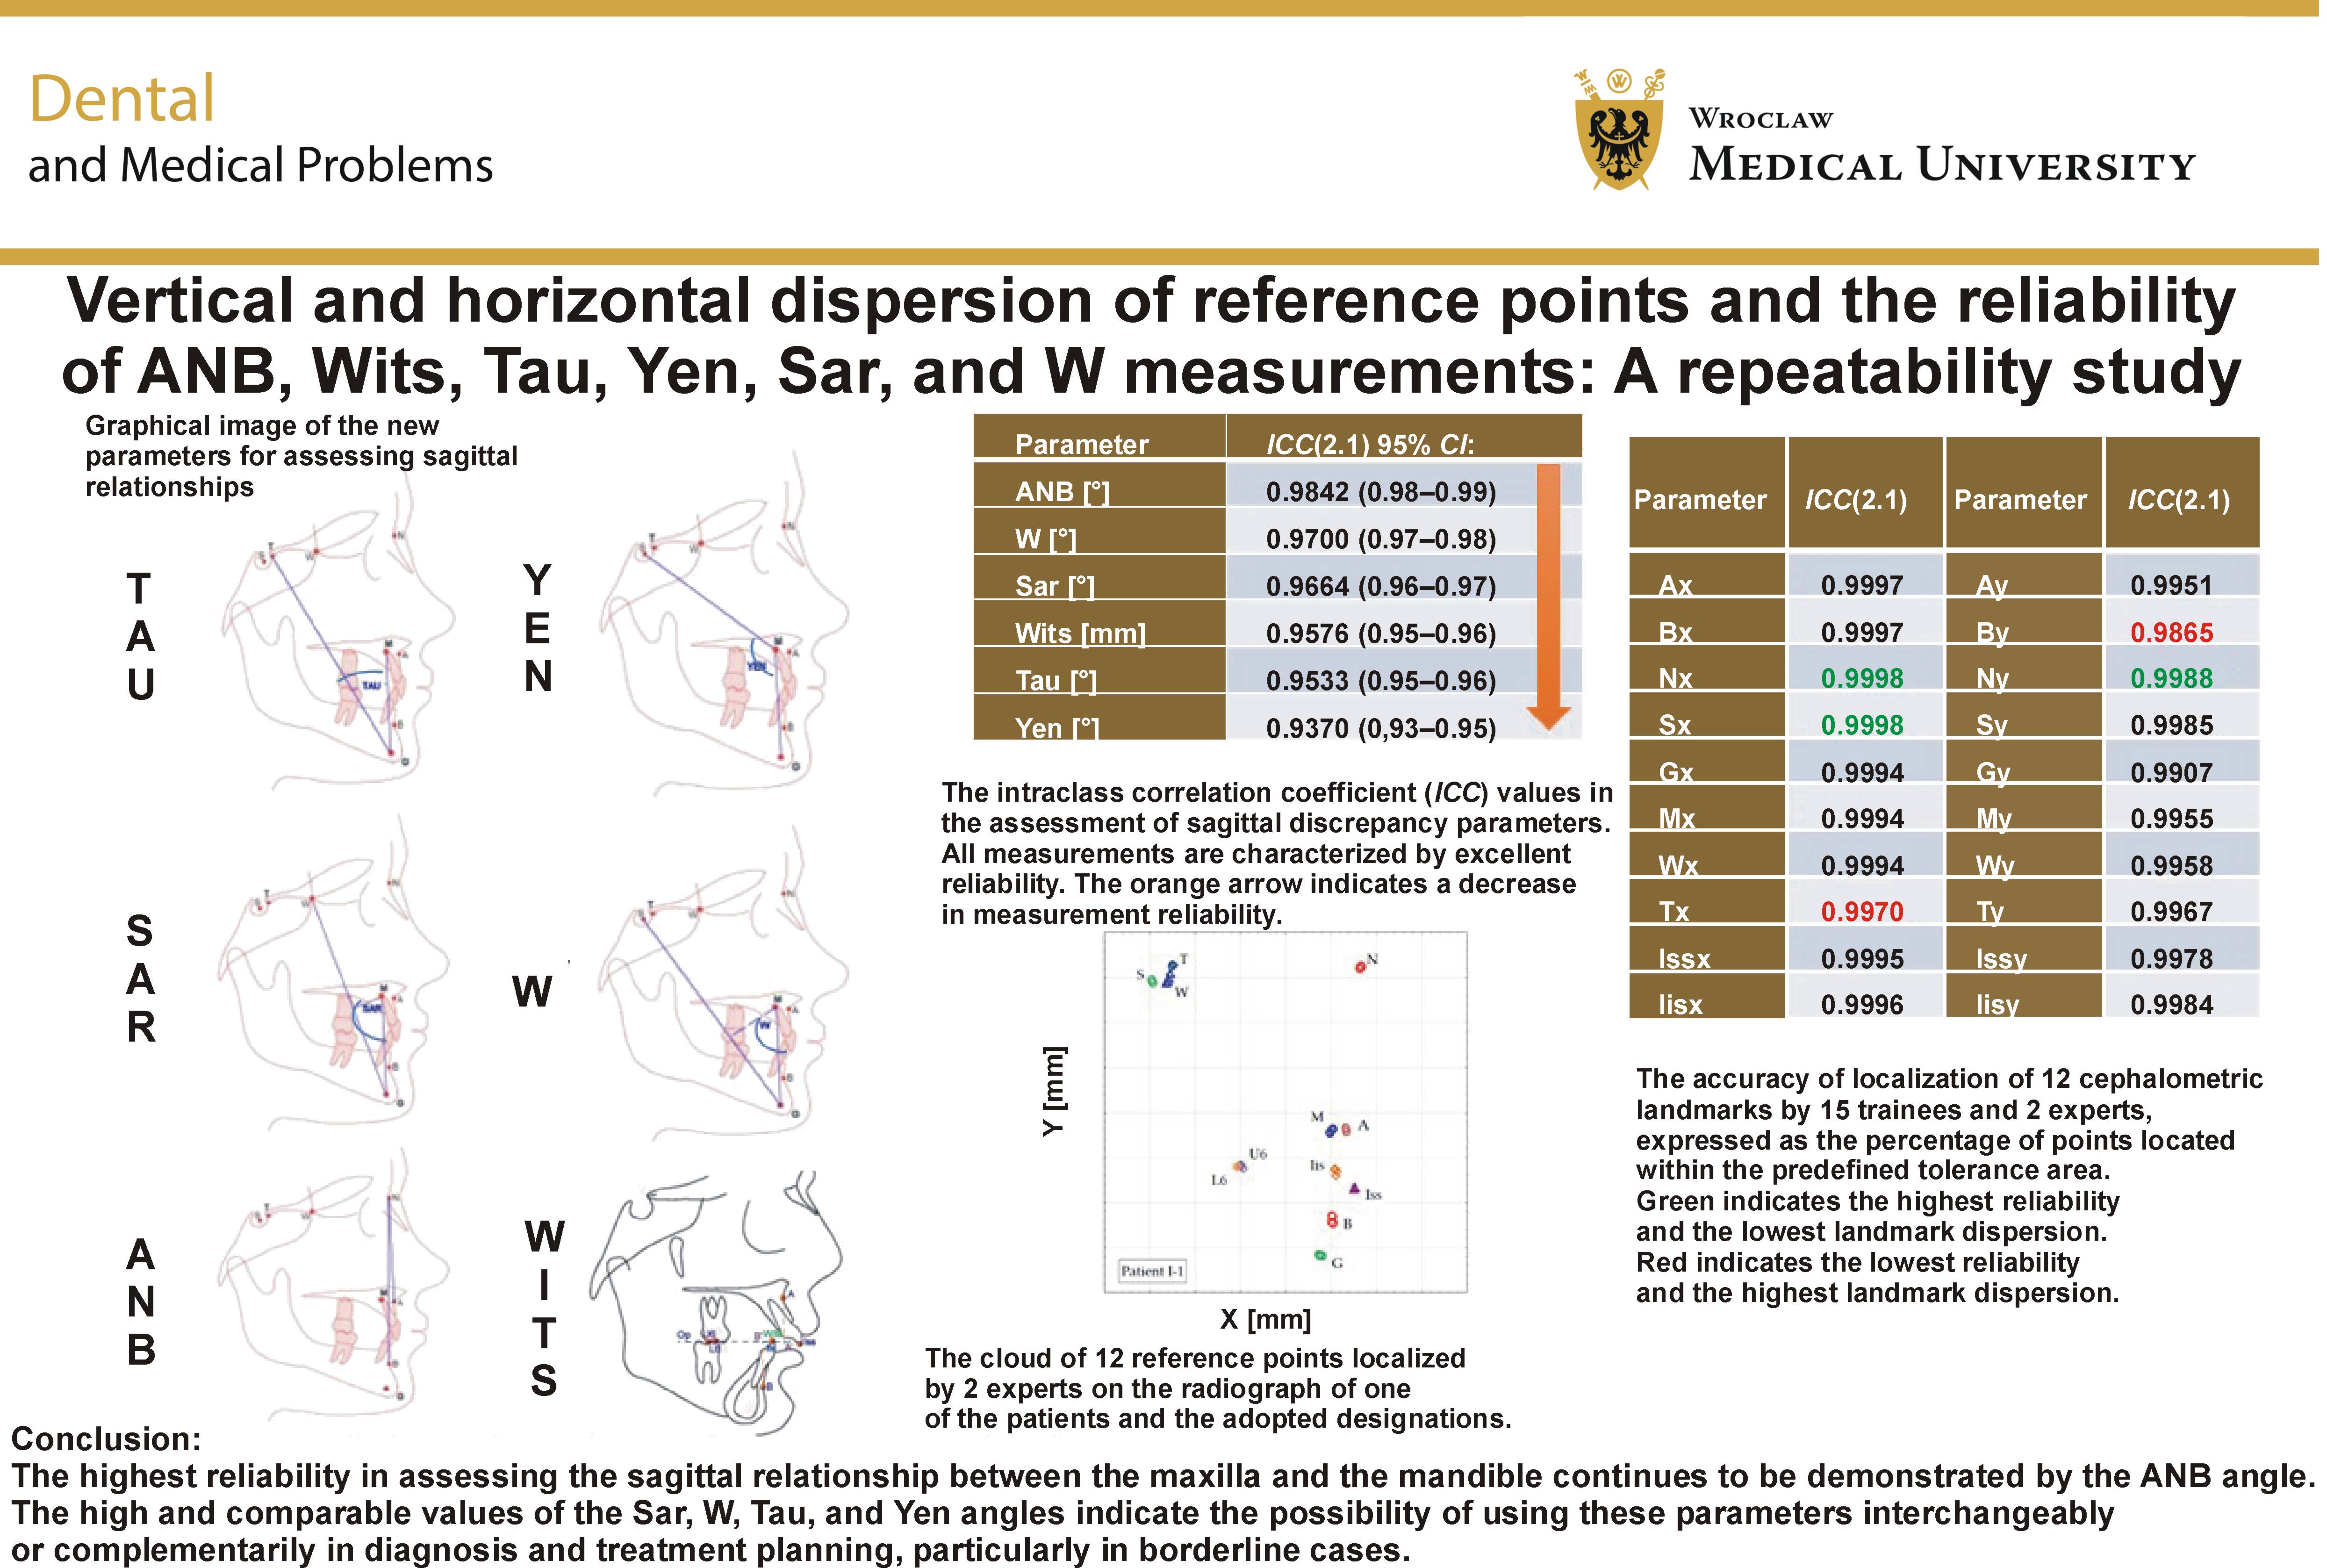
Relative to the X-axis, the Nx and Sx coordinates were identified with the highest precision (ICC(2.1) = 0.9998; 95% CI: 0.9984–0.9999), whereas the Tx coordinate showed the lowest precision (ICC(2.1) = 0.9970; 95% CI: 0.9938–0.9986) . The horizontal precision of the newly introduced landmarks was as follows: Gx, ICC(2.1) = 0.9994 (95% CI: 0.9987–0.9999); Mx, ICC(2.1) = 0.9994 (95% CI: 0.9983–0.9998); Wx, ICC(2.1) = 0.9994 (95% CI: 0.9984–0.9998); and Tx, ICC(2.1) = 0.9970 (95% CI: 0.9938–0.9986). Among the newly introduced landmarks, Tx was identified with the lowest horizontal precision (ICC(2.1) = 0.9970; 95% CI: 0.9938–0.9986.
Relative to the Y-axis, the Ny coordinate demonstrated the highest precision (ICC(2.1) = 0.9988; 95% CI: 0.9978–0.9992), whereas the By coordinate showed the lowest precision (ICC(2.1) = 0.9865; 95% CI: 0.9770–0.9932). The vertical precision of the newly introduced landmarks was as follows: Ty, ICC(2.1) = 0.9967 (95% CI: 0.9958–0.9975); Wy, ICC(2.1) = 0.9958 (95% CI: 0.9948–0.9970); My, ICC(2.1) = 0.9955 (95% CI: 0.9945–0.9965); and Gy, ICC(2.1) = 0.9907 (95% CI: 0.9900–0.9910). Among these landmarks, By was identified with the lowest vertical precision (ICC(2.1) = 0.9865; 95% CI: 0.9770–0.9932).
The overall mean reliability of landmark identification was ICC(2.1) = 0.99 (95% CI: 0.98–0.99).
The Bland–Altman plots demonstrated high repeatability of the measurements, with angular parameters showing a mean difference of approx. 0.01° and the limits of agreement ranging from −1° to 1°, while linear measurements showed a mean difference of approx. 0.01 mm and the limits of agreement ranging from −0.75 to 0.75 mm, indicating high measurement reliability.
The highest reliability for sagittal discrepancy measurements was observed for the following parameters: ANB, ICC(2.1) = 0.9842 (95% CI: 0.98–0.99); W, ICC(2.1) = 0.9700 (95% CI: 0.97–0.98); Sar, ICC(2.1) = 0.9664 (95% CI: 0.96–0.97); Wits, ICC(2.1) = 0.9576 (95% CI: 0.95–0.96); Tau, ICC(2.1) = 0.9533 (95% CI: 0.95–0.96); and Yen, ICC(2.1) = 0.9370 (95% CI: 0.93–0.95). Among the evaluated parameters, the ANB angle demonstrated the highest measurement precision (ICC(2.1) = 0.9842; 95% CI: 0.98–0.99), whereas the Yen angle showed the lowest precision (ICC(2.1) = 0.9370; 95% CI: 0.93–0.95).
As an additional measure of landmark localization accuracy, we calculated the proportion of points located within the predefined tolerance zone. The tolerance zone was arbitrarily defined as a circle with a radius of 0.5 mm centered on the reference point. Localization accuracy was expressed as the ratio of the number of points falling within the tolerance zone to the total number of evaluated points.
Among the measurements performed by the experts, most landmarks (S, M, L6, W, U6, G, and T) were identified with greater precision in the vertical dimension, whereas the N, A and B landmarks were identified more precisely in the horizontal dimension.
Among the measurements performed by the residents, most landmarks (Iis, S, N, A, W, G, and B) were identified with greater precision in the horizontal dimension. In contrast, the Iss, M, L6, U6, and T landmarks were identified with greater precision in the vertical dimension.
Among the experts, the probability of correct landmark identification in both dimensions was highest for the following points, in descending order: Iss, S, Iis, W, M, N, A, B, G, U6, L6, and T. Among the physicians participating in the course, the corresponding order was: Iis, S, N, Iss, M, A, L6, W, U6, G, T, and B.
In the group of 15 trainees, the Iis landmark was identified with the highest accuracy (89.4%), whereas the B landmark showed the lowest accuracy (47.4%). The reduced accuracy of the B landmark was primarily attributable to errors in vertical localization (By). Despite this, the reliability of the ANB angle was not substantially affected.
Discussion
Cephalometric analysis is one of the key components of the diagnostic process preceding orthodontic treatment planning.1, 2, 3, 4, 5, 6, 7, 8, 9, 10, 11, 12, 13, 14, 15, 16, 17, 18, 19, 20, 21, 22, 23, 25, 26, 27, 28, 29 Following the systematic review by Kotuła et al. published in 2022,2 numerous studies have systematically investigated reliable methods for assessing sagittal skeletal discrepancy.3, 4, 5, 6, 7, 8, 9, 10, 12, 14, 15, 18 In the present study, the authors continued these efforts by evaluating the reliability of the ANB, Wits, Tau, Yen, Sar, and W parameters.
Other authors have also commented on these angles. Babbar et al., who evaluated the ANB, Wits, Yen, W, and Pi measurements, demonstrated that all of these parameters can be used to assess the sagittal skeletal relationship.20 In borderline cases, however, they recommended confirming the diagnosis using alternative measurements.20 Kotuła et al. reported that the errors affecting the reliability of sagittal discrepancy measurements, particularly in growing patients, are closely related to accurate landmark identification.3 The positions of landmarks A, N and B may change considerably during growth and throughout orthodontic treatment, complicating the accurate assessment of sagittal discrepancy. In particular, the horizontal dispersion of landmarks A and B relative to the X-axis, together with the vertical dispersion of landmark N relative to the Y-axis, is critical for the reliability of the ANB measurements.3
In assessing the reliability of the Tau angle, the horizontal dispersion of landmarks T and M relative to the X-axis, as well as the vertical dispersion of landmark G relative to the Y-axis, are of particular importance.
In the present study, the ICC values for the horizontal dispersion of landmarks A, N, B, T, M, and G were all greater than 0.997. The ICC value for the vertical dispersion of landmark N (0.9988) indicated excellent agreement between the measurements. Although landmark B exhibited the lowest agreement for vertical localization (By), with an ICC of 0.9865, this did not substantially reduce the reliability of the ANB angle for assessing sagittal discrepancy.
Kotuła et al. noted that the mean differences between the repeated measurements obtained by the same assessor for the ANB, Tau, and Yen angles were minimal.4 However, the wide range of the 95% limits of agreement between measurements remained acceptable. The reliability analysis demonstrated a high level of intraclass agreement.4
Of particular importance is the potentially reduced susceptibility of points G and M to changes associated with growth or orthodontic treatment. This hypothesis was supported by the study of Gupta et al.9 and challenged by the findings of Kotuła et al.4, 16 Therefore, it cannot be conclusively stated that the Tau angle is more resistant to size-related changes associated with mandibular growth rotation.
The results of the study by Khushal et al. indicate that the ANB angle requires critical interpretation, taking into account the patient’s age, maxillary growth rotation, vertical growth pattern, and anterior cranial base length.18 The authors note that the position of the N landmark is not stable throughout growth. Moreover, growth-related changes or orthodontic treatment may alter the positions of landmarks A and B, consequently affecting the ANB measurement. The authors emphasize that excluding the unstable N landmark from the Wits measurement does not eliminate the possibility of measurement errors. The occlusal plane used for this assessment is susceptible to changes resulting from missing teeth or the stage of tooth eruption. These factors may alter the angle and inclination of the occlusal plane, thereby affecting the relative positions of landmarks A and B and, consequently, the Wits measurement itself.18
In the evaluation of measurement reliability across 2 measurement sessions performed by the same orthodontists, no systematic reduction in errors or increase in agreement was observed in the second series of measurements. This finding indicates the stability of landmark identification skills within the research group.
The current research confirms the conclusions of Khushal et al.18 regarding the reliability of the W angle measurement.
Limitations
The study has several limitations: a small number of patients and investigators; the lack of gender differentiation; the lack of a comparative analysis using a longitudinal study; and the use of a single system for cephalometric analyses.
This study is of a pilot nature, and the confirmation of the obtained results requires a longitudinal investigation, particularly in patients undergoing growth and development.
Conclusions
The horizontal and vertical dispersion of landmarks used for the assessment of sagittal discrepancy influences the accuracy of cephalometric diagnosis. The present findings demonstrate the high reliability of the ANB, W, Sar, Wits, Tau, and Yen measurements, supporting their careful application in orthodontic diagnosis and treatment planning, particularly in growing patients.
High-quality lateral cephalometric radiographs contribute to the reliable assessment of landmark localization. To further improve measurement reliability, clinicians should receive appropriate training in landmark identification. In less experienced practitioners, horizontal landmark dispersion appears to play a more significant role in the assessment of sagittal discrepancy.
A major limitation of the Tau, Yen, Sar, and W measurements is their inability to determine which jaw is affected by abnormal development. Therefore, the assessment of their validity requires correlation with SNA and SNB angle analyses.
The limitations of the present study require careful interpretation of the evaluated parameters.
Ethics approval and consent to participate
The study was approved by the Bioethics Committee of the District Medical Chamber (decision 01/173/2023 of March 6, 2023). Written informed patient consent was obtained in accordance with the Declaration of Helsinki.24
Data availability
The datasets supporting the findings of the current study are available from the corresponding author on reasonable request.
Consent for publication
Not applicable.
Use of AI and AI-assisted technologies
Not applicable.