Abstract
Background. The expression of the Wingless-related integration site (WNT) signaling pathway molecules has been reported to be aberrant in periodontitis.
Objectives. This case–control study aimed to determine the salivary concentrations of sclerostin (SOST), Dickkopf-related protein 1 (DKK1) and WNT family member 5a (WNT5a) and their ability to distinguish systemically healthy patients with periodontitis – across different progression rates – from periodontally healthy controls.
Material and methods. A total of 90 individuals participated in this study (30 healthy controls, 30 Grade B periodontitis patients, and 30 Grade C periodontitis patients). Salivary samples were collected using the unstimulated saliva collection method. Subsequently, clinical periodontal parameters were recorded. The enzyme-linked immunosorbent assay (ELISA) was utilized to determine the salivary levels of SOST, DKK1 and WNT5a.
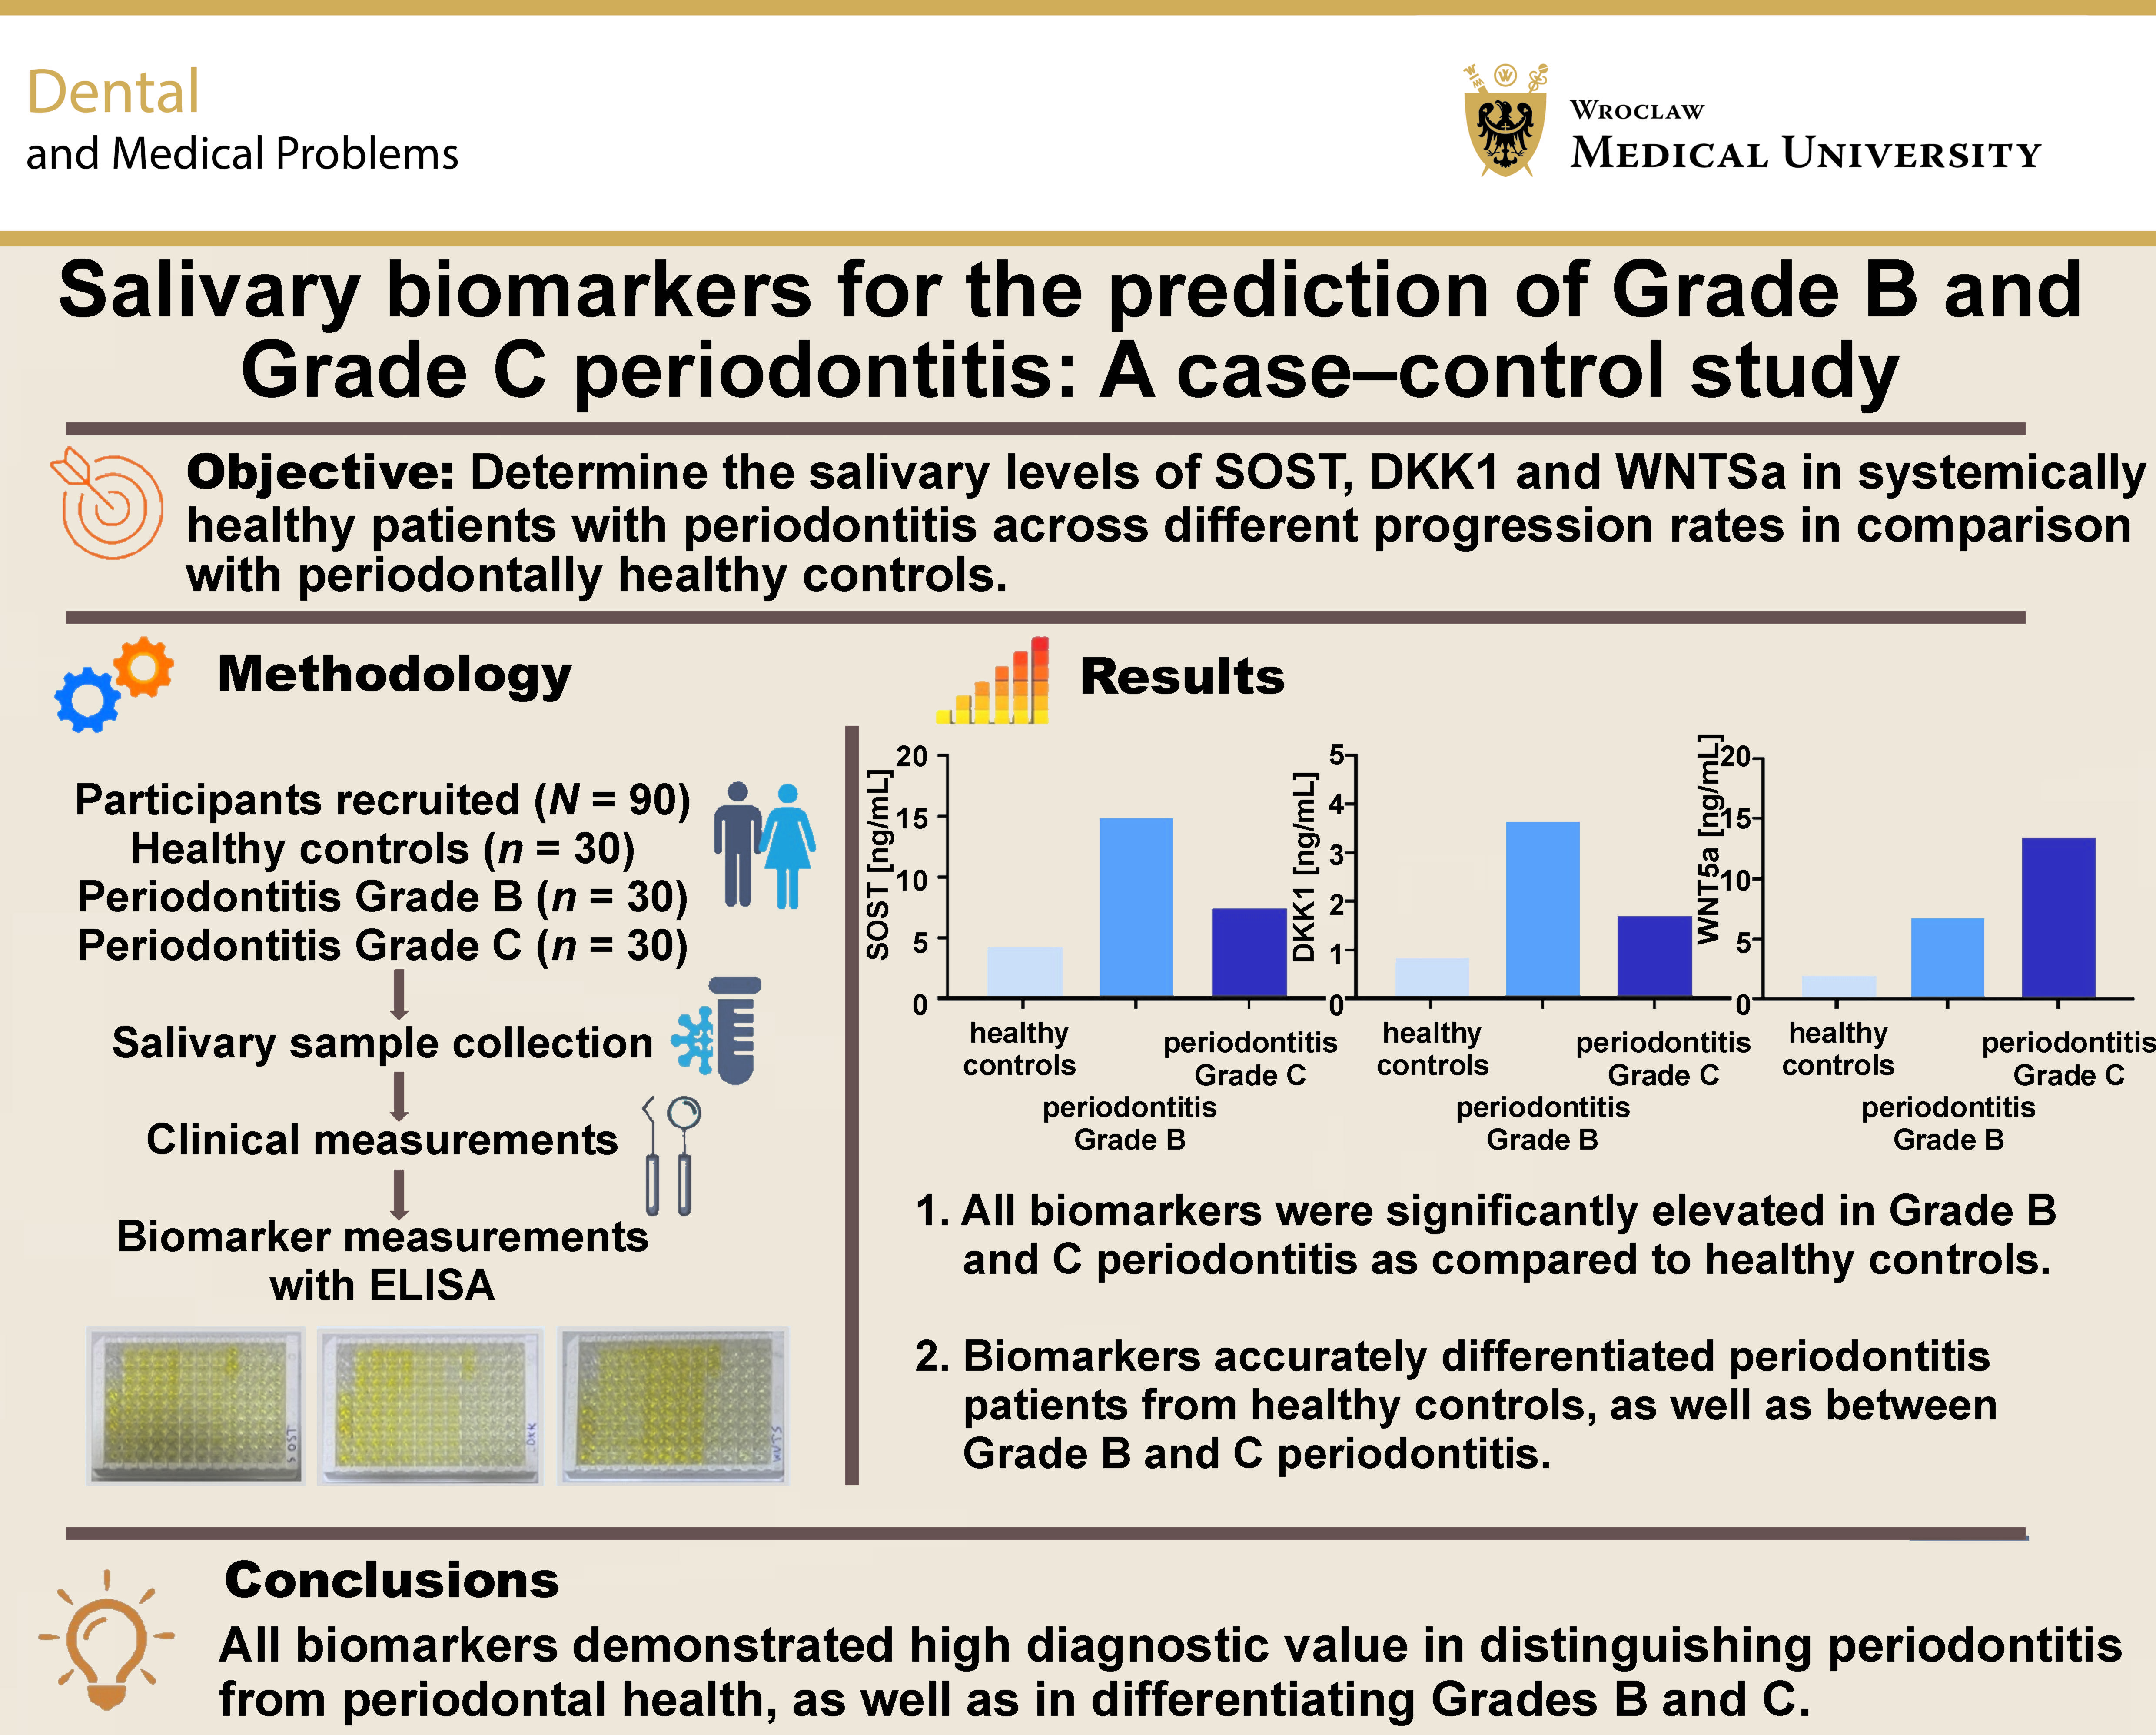
Results. The salivary levels of SOST and DKK1 were significantly higher in Grade B periodontitis patients (14.85 ±3.28 ng/mL and 3.65 ±1.11 ng/mL, respectively) and Grade C periodontitis patients (7.45 ±3.84 ng/mL and 1.68 ±0.46 ng/mL, respectively) than in healthy controls (4.37 ±0.97 ng/mL and 0.88 ±0.15 ng/mL, respectively). Notably, their levels were significantly higher in periodontitis Grade B than in Grade C (p < 0.0001). The WNT5a salivary levels were also considerably higher in Grade B periodontitis patients (6.58 ±3.28 ng/mL) and Grade C periodontitis patients (13.41 ±1.73 ng/mL) than in healthy controls (2.03 ±0.31 ng/ml). Unlike SOST and DKK1, WNT5a showed significantly higher levels in periodontitis Grade C as compared to Grade B (p < 0.0001). Additionally, the receiver operating characteristic (ROC) analysis demonstrated that SOST, DKK1 and WNT5a showed significant diagnostic accuracy in distinguishing periodontitis from periodontal health with the area under the curve (AUC) values of 0.96, 0.97 and 0.99, respectively, and also in distinguishing periodontitis Grade B from periodontitis Grade C with AUC of 0.94, 0.97 and 0.92, respectively.
Conclusions. The salivary levels of SOST, DKK1 and WNT5a demonstrated high diagnostic value in distinguishing generalized periodontitis from periodontal health. The WNT5a levels increased with disease progression, effectively differentiating Grades B and C. Similarly, SOST and DKK1 also distinguished these grades, with higher levels in Grade B than in Grade C.
Keywords: DKK1, periodontitis, grading, SOST, WNT5a
Introduction
Periodontitis ranks among the most prevalent chronic diseases globally and significantly affects oral health.1 It is a biofilm-mediated inflammatory condition characterized by intricate interactions between immune-inflammatory pathways and alterations in the symbiotic ecosystem, ultimately resulting in inflammation-induced bone loss.2 The regulation of bone metabolism is a complex process influenced by various signaling pathways, driven by numerous local and systemic variables, such as chemokines, cytokines, hormones, as well as biochemical stimuli.3
The Wingless-related integration site (WNT) pathway is a signal transduction cascade and one of the most evolutionarily conserved cell signaling systems, playing a central role in numerous fundamental biological processes, including cell proliferation, polarity and fate determination, functioning in both embryonic development and the maintenance and regeneration of mature cells.4, 5, 6 The dysregulation of WNT signaling has been reported to be a significant contributor to various diseases, including bone and metabolic abnormalities.7, 8 The activation of the WNT pathway is initiated by interactions between WNT ligands and their receptors at the cell membrane, which trigger the expression of WNT target genes.9 A minimum of 19 WNT protein ligands bind with Frizzled (Fz) receptors, initiating signaling cascades that can be broadly classified into 2 main branches – β-catenin-dependent (canonical) and β-catenin-independent (non-canonical) WNT signaling pathways.10
Sclerostin (SOST) and Dickkopf-related protein 1 (DKK1) act as antagonists for the β-catenin-dependent pathway by binding to low-density lipoprotein receptor-related proteins 5 and 6 (LRP5/6) on osteoblast surfaces. This interaction effectively blocks the WNT signaling pathway, ultimately leading to the inhibition of osteoblast proliferation and differentiation.11, 12 In mice with induced periodontitis, the deletion of the SOST gene led to reduced alveolar bone resorption, decreased expression of receptor activator for nuclear factor-kappa B ligand (RANKL) and increased expression of osteoprotegerin (OPG).13 Similarly, the constitutive deletion of DKK1 in osteocytes within a ligature-induced periodontitis model completely prevented alveolar bone loss.14 Moreover, studies conducted in vivo have demonstrated that patients with periodontitis exhibit elevated levels of SOST and DKK1 in both gingival tissues and gingival crevicular fluid (GCF).15, 16, 17, 18, 19
WNT family member 5a (WNT5a), a component of the β-catenin-independent pathway, plays an important role in both the development of periodontal tissues and the pathogenesis of periodontitis.20 WNT5a has the capacity to either activate or inhibit the β-catenin-dependent pathway.21 WNT5a activates proinflammatory signaling pathways and amplifies the secretion of proinflammatory cytokines, contributing to the exacerbation of periodontal tissue destruction.22, 23 Additionally, it has been demonstrated that WNT5a facilitates RANKL-induced osteoclastogenesis, ultimately leading to enhanced osteoclast differentiation and increased bone resorption, thereby inhibiting bone formation.24
Established during the 2017 World Workshop on the Classification of Periodontal and Peri-Implant Diseases and Conditions, the new periodontitis classification utilizes a multi-dimensional approach for staging and grading.25 Grading offers additional insights into the biological characteristics of the disease, incorporating a longitudinal assessment of periodontitis progression rates and an evaluation of the risk for future disease advancement.26 The limitations of conventional diagnostic methods have prompted the exploration of biomarker integration into the new classification system. This approach is expected to facilitate the identification of patients during active phases of periodontitis and to improve the accuracy of monitoring disease progression and treatment response.26
Saliva collection is straightforward, rapid and non-invasive, and it requires less manpower and fewer materials as compared to other diagnostic bodily fluids. Additionally, whole saliva provides a pooled sample from all periodontal sites, enabling a comprehensive assessment of an individual’s disease status or risk rather than focusing on specific sites or teeth.27 Given these advantages, saliva-based diagnostics holds considerable promise for the detection of periodontal diseases and the prediction of treatment outcomes, potentially advancing future diagnostic approaches in periodontology.28
Despite prior evidence highlighting the roles of SOST, DKK1 and WNT5a in periodontal tissue deterioration, there is a notable lack of studies investigating the salivary levels of WNT5a and DKK1 in patients with periodontitis, as well as a scarcity of research measuring the SOST levels in saliva. Therefore, this study aimed to evaluate the salivary concentrations of SOST, DKK1 and WNT5a with the objective of determining their efficacy in differentiating between Grades B and C periodontitis.
Material and methods
Study design and settings
This case–control study involved the analysis of patients who visited the dental clinics at the Department of Periodontics, College of Dentistry, University of Baghdad, Iraq, between January and May 2024. Ninety systemically healthy participants were included. All participants who met the established eligibility criteria were verbally informed about the study and asked to sign an informed consent form. Salivary samples were collected from all participants. Then, the patients received a full-mouth periodontal examination to determine their periodontal status. The study was approved by the ethics committee of the College of Dentistry, University of Baghdad, in accordance with the Declaration of Helsinki and its subsequent amendments concerning human research (reference No. 855, project No. 855623, December 12, 2023). The research was evaluated and validated in accordance with the Strengthening the Reporting of Observational Studies in Epidemiology (STROBE) guidelines.
Eligibility
During the preliminary screening phase, each participant underwent an assessment to determine their eligibility for inclusion in the study based on the following criteria: adults aged >18 years; systemically healthy; with ≥20 permanent teeth (excluding third molars); and without any systemic medical condition that could affect the periodontal status, particularly any disorders associated with bone health (rheumatoid arthritis, bleeding disorders, diabetes mellitus, recent bone fractures, ankylosing spondylitis, osteoporosis, and immunosuppressive therapy). The exclusion criteria were as follows: antibiotic use within the past 3 months; extensive periodontal therapy within the past 3 months or currently undergoing active periodontal treatment; the presence of dental implants; the presence of orthodontic appliances; pregnant or lactating women; post-menopausal women; patients with any oral lesions unrelated to periodontitis, including but not limited to aphthous ulcers, lichen planus, and others. Moreover, individuals presenting a waist-to-height ratio (WHtR) ≥0.5,29 as well as those with a body mass index (BMI) ≥30 kg/m2, were excluded from the study.
Study groups
Based on the periodontal status, the eligible individuals were categorized into healthy controls and periodontitis patients. The periodontitis group was further subdivided into Grade B and Grade C. The categorization was carried out based on the latest classification of periodontal diseases and conditions, while also integrating the guidelines from the British Society of Periodontology (BSP) regarding the practical implementation of this classification system in clinical settings.26, 30 Participants with no clinical attachment loss (CAL), bleeding on probing (BoP) <10% and probing pocket depth (PPD) ≤3 mm were grouped as healthy controls. For the periodontitis groups, participants were identified based on the presence of interdental CAL at two or more non-adjacent teeth, or buccal/oral CAL in conjunction with PPD > 3 mm at two or more teeth. All periodontitis cases were classified as generalized (involving ≥30% of teeth) and unstable, defined by PPD ≥ 5 mm or PPD ≥ 4 mm with BoP. Patients were further categorized as Grade B or Grade C according to the ratio of radiographic bone loss at the most affected site to the patient’s age. A ratio of 0.5–1.0 was classified as Grade B, indicating moderate disease progression, whereas a ratio >1.0 was classified as Grade C, indicating rapid progression. Our study adopted the revised approach, which uses a 0.5–1.0 ratio to determine grades while excluding risk factors such as diabetes and smoking. This method aligns with recent literature advocating a simplified classification based solely on clinical measurements for grade assessment.30 Regarding the smoking status, individuals who smoked ≥10 cigarettes per day for the past 5 years were classified as smokers, whereas those who had never smoked or had ceased smoking at least 2 years prior to the study were classified as non-smokers.31
Clinical examination
A single calibrated examiner performed all clinical assessments. The following periodontal parameters were evaluated: plaque index (PI)32; BoP33; PPD; and CAL at 6 sites per tooth (except PI, which was recorded at 4 sites per tooth), excluding third molars, using UNC-15 periodontal probes (Hu-Friedy, Chicago, USA). The plaque index and BoP were recorded dichotomously (present/absent) at 4 or 6 sites per tooth, respectively. The percentage of sites with plaque or bleeding was then calculated for each patient, and these percentages are presented as mean ± standard deviation (M ±SD). Radiographic imaging was performed to confirm the diagnosis, focusing on the most affected tooth, defined as the tooth exhibiting the greatest interdental CAL. In addition, BMI was calculated as weight in kilograms divided by height in meters squared (kg/m2), and WHtR was calculated as waist circumference in centimeters divided by height in centimeters.
Calibration was performed with an expert periodontist for diagnosis and the recording of clinical parameters prior to study commencement. A minimum interval of 2 h was maintained between consecutive measurements. These calibration sessions were repeated at different time points until an acceptable level of agreement was achieved. This included κ values >0.75 for PI and BoP, and intraclass correlation coefficients (ICCs) >0.90 for PPD and CAL.
Sample size
Using the first 15 samples from each group, a pilot study was conducted, and the salivary levels of the selected biomarkers were determined using the enzyme-linked immunosorbent assay (ELISA). Subsequently, the sample size was calculated according to the formula provided by Sharma et al. for case–control studies (Equation 1)34:
where:
n – sample size per group;
r – allocation ratio (n2/n1);
SD – standard deviation;
Zα/2 – critical value for the significance level;
Zβ – critical value for power; and
d – minimal clinically significant difference to detect.
Accordingly, a sample size of 30 was estimated for each group (30 for the healthy control group, 30 for the Grade B periodontitis group, and 30 for the Grade C periodontitis group), yielding a 2:1 ratio of cases to controls.
Salivary sample collection and analysis
Saliva samples were collected from the participants between 9:00 a.m. and 1:00 p.m., prior to any oral examination. Whole unstimulated saliva was obtained using the passive drooling method. The participants were instructed to abstain from eating, drinking, smoking, and oral hygiene practices for at least 1 h before collection. Approximately 10 min before sampling, they rinsed their mouths with water for 30 s, and then expectorated into sterile tubes while seated upright. A total of 3 mL of unstimulated saliva was collected and transferred into polypropylene tubes. The samples were centrifuged at 3,000 rpm for 5 min and subsequently stored at −20°C until analysis by ELISA.
The samples were allowed to thaw at room temperature. The protein levels in saliva were then quantified using commercially available ELISA kits (Cloud-Clone Corp., Katy, USA), according to the manufacturer’s instructions. A standard curve was generated by plotting the optical density (OD) values for SOST, DKK1 and WNT5a, and regression equations were applied to convert these values into concentrations expressed in nanograms per milliliter (ng/mL).
Statistical analysis
Data analysis was performed using IBM SPSS Statistics for Windows, v. 27.0 (IBM Corp., Armonk, USA), while graphical representations were generated using GraphPad Prism 10 (GraphPad Software, San Diego, USA). The normality of data distribution was assessed using the Shapiro–Wilk test. For non-normally distributed data, non-parametric statistical methods were applied.
Differences in age, WHtR, BMI, cigarettes per day, PI, and BoP were analyzed using the one-way analysis of variance (ANOVA) followed by the Games–Howell post hoc tests, as these variables were normally distributed. In contrast, the Kruskal–Wallis test followed by Bonferroni-adjusted post hoc comparisons was used for the salivary biomarker levels, PPD, CAL, and the number of sites with PPD ≥ 4 mm, as well as the number of teeth with PPD ≥ 4 mm, due to their non-normal distribution. The χ2 test was used to assess associations between categorical variables, including gender, the smoking status and the educational level, across the 3 study groups. Moreover, for comparisons between smokers and non-smokers within each group, the Mann–Whitney U test was used.
Spearman’s correlation coefficient was applied to evaluate relationships between the salivary biomarker levels and other relevant variables. The receiver operating characteristic (ROC) analysis was performed to assess the diagnostic performance of SOST, DKK1 and WNT5a in distinguishing healthy and periodontitis groups, with the area under the curve (AUC) values used to determine sensitivity and specificity. Multiple linear regression analysis was conducted to examine the influence of various factors on the salivary biomarker levels across all groups. The level of statistical significance was set at 5% (p < 0.05).
Results
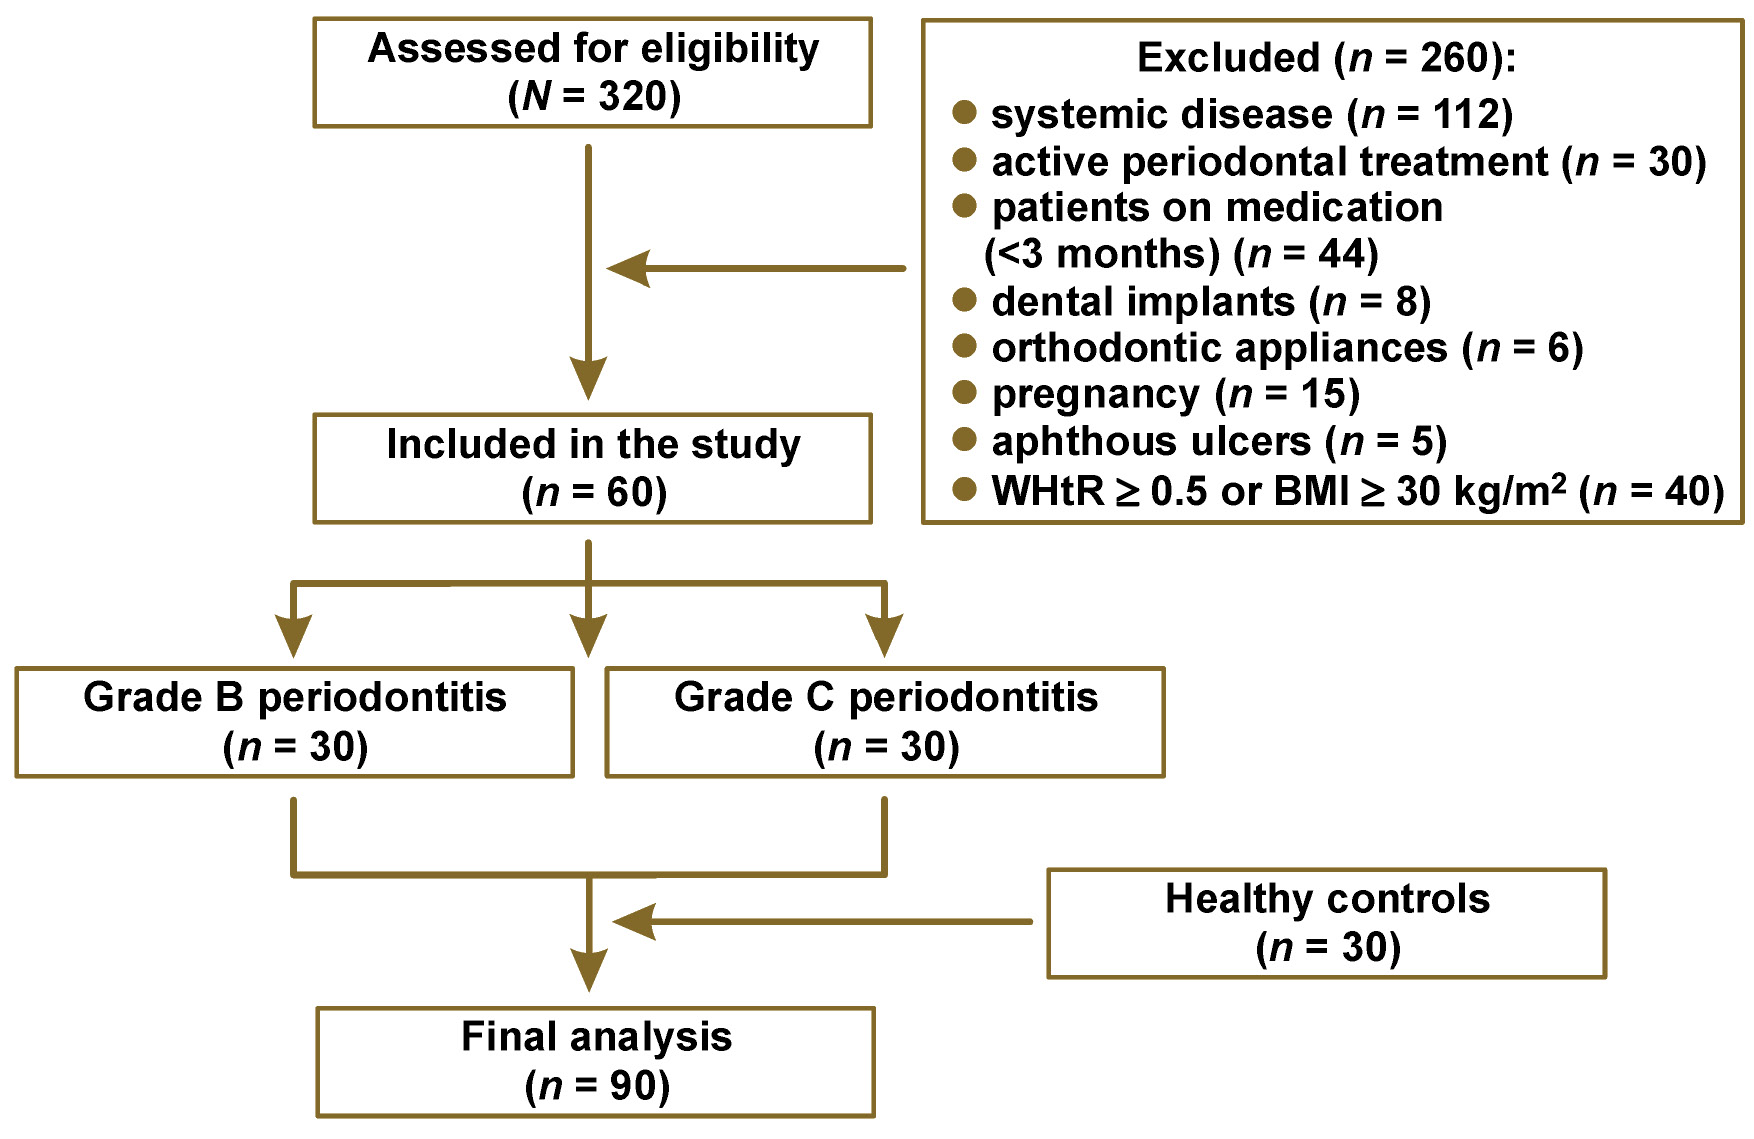
In the current study, 320 subjects were screened for eligibility. A total of 90 participants were recruited, after excluding individuals for several reasons, as detailed in Figure 1. Subsequently, the participants were divided into 3 groups (30 healthy controls, 30 Grade B periodontitis patients, and 30 Grade C periodontitis patients).
Demographic variables
The demographic characteristics of the study groups are shown in Table 1. There were no differences in the mean age, gender, WHtR, and BMI among the study groups (p > 0.05). However, statistically significant differences among groups were observed in the mean number of teeth and the educational level of the study participants (p < 0.001). Additionally, no significant differences were observed in the distribution of smokers across the groups (p > 0.05).
Clinical periodontal parameters
Concerning the assessed clinical periodontal parameters (PI, BoP, PPD, CAL, and the number of sites with PPD ≥ 4 mm), all of them were significantly higher in both Grade B and Grade C periodontitis groups as compared to the control group (p < 0.0001). Additionally, the Grade C group exhibited significantly higher PI and CAL when compared to Grade B, as illustrated in Table 2.
Salivary levels of SOST, DKK1 and WNT5a
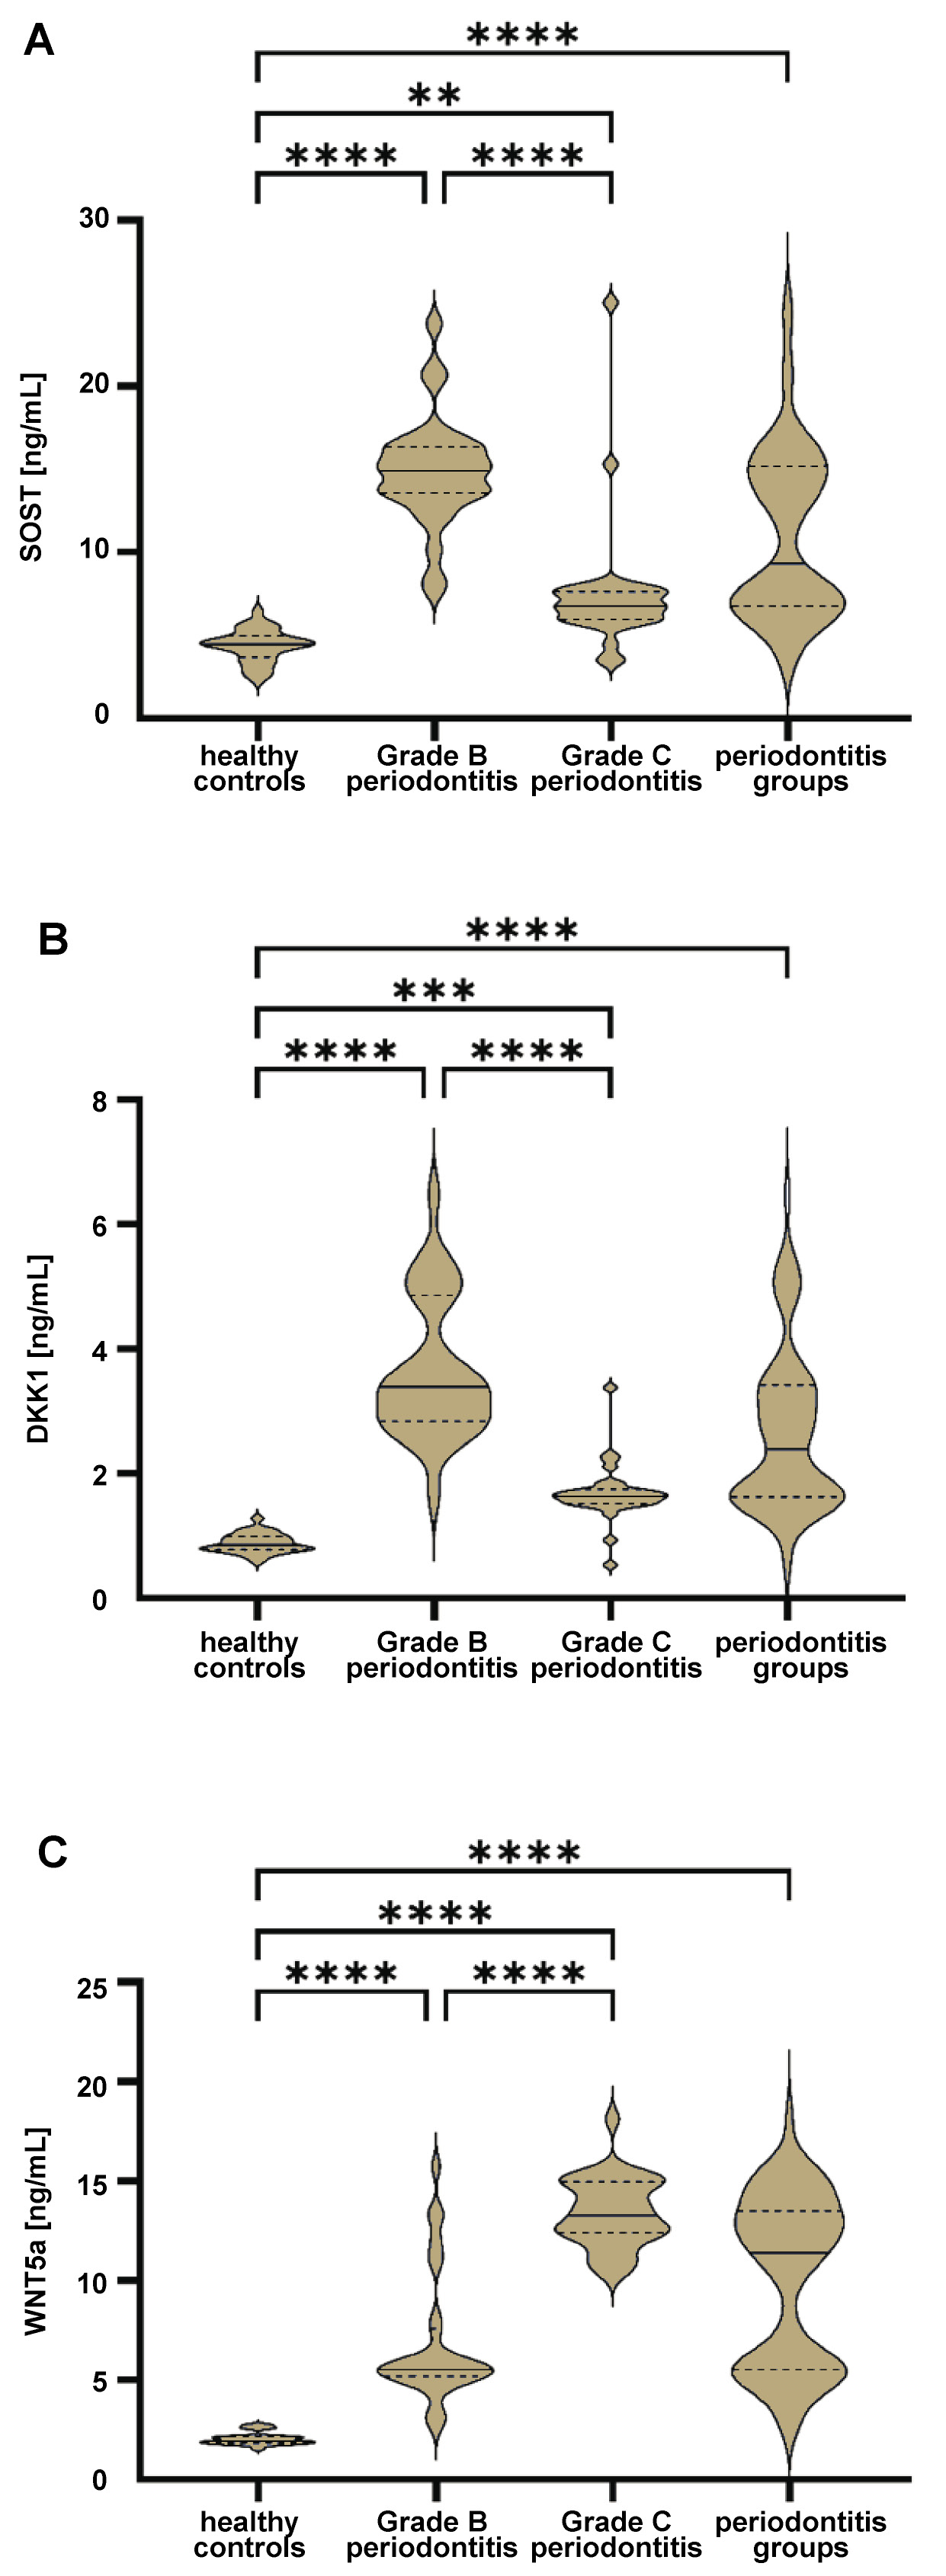
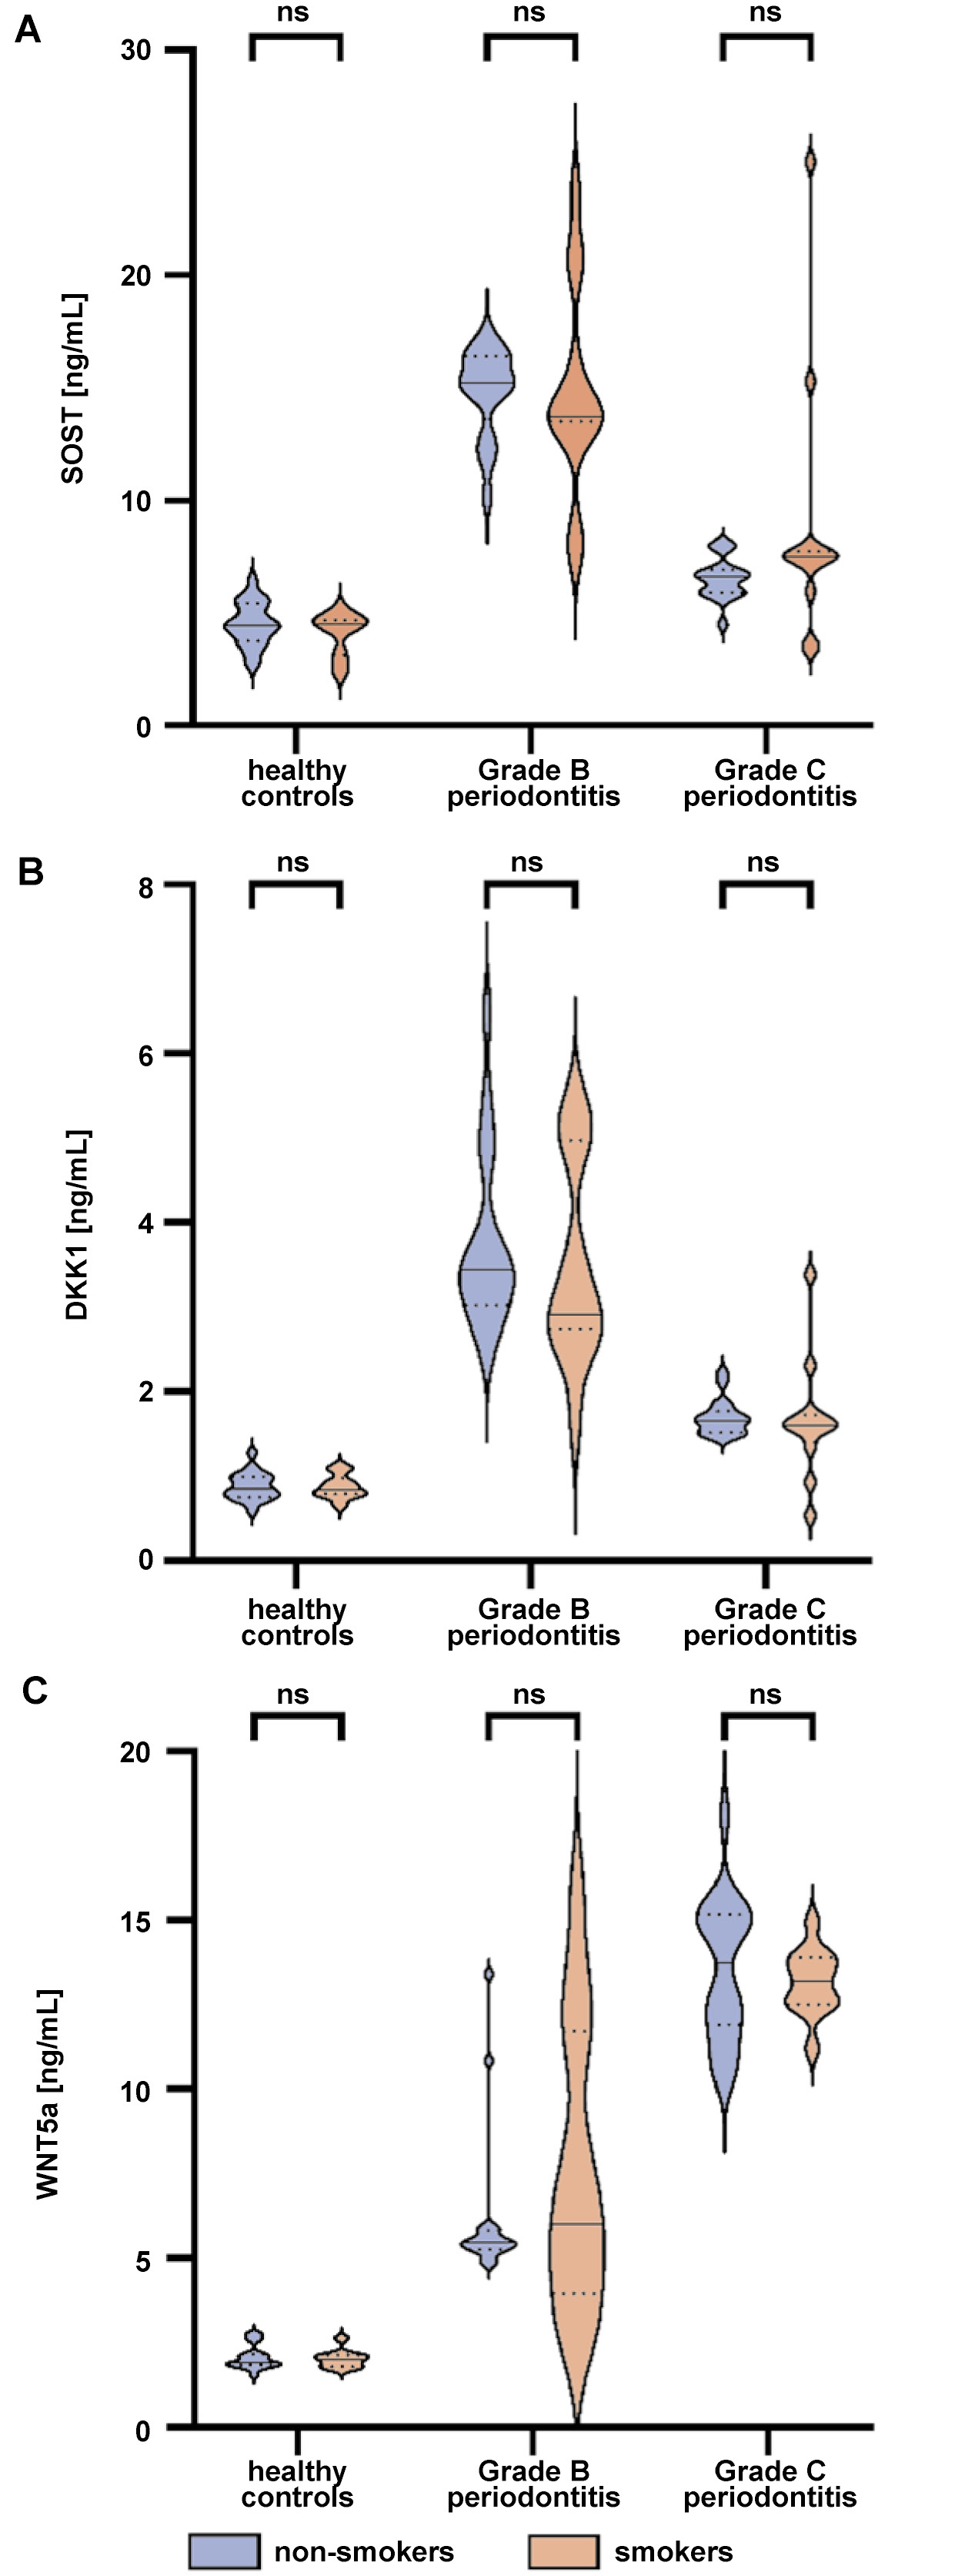
The salivary levels of all biomarkers across the groups are presented in Table 3. The concentrations of SOST, DKK1 and WNT5a were significantly higher in both periodontitis groups as compared to the healthy control group. Intergroup comparisons revealed significantly higher salivary levels of both SOST and DKK1 in the Grade B periodontitis group when compared to Grade C (p < 0.0001), whereas the salivary levels of WNT5a were significantly higher in Grade C than in Grade B (p < 0.0001), as illustrated in Figure 2. Further analysis revealed that the salivary biomarker levels exhibited no significant differences between smokers and non-smokers across all groups (p > 0.05), as shown in Table 4 and Figure 3.
Correlation between the salivary biomarker levels and other variables
Table 5 presents the coefficients of correlation between the salivary biomarkers (SOST, DKK1 and WNT5a) and clinical and demographic variables, as well as their interrelationships. All 3 biomarkers showed statistically significant correlations with PI, BoP, PPD, CAL, and the number of sites with PPD ≥ 4 mm.
SOST was positively correlated with age and WHtR (p < 0.05), while DKK1 showed positive correlations with both WHtR and BMI (p < 0.05). In contrast, the number of teeth was negatively correlated with all salivary biomarkers (p < 0.0001).
Furthermore, the 3 tested biomarkers demonstrated significant positive correlations between each other (p < 0.001).
ROC analysis for diagnostic accuracy
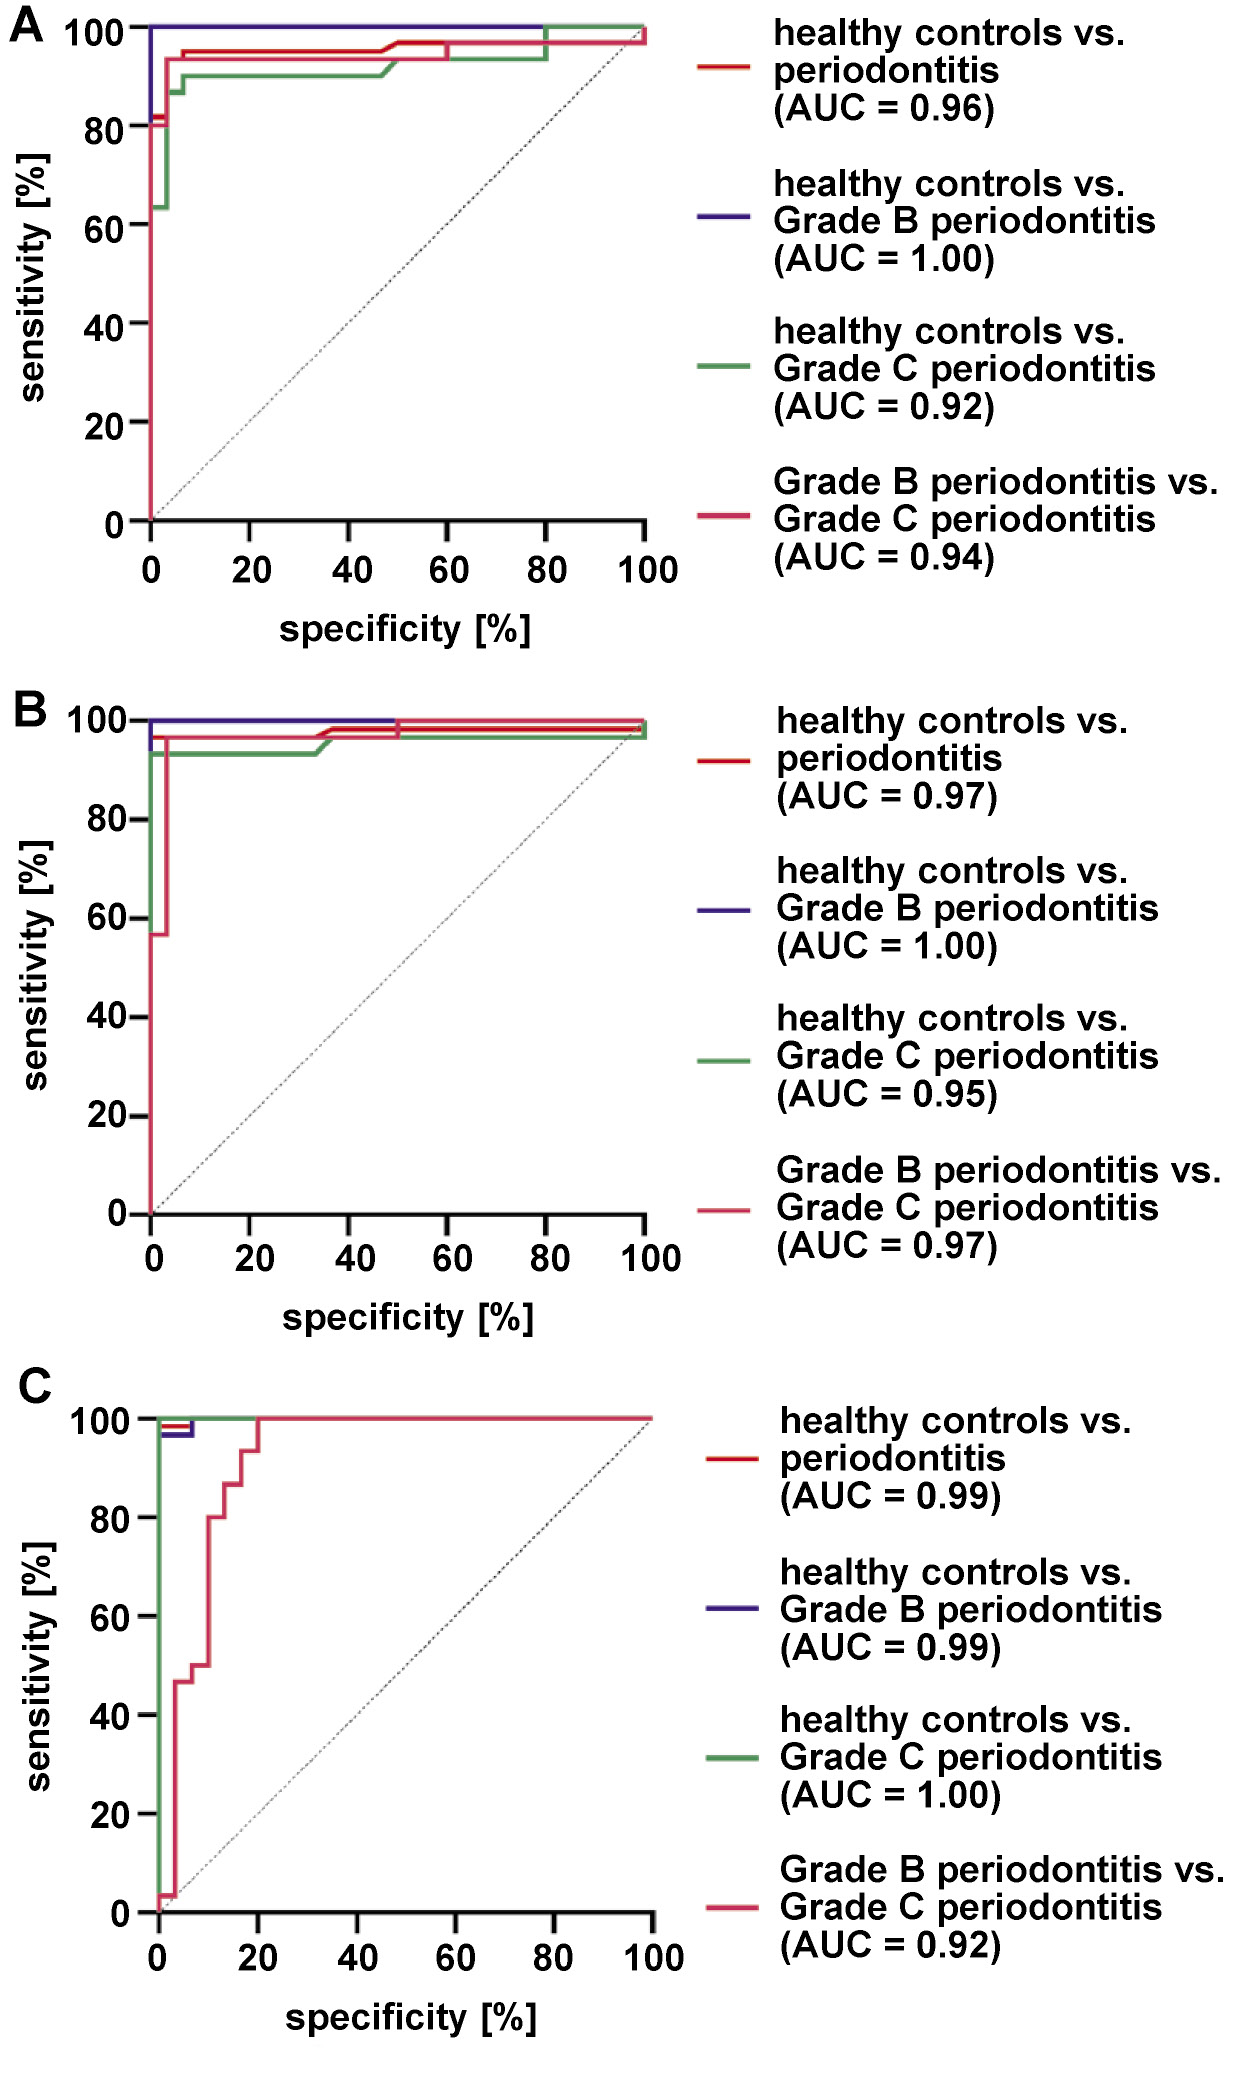
The diagnostic potential of salivary biomarkers to distinguish periodontal health from periodontitis and its grades was evaluated using the ROC analysis, as presented in Table 6 and Figure 4. All biomarkers (SOST, DKK1 and WNT5a) demonstrated excellent discriminatory ability between periodontal health and periodontitis, with the AUC values of 0.96, 0.97 and 0.99, respectively.
DKK1 demonstrated the highest sensitivity and specificity (100% each) for distinguishing the healthy group from Grade B periodontitis, with a cut-off value of 1.470. This was followed by WNT5a (96.69% sensitivity and 100.00% specificity; cut-off: 2.975) and SOST (100.00% sensitivity and 96.69% specificity; cut-off: 6.100).
For distinguishing healthy controls from Grade C periodontitis, WNT5a demonstrated the highest sensitivity and specificity (100% each). This was followed by DKK1 (93.33% sensitivity and 100.00% specificity) and SOST (90.00% sensitivity and 93.33% specificity).
Further analysis showed that all biomarkers (SOST, DKK1 and WNT5a) demonstrated excellent ability to discriminate between periodontitis grade B and grade C, with the AUC values of 0.94, 0.97 and 0.92, respectively.
Multiple linear regression
Multiple linear regression analysis revealed that SOST was significantly negatively associated with CAL (B = −2.29; p < 0.001) and the number of teeth (B = −0.385; p = 0.048). Similarly, DKK1 showed significant negative associations with PI (B = −0.021; p = 0.005), CAL (B = −0.495; p < 0.001), and the number of teeth (B = −0.107; p = 0.024). Both SOST and DKK1 were positively associated with periodontitis (B = 14.433; p < 0.001 and B = 3.573; p < 0.001, respectively). Furthermore, WNT5a demonstrated significant positive associations with PI, CAL, the number of teeth, and periodontitis, as presented in Table 7.
Discussion
The current study demonstrated that the salivary levels of the selected biomarkers involved in the WNT signaling pathway (SOST, DKK1 and WNT5a) were significantly elevated in systemically healthy individuals with periodontitis as compared to those with a healthy periodontium. These biomarkers not only indicated the presence of periodontitis, but also exhibited high sensitivity in distinguishing between different rates of disease progression (periodontitis Grade B and Grade C). This highlights their potential utility in the non-invasive diagnosis and grading of periodontitis, thereby contributing to more precise and targeted treatment strategies.
The inherent limitations of traditional diagnostic methods have prompted investigation into the integration of biomarkers into the new periodontitis classification system, particularly for disease grading, thereby enhancing the data obtained from standard clinical measures.26 The selection of saliva as a diagnostic medium in this study is based on its unique properties and considerable potential for disease detection and monitoring.35 As an easily obtainable biofluid that can be collected without specialized clinical facilities or advanced technical expertise, it represents a valuable medium for both research and diagnostic applications. Numerous salivary biomarkers have demonstrated a remarkable ability to differentiate periodontitis from periodontal health.36, 37, 38, 39, 40 However, to date, no single biomarker has been identified that can reliably diagnose periodontal disease.41 Therefore, the present study aimed to identify promising salivary biomarkers that could serve as a basis for monitoring periodontal disease progression and provide a foundation for future research.
Over recent decades, the WNT signaling pathway has attracted considerable scientific interest due to its pivotal role in regulating various cellular processes, including bone metabolism.42 Evidence indicates that the WNT signaling pathway – particularly the WNT/β-catenin pathway – is involved not only in regulating osteoblast differentiation and bone formation, but also in controlling genes essential for osteoclast maturation and bone resorption. Among the key regulators (agonists and antagonists) of the WNT pathway associated with periodontitis are SOST, DKK1 and WNT5a.43
It is well established that periodontitis is associated with elevated levels of local and systemic proinflammatory cytokines.44, 45 In this context, the expression of SOST and DKK1 has been reported to be upregulated by tumor necrosis factor-alpha (TNF-α), interleukin-1 beta (IL-1β) and transforming growth factor-beta 1 (TGF-β1) in several diseases, including periodontitis,46, 47, 48, 49 suggesting their potential role in its pathogenesis. Baek et al. demonstrated that TNF-α stimulates the production of SOST in MLO-Y4 osteocytes.50 It was shown that nuclear factor kappa-light-chain enhancer of activated B cells (NF-κB) directly binds to the NF-κB binding sites on the mouse SOST promoter, thereby enhancing SOST production through NF-κB activation.50 Additionally, a study using an experimental periodontitis model in osteocyte-specific DKK1-deletion mice demonstrated increased volume and density of the alveolar process.14 Notably, substantial variations were observed in the infiltration of inflammatory cells and proinflammatory cytokines within periodontal tissues, indicating that the ablation of DKK1 in osteocytes reduced the inflammatory response.14 Moreover, SOST and DKK1, primarily expressed by osteocytes, have been shown to increase RANKL expression while simultaneously decreasing the OPG levels.51, 52 Since the RANKL/OPG ratio is critical in the pathogenesis of periodontitis,53 it is worth noting that SOST and DKK1 may promote osteoclast formation in a RANKL-dependent manner, which further underscores their role in disease progression.
In the present study, the salivary levels of SOST and DKK1 were significantly increased in the periodontitis groups (Grade B and C) as compared to the healthy group. Additionally, both biomarkers showed significant positive correlations with PI, BoP and CAL (p < 0.001), as well as with PPD and the number of sites with PPD ≥ 4 mm (p < 0.0001). To the best of our knowledge, no previous studies have evaluated the salivary levels of SOST or DKK1 in periodontitis patients with different rates of disease progression in comparison with individuals with a healthy periodontium. However, SOST has been detected in saliva. A previous study assessed the salivary SOST levels before and after non-surgical periodontal treatment.54 Although no significant changes were observed post-treatment, the baseline SOST levels were reported to be 1.6-fold lower in the chronic periodontitis group.54
Our findings are in agreement with a previous study reporting increased mRNA expression levels of SOST and DKK1 in the periodontal tissues of systemically healthy individuals with chronic periodontitis as compared to periodontally healthy participants.18 Furthermore, the same study observed elevated serum SOST levels in the periodontitis group, whereas the DKK1 levels did not differ significantly between the periodontitis and non-periodontitis groups.18 Despite differences in study design and analytical methods, these findings may suggest that saliva more accurately reflects changes in the DKK1 levels than serum in systemically healthy individuals with periodontitis. This may be explained by the fact that saliva contains the components of GCF, in which DKK1 has been detected in periodontitis patients.19, 55 However, further studies are required to elucidate the exact mechanisms underlying the elevation of DKK1 in saliva. Numerous studies have assessed the SOST levels in GCF. A study conducted by Balli et al. demonstrated that the SOST levels were markedly elevated in patients with chronic periodontitis as compared to healthy individuals.17 Additionally, the SOST levels showed a marked decrease following non-surgical periodontal treatment.17 Likewise, Chatzopoulos et al. reported that the SOST levels were significantly higher in both the generalized moderate and severe chronic periodontitis groups as compared to the healthy group.16 Moreover, a recent study showed that the GCF levels of SOST were elevated in patients with periodontitis Stage III Grade B and Stage III Grade C as compared to gingivally healthy individuals.56 However, no significant differences were observed between the 2 grades. This lack of distinction was attributed to similarity in the bone resorption mechanisms involving the WNT pathway, as well as to the fact that GCF samples were collected from the sites with the highest CAL in both groups.56
Unexpectedly, we observed significantly higher salivary SOST and DKK1 levels in Grade B periodontitis than in Grade C (p < 0.0001). This discrepancy may be attributed to differences in disease severity between the study groups. This is supported by the multiple linear regression models for SOST and DKK1, which indicated that higher CAL was associated with lower levels of both biomarkers when controlling for other variables (Table 7). These contrasting findings may be explained by the regulatory mechanisms operating at more advanced stages of periodontitis, potentially leading to reduced expression of these biomarkers, or by individual variability in biological responses to periodontal destruction.57, 58 In light of these considerations, further research is warranted to elucidate the specific mechanisms underlying the dynamics of these biomarkers.
WNT5a has been shown to modulate the production of inflammatory cytokines and exacerbate the deterioration of the periodontium. The inhibition of WNT5a using small interfering RNA (siRNA) or a neutralizing antibody markedly reduced the expression of IL-1β, monocyte chemotactic protein-1 (MCP-1) and matrix metalloproteinase-2 (MMP-2) in macrophages infected with Porphyromonas gingivalis (Pg).23 Another study demonstrated that WNT5a expression in human gingival epithelial cells (HGECs) was significantly increased following 12 h of stimulation with Pg-derived lipopolysaccharide (LPS) at concentrations of 0.1 and 1.0 µg/mL,22 suggesting a proinflammatory role for WNT5a in gingival tissues during periodontitis. Additionally, WNT5a expressed by osteoblasts binds to a co-receptor complex involving receptor tyrosine kinase-like orphan receptor 2 (Ror2) and a Frizzled receptor (Ror2/Fz complex) on osteoclast precursors. This activates non-canonical WNT signaling, leading to the upregulation of RANKL expression. Consequently, the sensitivity of osteoclast precursors to RANKL increases, thereby promoting osteoclast differentiation.24
One study evaluated the WNT5a levels in serum, and found no significant differences between periodontitis and non-periodontitis patients.59 Chatzopoulos et al. reported that in GCF, the WNT5a levels were comparable among healthy and generalized moderate and severe chronic periodontitis groups.16 However, they also observed that the total WNT5a protein levels were substantially higher at diseased sites than at healthy sites among periodontitis patients.16
In the present study, the salivary WNT5a levels were significantly elevated in the periodontitis groups as compared to the healthy group (p < 0.0001). Notably, the WNT5a levels were significantly higher in Grade C periodontitis than in Grade B (p < 0.0001). This finding may be explained by the greater number of sites with PPD ≥ 4 mm in the Grade C group as compared to the Grade B group. Although this difference was not statistically significant, it may still be considered clinically relevant. Moreover, WNT5a showed significant positive correlations with PI, BOP and CAL (p < 0.001), as well as with PPD and the number of sites with PPD ≥ 4 mm (p < 0.0001), suggesting that the WNT5a levels increase with disease progression. Although no previous studies have evaluated WNT5a in saliva, these findings are consistent with those of Chatzopoulos et al., who associated increased GCF WNT5a levels with more severe periodontal destruction.16
In the present investigation, smoking had no significant effect on the salivary levels of SOST, DKK1 and WNT5a across all study groups (p > 0.05). This finding may be attributed to the relatively small number of smokers included in the sample. At present, there is limited evidence regarding the impact of smoking on the salivary levels of these biomarkers. However, one study reported that the SOST and DKK1 levels were markedly elevated in the periodontal tissues of smokers, regardless of the diabetes mellitus status.60 In contrast, another study found no significant differences in the GCF levels of SOST and WNT5a between smokers and non-smokers.61 Despite these inconsistent findings, the results of the present study suggest that, irrespective of the smoking status, the evaluated salivary biomarkers demonstrate significant potential to differentiate periodontitis from periodontal health across different rates of disease progression.
The primary strength of this study lies in providing novel insights into the salivary levels of SOST, DKK1 and WNT5a in patients with generalized periodontitis. Moreover, the study groups were matched for age, gender, WHtR, and BMI. Notably, differences in the expression of WNT genes in human marrow stromal cells between young and aged individuals have been reported in the literature.62 In addition, genetic variations in the WNT/β-catenin pathway have been associated with metabolic conditions, including obesity.63 By controlling for these variables, we minimized their potential confounding effects on the WNT levels, as supported by the multiple linear regression models (Table 7).
However, this study has several limitations. Due to its cross-sectional design, the long-term effects of altered SOST, DKK1 and WNT5a levels on periodontal tissues cannot be determined. Further biochemical studies are needed to clarify the precise role of these biomarkers in periodontitis. Additionally, including patients with Grade A periodontitis as a comparative group could provide further insight into the biomarker levels at lower rates of disease progression. Finally, the generalizability of these findings may be limited to the specific study conditions. Therefore, further research across diverse populations and settings, including the incorporation of systemic risk factors such as diabetes, is necessary to validate and extend these findings.
Conclusions
Our results indicate that the salivary levels of SOST, DKK1 and WNT5a have significant diagnostic potential for distinguishing periodontal health from periodontitis. WNT5a demonstrated a strong ability to differentiate between Grades B and C, showing a progressive increase with disease severity. In contrast, SOST and DKK1 also exhibited significant diagnostic value, but followed a different pattern, with levels increasing at moderate progression rates (Grade B) and decreasing at higher progression rates (Grade C). These findings highlight the potential utility of these biomarkers in the diagnosis and monitoring of periodontitis.
Ethics approval and consent to participate
The study was approved by the ethics committee of the College of Dentistry, University of Baghdad, Iraq, in accordance with the Declaration of Helsinki and its subsequent amendments concerning human research (reference No. 855, project No. 855623, December 12, 2023). Written informed consent was obtained from all the participants.
Data availability
The datasets supporting the findings of the current study are available from the corresponding author on reasonable request.
Consent for publication
Not applicable.
Use of AI and AI-assisted technologies
Not applicable.