Abstract
Background. Periodontitis is regarded as the 6th microvascular complication of type 2 diabetes mellitus (T2DM). In individuals with both periodontitis and T2DM, the condition may adversely influence the regenerative potential of the platelet-rich fibrin (PRF) and hyperacute serum (HAS) derived from these patients.
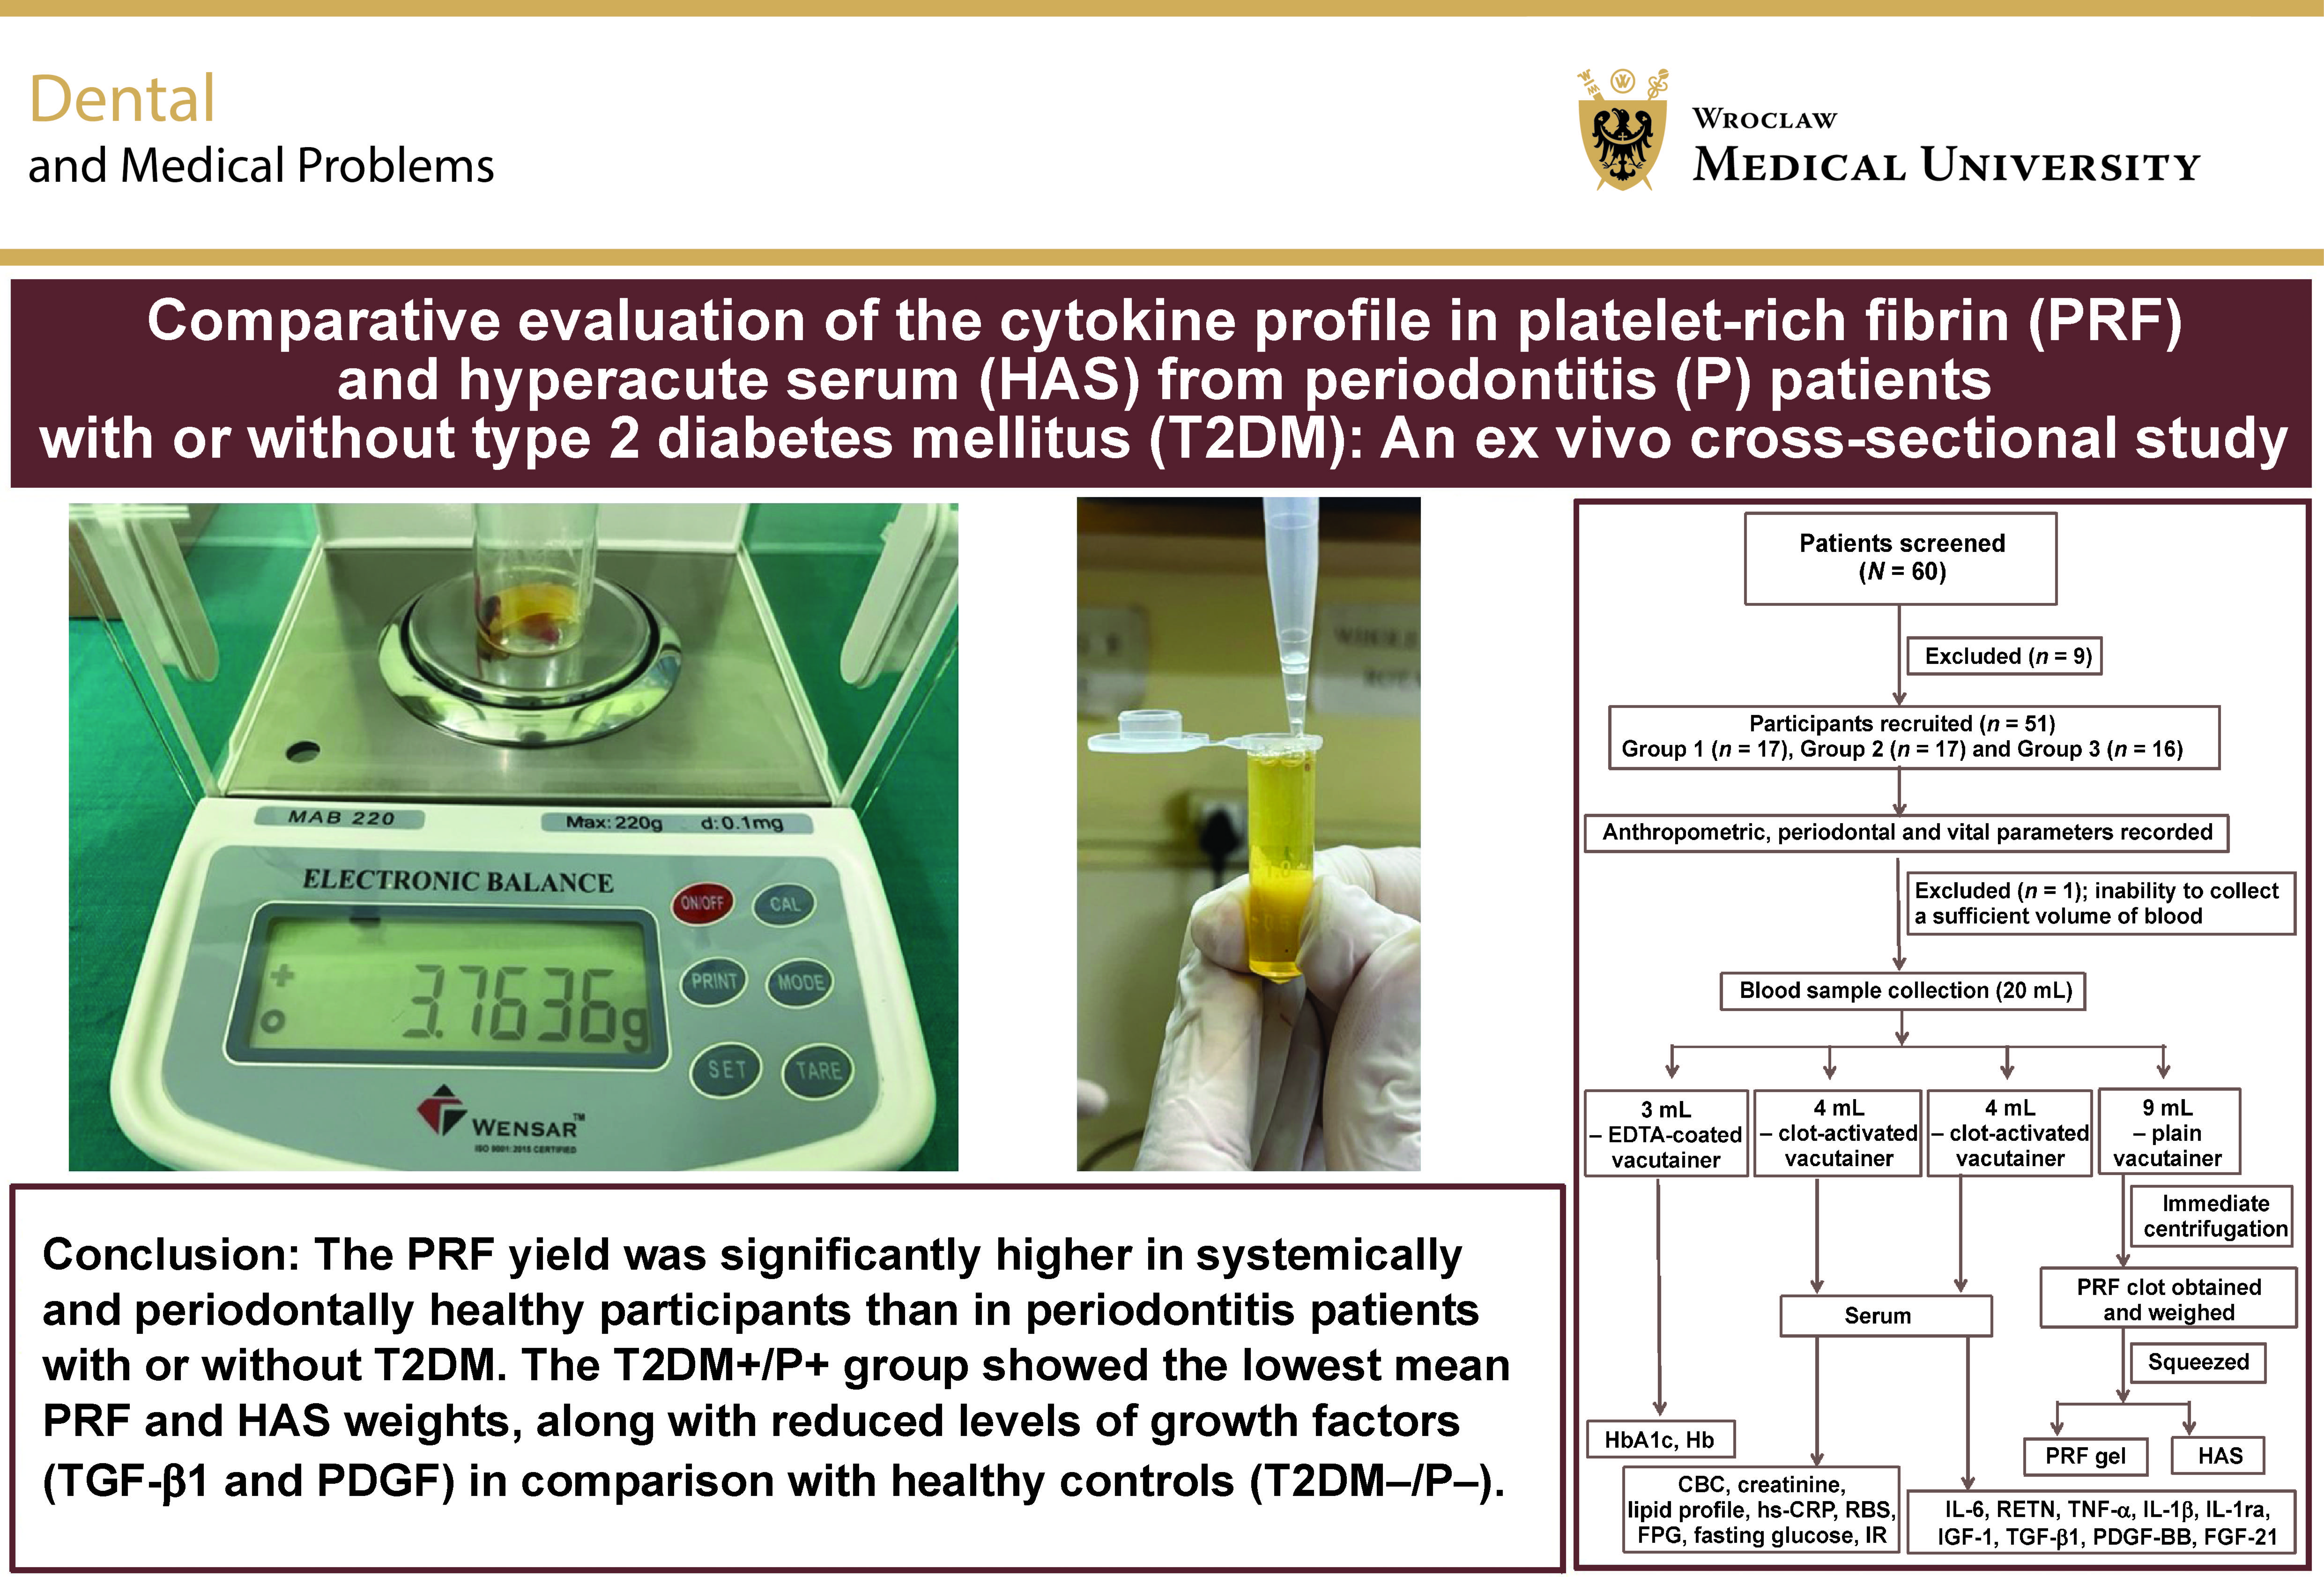
Objectives. The present cross-sectional study was conducted to evaluate the weight and cytokine levels of the PRF and HAS obtained from periodontitis patients with or without T2DM in a laboratory setting.
Material and methods. Platelet-rich fibrin and HAS were obtained from 17 periodontitis patients with T2DM (group 1: T2DM+/P+), 17 periodontitis patients without T2DM (group 2: T2DM−/P+), and 16 periodontally healthy participants (group 3: T2DM−/P−). Demographic, periodontal and hematological parameters were recorded for all participants. Serum, PRF and HAS samples were quantified and analyzed for inflammatory markers – interleukin-6 (IL-6), resistin (RETN), tumor necrosis factor-alpha (TNF-α), IL-1β, and interleukin-1 receptor antagonist (IL-1ra) – as well as growth factors, including insulin-like growth factor-1 (IGF-1), transforming growth factor-beta 1 (TGF-β1), platelet-derived growth factor-BB (PDGF-BB), and fibroblast growth factor-21 (FGF-21).
Results. The quantities of PRF and HAS obtained were significantly higher in healthy individuals as compared to diabetic patients. The concentrations of inflammatory markers and growth factors in serum, PRF and HAS from periodontitis patients were not significantly different between those with and without T2DM.
Conclusions. Periodontitis in conjunction with T2DM may influence the weight of PRF and HAS; however, no significant association was observed with respect to the levels of inflammatory markers and growth factors.
Keywords: periodontitis, type 2 diabetes mellitus, inflammatory markers, growth factors, platelet-rich fibrin
Introduction
Insulin resistance (IR) or insufficiency leading to hyperglycemia is the hallmark of type 2 diabetes mellitus (T2DM).1 Type 2 diabetes mellitus is reported to have affected approx. 462 million individuals by 2017, accounting for 6.28% of the global population,2 and it constitutes nearly 90% of diabetes cases worldwide.3, 4 It is predicted that by 2025, the countries with the highest number of individuals with diabetes will be India, China and the United States.5 According to the National Family Health Survey of India (NFHS), 2019–2021, India currently has 74.9 million individuals with diabetes mellitus (DM), and this number is projected to rise to 124.9 million over the next 24 years.6
Periodontitis is a microbially induced, localized, chronic inflammatory disease of the supporting tissues of the teeth, characterized by a dysregulated host inflammatory response that leads to periodontal tissue breakdown and eventual tooth loss.7 The interrelationship between T2DM and periodontitis has been studied for over 50 years.8 In a joint consensus report by the European Federation of Periodontology (EFP) and the International Diabetes Federation (IDF), Sanz et al. highlighted the association of elevated levels of inflammatory cytokines in the gingival tissues of individuals with periodontitis and T2DM.9
Among various platelet concentrates (PCs), autologous platelet-rich fibrin (PRF) is widely used in surgical procedures, not only in the disciplines of oral surgery, implant dentistry and periodontology, but also as a surgical adjunct in sports medicine, in orthopedic surgery and as a healing gel for diabetic foot ulcers.10, 11, 12 In recent years, hyperacute serum (HAS) has been introduced; it is obtained by squeezing the PRF clot through an additive-free, single-step process. Hyperacute serum is a potential regenerative agent that promotes wound healing, mimicking the natural coagulation cascade.13
Platelets release a range of pro-inflammatory, anti-inflammatory and pro-regenerative cytokines upon contact with the exposed endothelium, thereby facilitating wound healing. Various cytokines studied in PRF include interleukin-1 beta (IL-1β), IL-4, IL-6, tumor necrosis factor-alpha (TNF-α), interleukin-1 receptor antagonist (IL-1ra), insulin-like growth factor-1 (IGF-1), transforming growth factor-beta 1 (TGF-β1), platelet-derived growth factor-BB (PDGF-BB), fibroblast growth factor-21 (FGF-21), epidermal growth factor (EGF), and vascular endothelial growth factor (VEGF), all of which contribute to the natural wound healing process.14, 15, 16, 17, 18, 19
Resistin (RETN), an inflammatory cytokine first described in 2001 as an adipose-secreted polypeptide, has been linked to IR and periodontitis.20, 21 Increased concentrations of RETN, an important inflammatory marker, in gingival crevicular fluid (GCF) and serum have been associated with poor glycemic control in T2DM patients with periodontitis.22, 23 However, its correlation in serum, PRF and HAS in periodontitis patients with T2DM has not yet been investigated.
Periodontitis is widely regarded as the 6th microvascular complication of DM, and diabetes may exert an inductive effect on the cytokine and growth factor levels in the PRF obtained from the affected patients. Clinical studies have suggested that cytokine release from PRF in diabetic patients with periodontitis may be reduced.15 To the best of our knowledge, no published report to date has evaluated inflammatory markers and growth factors in both PRF and HAS in periodontitis patients with or without T2DM.
It is hypothesized that periodontitis patients with T2DM may exhibit variations in the regenerative potential of PRF and HAS in terms of inflammatory markers and growth factors. Therefore, the present observational study was designed to evaluate inflammatory markers and growth factors in PRF and HAS among patients with and without T2DM to test this hypothesis. Additionally, the study assessed biochemical (hematological and lipid) parameters, and examined the quantitative association of PRF and HAS with glycated hemoglobin (HbA1c) in patients with periodontitis, with and without T2DM.
Material and methods
Investigation design
This cross-sectional study was carried out from March 2021 to March 2023 in Lucknow, India, according to the STROBE (Strengthening the Reporting of Observational Studies in Epidemiology) criteria. The study was conducted in accordance with the principles and ethical guidelines outlined in the Declaration of Helsinki 1964, amended in 2013. The study protocol (#FV1PE21122020R) was approved by the Institutional Research and Development Committee (IRDC) and the Institutional Human Ethics Committee (IHEC) at Saraswati Dental College and Hospital, Lucknow, India.
Case definition
Periodontitis was defined as the presence of interdental clinical attachment loss (CAL) >1 mm at 2 or more non-adjacent teeth, or buccal/oral CAL ≥ 3 mm with the probing pocket depth (PPD) >3 mm at 2 or more teeth.24, 25 Patients presenting with at least Stage II periodontitis or higher were enrolled in the present investigation as representative of periodontitis.25 Volunteers exhibiting bleeding on probing (BoP) at <10% of sites, PPD ≤ 3 mm, and no evidence of horizontal or vertical bone loss on radiographs were considered periodontally healthy.26 Participants with the fasting plasma glucose (FPG) level ≥126 mg/dL, the random blood sugar (RBS) level >200 mg/dL and HbA1c > 6.5% were classified as having T2DM according to the World Health Organization (WHO) and related criteria, whereas those with values below these thresholds were considered non-diabetic.27
Study population
For the present cross-sectional study, periodontitis patients of Indian origin meeting the below-mentioned inclusion and exclusion criteria were recruited from the individuals visiting the Department of Periodontology of Saraswati Dental College and Hospital, Lucknow, India, for the management of periodontal diseases. Those who voluntarily agreed to participate and provided written informed consent, after a thorough explanation of the study aims and objectives, were enrolled. Healthy volunteers from within the institute were included as representatives of the control group.
Inclusion criteria
Participants with moderate to severe periodontitis (Stage II and above, Grade B or C), with T2DM, aged 40–50 years, of either sex, who were non-smokers and non-alcohol consumers, were included. Eligible participants had a minimum of 20 teeth present and at least 8 sites with CAL ≥ 3 mm and PPD ≥ 4 mm. Additionally, they had received no or only stable doses of oral hypoglycemic agents, and had not undergone periodontal therapy or received any systemic or local medications in the preceding 6 months. Volunteers of both sexes with a healthy periodontium (CAL < 1 mm), aged 40–50 years, were also included as controls (T2DM−/P−), as described earlier.26
Exclusion criteria
Exclusion criteria comprised the presence of systemic illnesses other than T2DM; pregnant or lactating women; patients with major complications of T2DM (e.g., cardiovascular or peripheral vascular diseases, renal disorders, and hypertension); and individuals with acute infections, heart failure or malignancy at the time of blood collection. Participants who declined to provide written informed consent and those with an inadequate platelet count (<100,000 per milliliter) were also excluded.
Sample size
The sample size was calculated based on the minimum variation observed among growth factors (IGF, PDGF-BB, FGF, EGF, and VEGF) in PRF and HAS at the final follow-up, as reported by Su et al.17 The maximum standard deviation (SD) for growth factor parameters in the PRF group was σ = 0.47. The difference deemed clinically significant in the HAS group was d = max (σ1, σ2) , which is the maximum SD of growth factor values. A type II error (β) of 20% was assumed to achieve 80% study power, while a type I error (α) of 5% corresponded to a 95% confidence level. Based on these assumptions, the minimum required sample size was calculated to be n = 15 participants per group.
Recruitment of volunteers
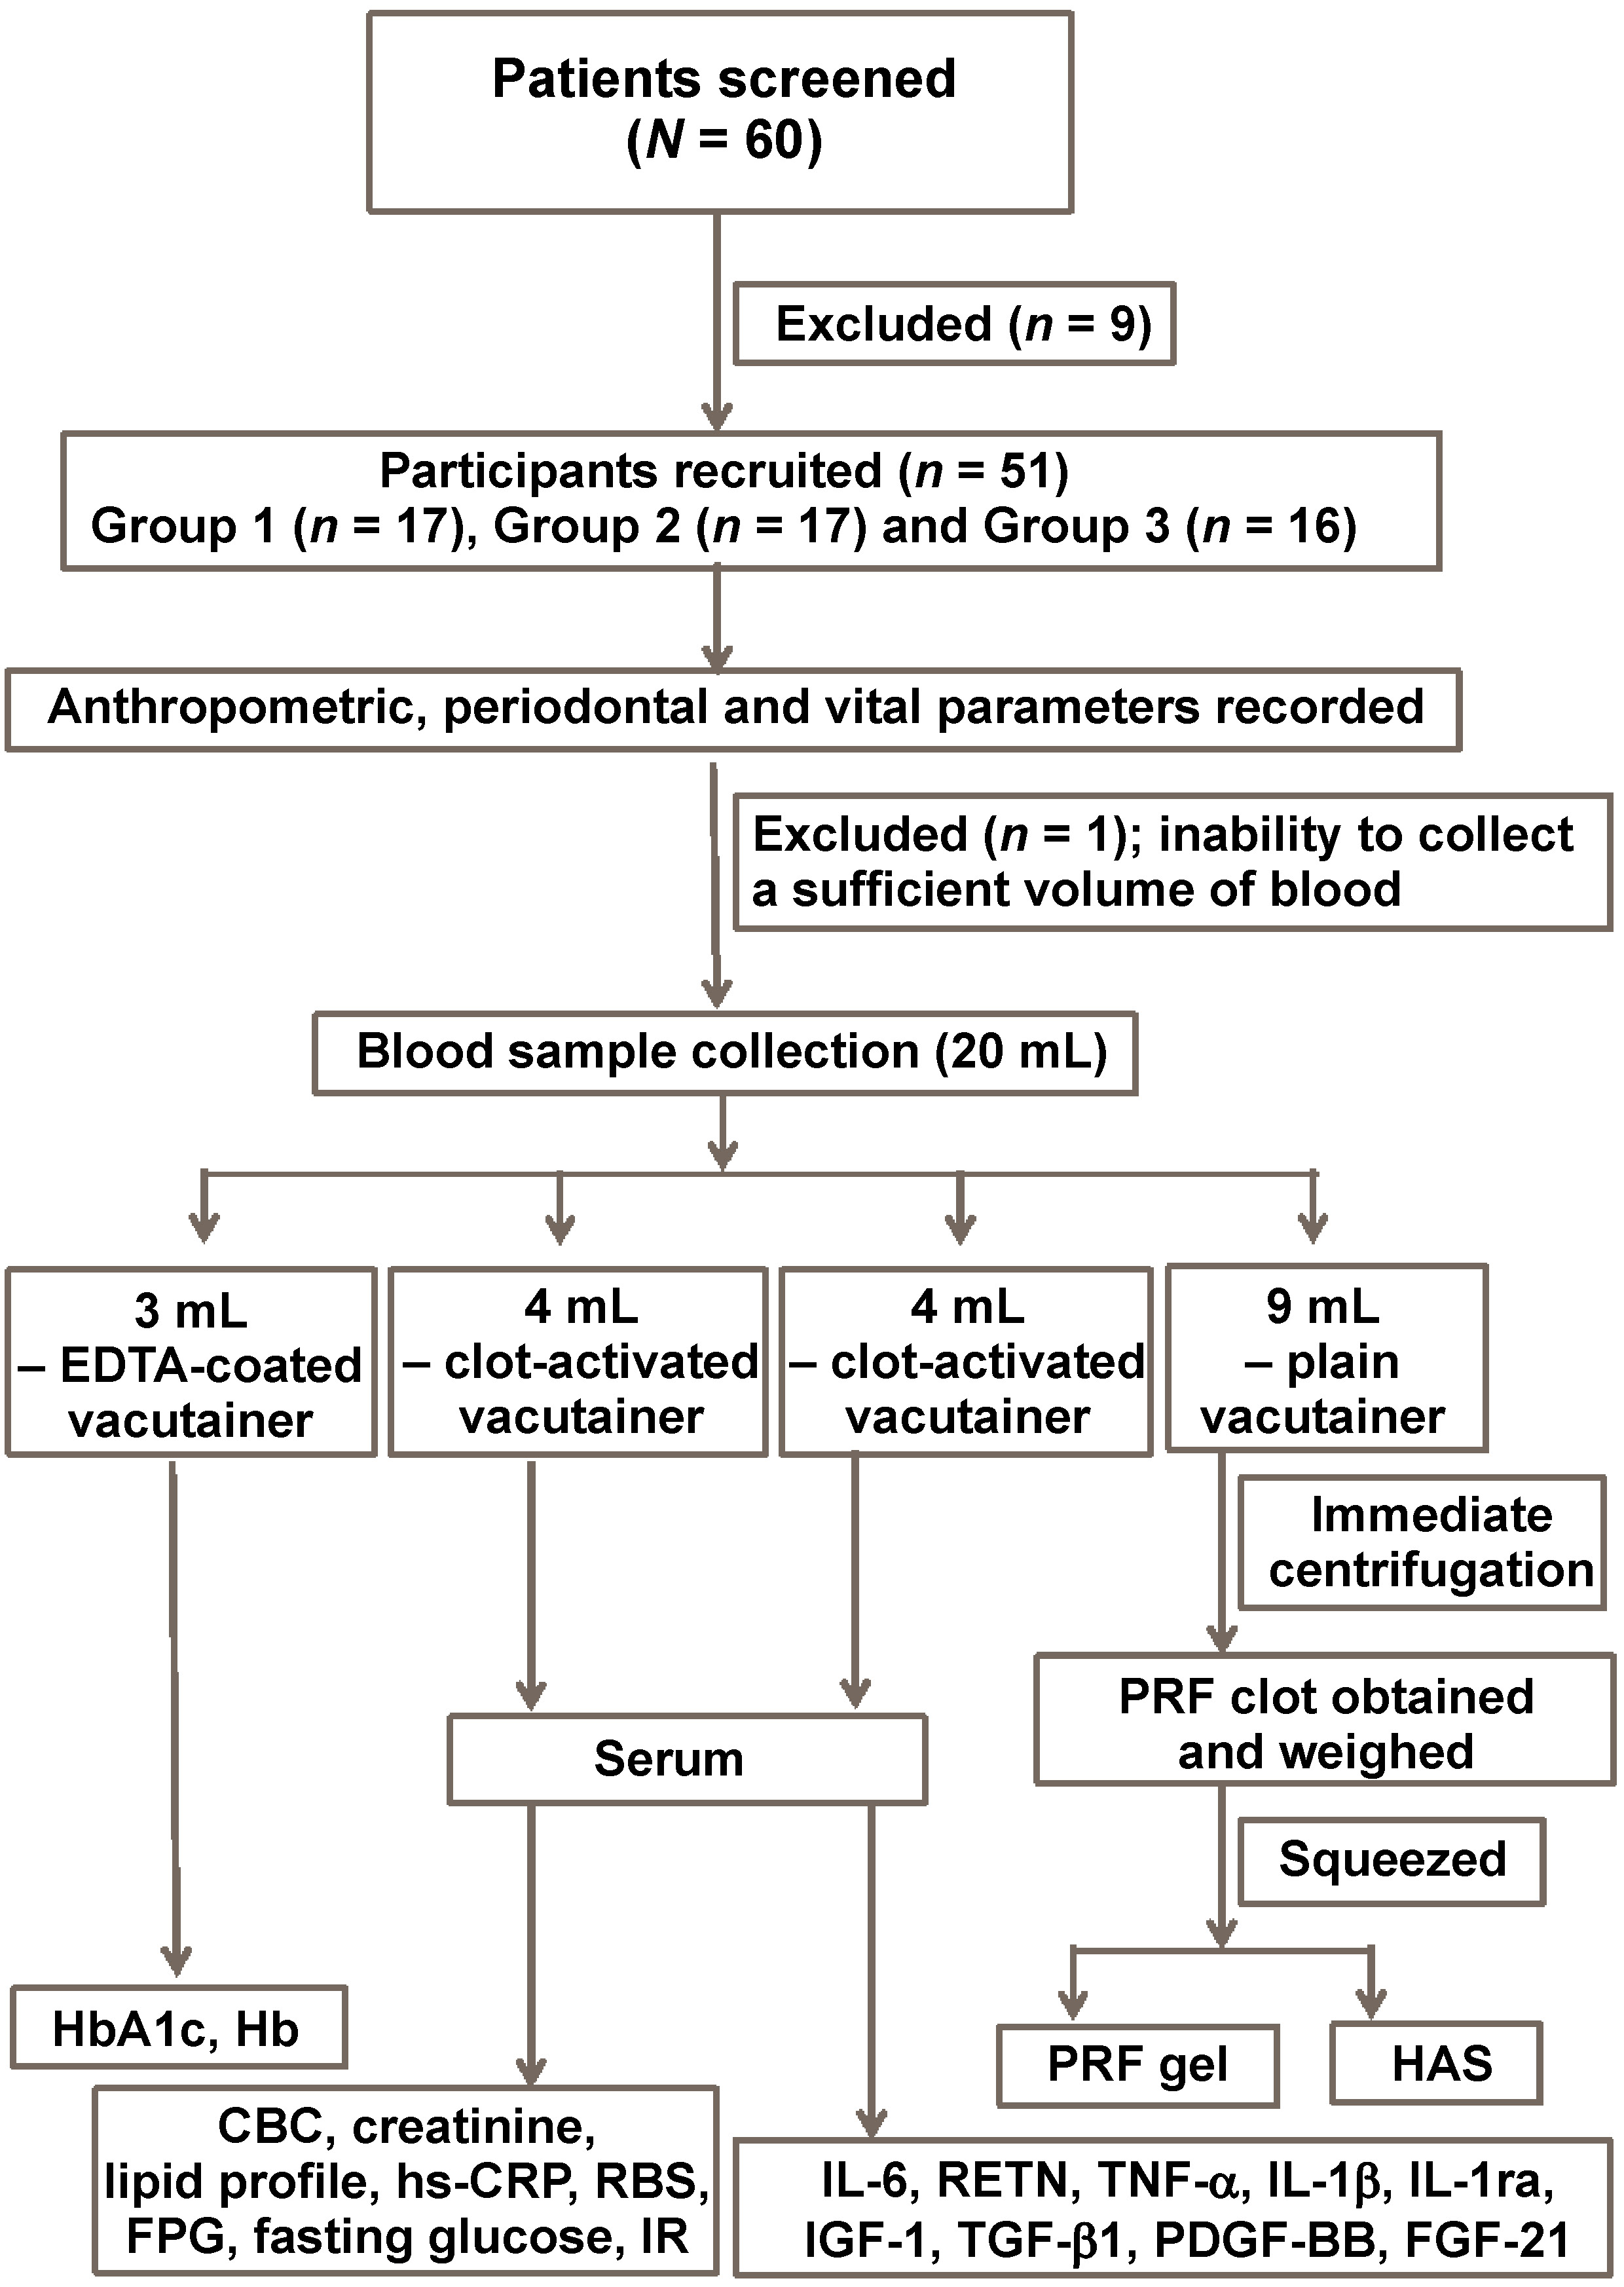
A total of 60 patients visiting the Department of Periodontology were screened for the diabetic status, oral hygiene, weight, height (in centimeters), the body mass index (BMI), and RBS. Comprehensive dental and medical histories were recorded. To exclude systemic diseases other than T2DM, the participants were evaluated for vital parameters, including blood pressure (BP), the pulse rate (beats per minute), body temperature, and the respiratory rate (breaths per minute). All participants underwent blood sampling prior to enrollment in the study.
After careful screening, 51 volunteers were finally recruited for the study. Using a scalp vein infusion set and a 20-mL syringe, 20 mL of blood was drawn from the antecubital region (the median cephalic vein) of each participant. At this stage, 1 participant was excluded due to the inability to collect a sufficient volume of blood. Of the total volume collected, 3 mL of whole blood was transferred into an ethylenediaminetertaacetic acid (EDTA)-coated test tube for the analysis of HbA1c and hemoglobin (Hb). Eight milliliters of blood were equally distributed into 2 clot-activated vacutainers (4 mL each) for serum extraction. Serum obtained from one 4-mL sample was used to assess the complete blood count (CBC), creatinine, the lipid profile, high-sensitivity C-reactive protein (hs-CRP), RBS, FPG, fasting glucose, and IR. Serum from the other 4-mL sample was stored at −80°C for the subsequent analysis of cytokines and growth factors. The remaining 9 mL of blood was immediately transferred into a plain vacutainer for the preparation of PRF and HAS (Figure 1). All procedures were performed by a single trained investigator under standardized conditions at room temperature (27°C) to minimize variability.
Grouping
The enrolled participants were allocated into 3 groups according to the study design: group 1 (T2DM+/P+), comprising periodontitis patients with T2DM (n = 17); group 2 (T2DM−/P+), comprising systemically healthy patients with periodontitis (n = 17); and group 3 (T2DM−/P−), comprising systemically healthy individuals with a healthy periodontium (n = 16). To further distinguish the glycemic control status, group 1 (T2DM+/P+) was subdivided into 2 subgroups based on the HbA1c level: <8% (poorly controlled); and ≥8% (uncontrolled).
Preparation of PRF and HAS
As recommended by Choukroun et al.,28 autologous PRF was prepared from the patient’s blood using a tabletop centrifuge with a fixed-angle rotor head (REMI R-303; IndiaMART, Noida, India). Blood was centrifuged in 9-mL pre-sterilized vacutainers (Labtech Healthcare India, Jaipur, India) at 3,000 rpm (relative centrifugal force (RCF) = 755 g; rotor radius = 7.5 cm) for 12–14 min at room temperature. For HAS preparation, the resulting fibrin clot was gently compressed using flat instruments, and the serum part was collected in microcentrifuge tubes and stored at −80°C for further analysis. To ensure standardization, all samples were collected by a single trained investigator and processed by another trained investigator under identical conditions, using the same centrifuge at room temperature.
Parameters recorded
Demographic analysis
The following demographic data was collected and analyzed: age; sex; weight; height; and BMI.
Periodontal parameters
Each participant underwent a comprehensive full-mouth oral examination using standard diagnostic instruments. All clinical parameters were recorded by a single trained investigator to eliminate inter-observer variability.
The gingival index (GI) was assessed at the facial (labial/buccal), lingual/palatal, mesial, and distal gingival margins.29 Similarly, the plaque index (PI) was evaluated using a blunt probe/explorer on the facial (labial/buccal), lingual/palatal, mesial, and distal surfaces of all teeth.30 The probing pocket depth (PPD) was measured at 6 sites per tooth, using a calibrated instrument (University of North Carolina-15 probe, UNC-15), as previously described.15 Clinical attachment loss (CAL) was determined by measuring the distance from the cementoenamel junction (CEJ) to the base of the pocket or sulcus.
Systemic parameters
Glycated hemoglobin, Hb, CBC, hs-CRP, creatinine, total cholesterol, high-density lipoprotein (HDL), low-density lipoprotein (LDL), very low-density lipoprotein (VLDL), triglycerides, RBS, FPG, fasting insulin, and IR were recorded as explained in previous studies.31, 32
Quantification of PRF/HAS
An analytical balance (Wensar; Chennai, India) with a readability of 0.0001 g was used to measure the weight of the collected PRF clot. The prepared HAS obtained from the fibrin clot was measured using a micropipette and subsequently stored at −80°C in microcentrifuge tubes for further analysis.
The quantification of PRF/HAS is highly sensitive; therefore, meticulous care was taken to standardize the sampling conditions, including the participants’ demographics, blood collection and centrifugation procedures.
Sample preparation for the evaluation of markers
The samples stored at −80°C were thawed, homogenized and centrifuged at 3,000 rpm for 10 min at room temperature. The resulting supernatants were aliquoted and stored again at −80°C until analysis. Specific biomarkers were quantified using appropriate enzyme-linked immunosorbent assay (ELISA) kits in accordance with the manufacturer’s instructions (Elabscience Biotechnology Inc., Houston, USA). All standards and samples were assayed in duplicate for each marker, and mean values were calculated. The results were adjusted by applying the appropriate dilution factor. All biomarker analyses and data interpretation were performed by trained investigators who were blinded to group allocation, using the Origin® software (OriginLab Corporation, Northampton, USA).
Inflammatory markers and growth factors (ELISA kit)
Ninety-six-well ELISA kits were used to quantify the following human biomarkers: IL-6; RETN; TNF-α; IL-1β; IL-1ra; IGF-1; TGF-β1; PDGF-BB; and FGF-21.
Statistical analysis
Statistical analysis was performed using IBM SPSS Statistics for Windows, v. 26.0 (IBM Corp., Armonk, USA). The data was analyzed using descriptive statistics, with comparisons made among study groups. Categorical variables were summarized as frequencies and percentages (n (%)), while quantitative data was expressed as mean ± standard deviation (M ±SD). A p-value <0.05 was considered statistically significant.
Intergroup differences were assessed using the one-way analysis of variance (ANOVA). When a significant difference was detected, Tukey’s post hoc test was applied for pairwise comparisons between the group means. Comparisons between two groups were performed using the unpaired t test. Correlation analysis was conducted to evaluate the strength and direction of associations, whether causal or not, between two random variables or bivariate data.
Results
The mean age of individuals in group 1 (T2DM+/P+), group 2 (T2DM−/P+) and group 3 (T2DM−/P−) was 46.53 ±4.62 years, 45.76 ±2.88 years and 45.50 ±3.74 years, respectively. No statistically significant differences were observed in age or gender distribution among the 3 groups. The BMI of individuals in group 1 was statistically significantly higher, with a mean value of 25.81 ±2.44 kg/m2, as compared to 24.14 ±2.44 kg/m2 and 23.36 ±1.59 kg/m2 in groups 2 and 3, respectively. No statistically significant differences were observed among the groups with respect to the pulse rate, body temperature or diastolic blood pressure (DBP). However, statistically significant variations in BMI and systolic blood pressure (SBP) may be associated with T2DM and periodontitis (i.e., group 1). No statistically significant difference in the mean BMI values was observed between group 2 and group 3.
The intergroup comparisons of demographic, vital, biochemical/hematological, lipid profile, glycemic, and periodontal parameters, as well as the quantity of PRF and HAS, and the time required for PRF preparation among the study groups, are summarized in Table 1. The analysis indicated significant differences among the groups (p = 0.001), with group 3 demonstrating the highest PRF clot weight, followed by group 2 and group 1. A similar trend was observed for HAS; however, the difference was not statistically significant. The time required for the procedures differed significantly among the groups (p < 0.001). Notably, the average time required for PRF preparation was 14 min in groups 2 and 3, as compared to a mean of 15.65 ±2.15 min in group 1.
Although diabetic patients could not be stratified into controlled, moderately controlled and poorly controlled categories due to the small sample size, convenience sampling allowed further subdivision of the T2DM+/P+ group into 2 subgroups based on the HbA1c level: <8% (9 participants); and ≥8% (8 participants). The average time required for PRF preparation in periodontitis patients with uncontrolled diabetes (HbA1c ≥ 8%) was 16.00 ±2.14 min. The comparisons of the mean values of demographic, vital, biochemical/hematological, lipid profile, glycemic, and periodontal parameters, as well as the quantity of PRF and HAS, and the time required for PRF preparation between the subgroups (HbA1c < 8% and HbA1c ≥ 8%) within group 1 (T2DM+/P+), are summarized in Table 2.
The post hoc Tukey’s test results, used to identify specific pairwise differences between the group means for the parameters showing significant differences in ANOVA, are summarized in Table 3.
The intergroup comparisons of the concentrations of inflammatory markers (human IL-6, RETN, TNF-α, IL-1β, and IL-1ra) and growth factors (human IGF-1, TGF-β1, PDGF-BB, and FGF-21) in serum, PRF and HAS in periodontitis patients with or without T2DM, as well as in healthy participants, are summarized in Table 4.
The correlations of the weight of PRF and HAS with periodontal and glycemic parameters, as well as the correlations of periodontal parameters with glycemic parameters, are summarized in Table 5 and Table 6, respectively. The results suggest that PRF exhibited a strong negative correlation with GI, PI, PPD, CAL, HbA1c, RBS, and FPG, indicating that as these parameters increased, the weights of PRF and HAS decreased.
Discussion
The present observational study evaluated variations in the levels of cytokines in the PRF and HAS obtained from periodontitis patients with or without T2DM, in comparison with healthy individuals (no periodontitis and no T2DM). Primarily, it was observed that periodontitis, with or without T2DM, may influence the concentrations of the inflammatory markers and growth factors released from platelet concentrates. Secondarily, it was also observed that the T2DM+/P+ status may influence the weight of platelet concentrates.
Although the influence of centrifuge characteristics has already been studied in detail,33, 34 to the best of the authors’ knowledge, this is the first study to evaluate both the quantity and quality of PRF and HAS in terms of 5 inflammatory markers and 4 growth factors, while also correlating the weight of platelet concentrates with periodontal and glycemic parameters in quadragenarian (40–50-year-old) individuals.
The present study showed no significant differences in the TNF-α, IL-1Ra, IGF-1, and FGF-21 levels in the serum, PRF and HAS obtained from the participants across the 3 groups. Consistent with previous reports,15, 35, 36 the TGF-β level was significantly higher in the healthy T2DM−/P− group, whereas the inflammatory marker IL-1β was elevated in the diseased groups 1 and 2, as compared to healthy individuals, across serum, PRF and HAS. Gupta et al. reported a significant impact of periodontitis and diabetes on 2 growth factors – TGF-β1 and PDGF-BB – and on the three-dimensional (3D) structure of PRF.15 Unlike Gupta et al., where the study population was stratified by age groups,15 the present study was conducted in a narrowly defined cohort to minimize the potential influence of diabetes-associated complications and other comorbidities on the outcomes.
Singh et al. reported that the mean age of patients with T2DM presenting to a tertiary care center in North India was 49.03 ±0.49 years, with most patients falling within the 40–50-year age group.37 In line with previous reports,38, 39, 40 the present study also observed a mean age of 44–46 years for early-onset T2DM.
Both autologous PRF and HAS are considered to possess biological healing properties owing to their cytokine content. Similar to Narayan and Malaiappan,41 the present study also quantitatively analyzed PRF and HAS in T2DM+/P+ (group 1), T2DM−/P+ (group 2) and T2DM−/P− (group 3), and observed a significantly higher PRF weight in healthy individuals as compared to T2DM+/P+ and T2DM−/P+ patients. Based on these findings, it can be hypothesized that chronic inflammatory conditions may influence the quantity of PRF and HAS. These results are consistent with previous studies suggesting alterations in PRF constituents in T2DM+/P+ patients.15, 32, 42
In contrast to Das and Janardhana Amaranath, who reported higher leukocyte and platelet counts and a larger size of advanced PRF (A-PRF) in uncontrolled T2DM female subjects as compared to healthy individuals and tobacco smokers,42 the findings of the present study are in agreement with those of Gupta et al.15
Another important finding of the study was the longer duration (14 min) required for the procurement of PRF, as compared to the standard established protocol of 10–12 min. This may be attributed to the use of pre-sterilized 9-mm plastic vacutainers for PRF preparation in the present study. Thus, the findings are in agreement with previous studies suggesting that the time required to prepare PRF in plastic tubes is considerably longer than that in glass tubes or glass-coated plastic tubes.43, 44, 45 More interestingly, another notable observation was the longer time required for PRF procurement in the T2DM+/P+ group patients as compared to non-diabetic patients – with or without periodontitis. This suggests a potential impact of systemic inflammatory conditions in T2DM+/P+ (group 1) patients.15, 46
The present study comprehensively explains the relationship between T2DM, periodontitis, and wound healing potential. It also highlights several important clinical implications. Significantly lower mean PRF weight and reduced mean levels of growth factors (TGF-β1 and PDGF-BB) in serum, PRF, and HAS in diabetic patients support the impaired or delayed wound healing commonly observed in T2DM, which may be further exacerbated by the presence of periodontitis. Thus, the determination of growth factors in PRF and HAS may be particularly beneficial in the management of diabetic patients with periodontal disease using PRF, and may provide insights into future therapeutic approaches. Baran et al., in an animal study, reported an enhanced regenerative capacity with photomodulation,47 which could be further explored in the context of the PRF obtained from T2DM+/P+ patients.
One limitation of the study was the small number of participants. The extensive experimental requirements, including the analysis of 9 markers, limited the inclusion of a larger sample size. Another limitation was the lack of inclusion of T2DM patients without periodontitis, which would have provided a more robust comparison to better understand the interplay between T2DM and periodontitis. However, all participants were within the age group of 40 to 50 years and were recruited from the Department of Periodontology, where patients primarily report for the management of periodontal diseases. Therefore, a group of T2DM patients without periodontitis could not be included. Previous studies have reported that the prevalence of periodontitis in established T2DM patients exceeds 90% in the North Indian population.37 Furthermore, the referral of T2DM patients without periodontitis for oral health evaluation remains uncommon in the Indian subcontinent, possibly due to a lack of collaborative practice between physicians and other healthcare professionals.48
Conclusions
Within the limitation of the narrow age selection of participants, which may have underestimated the inflammatory and growth factor levels, it can be surmised from the present study that periodontitis along with T2DM may have detrimental effects on the regenerative potential of PRF and HAS. The present study demonstrated significantly lower mean levels of PDGF and TGF-β1 in the PRF obtained from the participants in the T2DM+/P+ group as compared to the T2DM−/P+ and T2DM−/P− (control) groups (p = 0.043 and p < 0.001, respectively). Furthermore, a statistically significantly higher mean PRF weight was observed in the T2DM−/P− group (3.20 ±0.78 g), followed by the T2DM+/P+ group (2.16 ±0.73 g), and the T2DM−/P+ group (2.84 ±0.83 g) with the lowest value. These preliminary findings may serve as a basis for further multicenter studies with larger sample sizes.
Ethics approval and consent to participate
The study protocol (#FV1PE21122020R) was approved by the Institutional Research and Development Committee (IRDC) and the Institutional Human Ethics Committee (IHEC) at Saraswati Dental College and Hospital, Lucknow, India. Written informed consent was obtained from all the participants.
Data availability
All the data is included in the manuscript. Any further information may be obtained from the corresponding author on reasonable request.
Consent for publication
Not applicable.
Use of AI and AI-assisted technologies
The authors confirm that they used artificial intelligence (AI)-assisted technology solely for language refinement and to improve the clarity of writing. No AI assistance was employed in the generation of scientific content, data analysis or interpretation.