Dental and Medical Problems

Dent Med Probl
Journal Impact Factor (JIF 2024) – 3.9
Journal Citation Indicator (JCI 2024) - 1.36
Scopus CiteScore (2024) – 5.0 (CiteScore Tracker – 5.8)
Index Copernicus Value (ICV 2024) – 178.25
MNiSW – 70 pts
ISSN 1644-387X (print)
ISSN 2300-9020 (online)
Periodicity – bimonthly


Download original text (EN)

Dental and Medical Problems

2026, vol. 63, nr 1, January-February, p. 87–104

doi: 10.17219/dmp/210050

Publication type: original article

Language: English

License: Creative Commons Attribution 3.0 Unported (CC BY 3.0)

Download citation:

  • BIBTEX (JabRef, Mendeley)
  • RIS (Papers, Reference Manager, RefWorks, Zotero)

Cite as:


Riad A, Attia S. Disproportionality analysis of oral adverse events following COVID-19 vaccination: Investigating demographic disparities and notoriety bias using a hybrid frequentist–Bayesian approach. Dent Med Probl. 2026;63(1):87–104. doi:10.17219/dmp/210050

Disproportionality analysis of oral adverse events following COVID-19 vaccination: Investigating demographic disparities and notoriety bias using a hybrid frequentist–Bayesian approach

Abanoub Riad1,2,A,B,C,D,F, Sameh Attia3,A,E,F

1 Department of Public Health, Faculty of Medicine, Masaryk University, Brno, Czech Republic

2 Masaryk Centre for Global Health (MCGH), Department of Public Health, Faculty of Medicine, Masaryk University, Brno, Czech Republic

3 Department of Periodontology, Oral Medicine and Oral Surgery, Charité – Universitätsmedizin Berlin, Germany

Graphical abstract


Graphical abstracts

Highlights


  • Oral adverse events (AEs) were reported 2.4 times more frequently after COVID-19 vaccination than after other vaccines in the Vaccine Adverse Event Reporting System (VAERS), indicating signals of disproportionate reporting.
  • The highest disproportionality was observed for taste disorder (proportional reporting ratio (PRR) ≈ 23.96), ageusia (≈ 17.79), hypogeusia (≈ 6.25), and dysgeusia (≈ 3.22), along with other sensory- and dental-related AEs.
  • Higher reporting ratios were noted among females than males, while severe, hospitalized and fatal cases were relatively uncommon, suggesting that most oral AEs were mild.
  • The frequent co-occurrence of gustatory and olfactory AEs, together with pandemic-related temporal patterns, suggests that increased public awareness may have influenced reporting, highlighting the need to distinguish true safety signals from stimulated reporting.
  • Similar disproportionality of oral AEs was observed in “red” and “blue” states, and state-level political inclination was not a significant predictor in regression analyses, indicating that reporting patterns were largely independent of political context.

Abstract

Background. Ensuring vaccine safety is crucial for maintaining public confidence, particularly in relation to non-life-threatening adverse events (AEs) that may impact quality of life and contribute to vaccine hesitancy. While systemic reactions to coronavirus disease 2019 (COVID-19) vaccines are well documented, oral AEs remain underexplored, despite emerging reports linking vaccination to taste disturbances and other oral manifestations.

Objectives. The aim of the study was to explore oral AEs following COVID-19 vaccination and to assess their potential to constitute signals of disproportionate reporting (SDRs) that warrant further investigation and validation.

Material and methods. A hybrid frequentist–Bayesian signal detection approach was applied to analyze oral AEs following COVID-19 vaccination using data from the US Vaccine Adverse Event Reporting System (VAERS). A two-stage analysis was conducted. The primary analysis identified SDRs, and the secondary analysis assessed reporting biases, including selective reporting bias and notoriety bias.

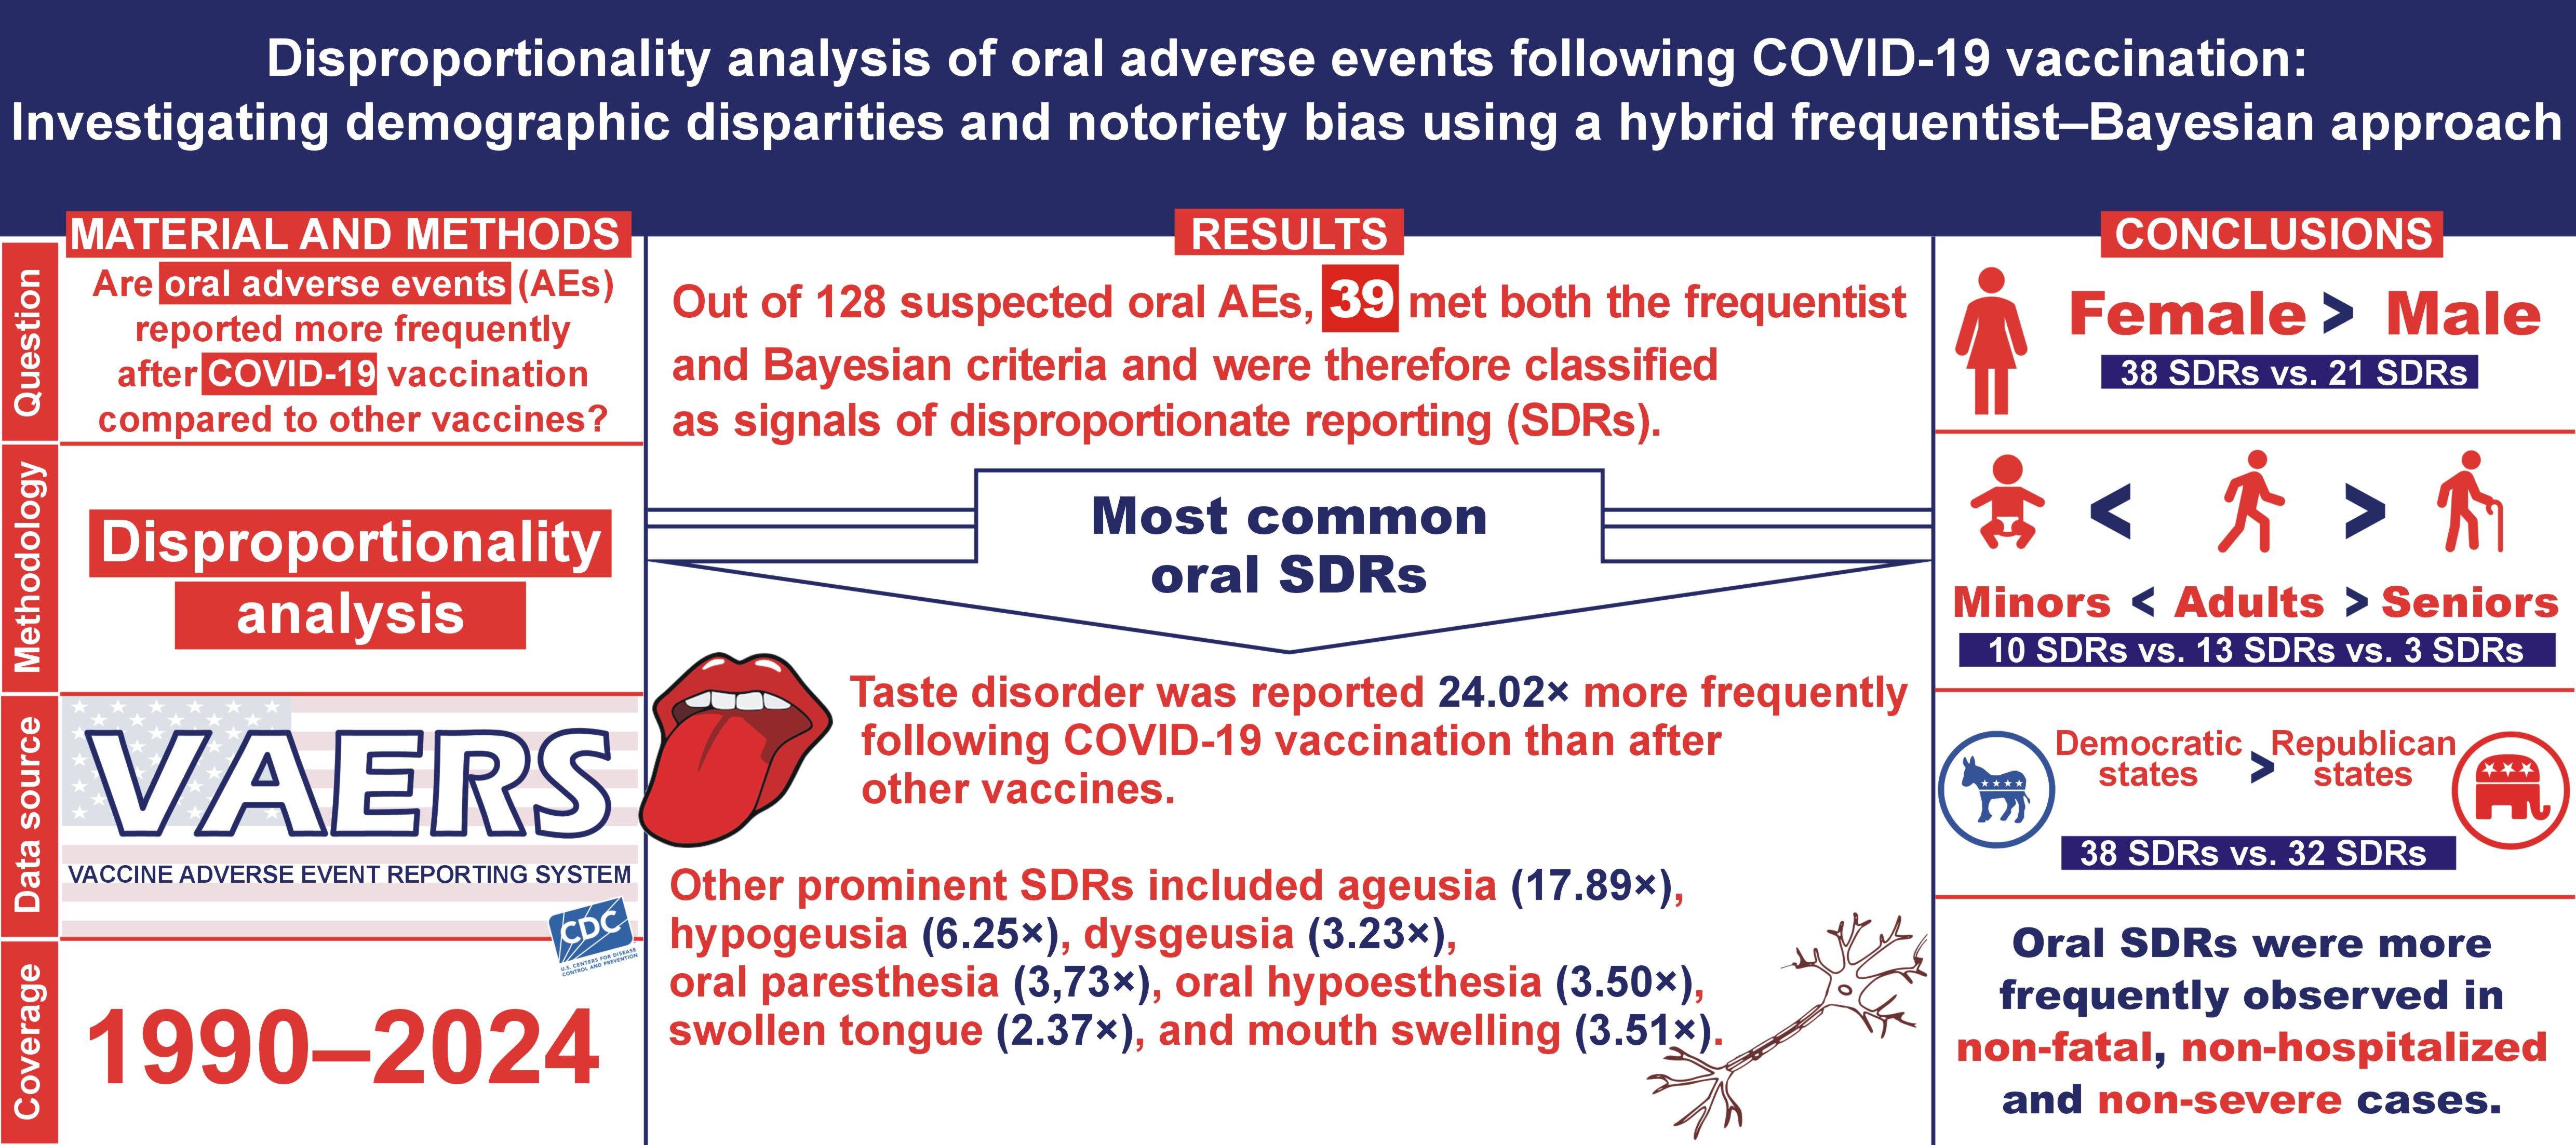
Results. Oral AEs were reported 2.4 times more frequently following COVID-19 vaccination compared with other vaccines, with taste-related SDRs showing the highest disproportionality. The most prominent SDRs included taste disorder (proportional reporting ratio (PRR) = 23.96), ageusia (PRR = 17.79), hypogeusia (PRR = 6.25), dysgeusia (PRR = 3.22), and oral lichen planus (PRR = 3.12). Females and middle-aged adults exhibited the highest reporting rates, whereas severe, hospitalized and fatal cases were less frequent. Co-occurrence analysis of gustatory and olfactory AEs suggests notoriety bias, likely influenced by increased public awareness. Regression analyses indicated that female sex and older age were associated with increased odds of oral SDRs, while state-level political inclination had no significant effect.

Conclusions. The findings highlight demographic disparities in the reporting of oral AEs. However, they should not be interpreted as undermining vaccine safety. Future research should focus on clinically significant oral SDRs, such as oral lichen planus, to distinguish true safety signals from potential reporting biases. Improved awareness and communication are essential for contextualizing these findings within dental practice.

Keywords: COVID-19 vaccines, oral manifestations, pharmacovigilance, adverse drug reaction reporting systems, Bayesian analysis

Introduction

Throughout history, anti-vaccination movements have actively spread misinformation regarding vaccine safety, often amplifying reports of adverse events (AEs) to undermine public confidence in immunization programs.1, 2 These tactics have evolved with advancements in communication technologies, particularly through social media, leading to widespread vaccine hesitancy.3 To counteract misinformation and ensure public trust, national pharmaco­vigilance systems play a crucial role in monitoring post-vaccination AEs, identifying safety signals and distinguishing true vaccine-related risks from coincidental events.4, 5 The Vaccine Adverse Event Reporting System (VAERS) in the United States serves as a cornerstone of passive surveillance, allowing healthcare providers and the public to report potential vaccine-related AEs.6 Among these, oral manifestations such as taste disorders, paresthesia and ulcers have emerged as notable concerns following corona­virus disease 2019 (COVID-19) vaccination.7, 8, 9, 10, 11

A growing body of evidence suggests that certain AEs may be disproportionately reported due to increased public awareness, regulatory alerts or media attention, a phenomenon known as notoriety bias.4, 12 This bias can lead to an overestimation of AE incidence in passive surveil­lance databases, as individuals become more likely to report events they perceive as vaccine-related. Taste-related AEs are particularly susceptible to notoriety bias, as loss of taste and smell are widely recognized diagnostic symptoms of severe acute respiratory syndrome coronavirus 2 (SARS-CoV-2) infection.13, 14, 15 Previous studies have shown that the reporting rate of taste-related AEs in VAERS was from 3 to 17 times higher during the pandemic compared with the pre-pandemic period.7 This raises concerns about whether taste-related AEs following COVID-19 vaccination reflect a true biological association or are influenced by heightened public vigilance.

While numerous studies have examined AEs following COVID-19 vaccination, most have focused on systemic reactions such as fever, fatigue and anaphylaxis, with relatively little attention given to less common AEs, including oral manifestations.16, 17 Prior analyses of passive surveillance databases have identified common patterns of oral AEs in major regions, such as the United States, the European Union and Australia; however, no study has comprehensively assessed their disproportionality using advanced signal detection methods.9

The present study aimed to conduct a disproportionality analysis of oral AEs following COVID-19 vaccination using a hybrid frequentist–Bayesian signal detection approach, thereby contributing to the long-term pharma­covigilance of novel vaccine technologies that remain in global use. By identifying true signals of disproportionate reporting (SDRs) and assessing the impact of factors such as sex, age, vaccine type, and state-level political inclination, this study sought to enhance understanding of vaccine safety monitoring. Additionally, by investigating the potential role of notoriety bias in the increased reporting of gustatory AEs, the findings may help refine pharmaco­vigilance methodologies and improve risk communica­tion strategies in future vaccination campaigns.

Material and methods

Study design

A disproportionality analysis was conducted in October 2024 using individual case safety reports (ICSRs) from VAERS. The study focused on oral AEs reported after COVID-19 vaccination to identify SDRs and validate them using an advanced statistical approach.

The analysis was performed and reported following the REporting of A Disproportionality analysis for drUg Safety signal detection using individual case safety reports in PharmacoVigilance (READUS-PV) guidelines to ensure transparency, reproducibility and methodological rigor.18

Data source

The Vaccine Adverse Event Reporting System is a pas­sive surveillance database jointly managed by the Centers for Disease Control and Prevention (CDC) and the Food and Drug Administration (FDA). It collects AE reports from healthcare professionals, vaccine manufacturers and the general public.19 The Medical Dictionary for Regulatory Activities (MedDRA) is a hierarchical coding system used by VAERS to classify AEs for efficient data retrieval.20

The dataset was downloaded from the official VAERS website in October 2024 and included all ICSRs submitted between January 1990 and September 2024. The raw dataset comprised 2,967,196 ICSRs. After removing 1,106,940 duplicate records, 1,860,256 unique ICSRs remained. Of these, 1,016,024 (54.6%) were related to COVID-19 vaccines, and 844,232 (45.4%) were associated with other vaccines (Figure 1).

Variables

To analyze oral AEs, an anatomophysiological framework was applied, categorizing AEs by anatomical regions (lips, palate, tongue, dentition, salivary glands, and oral mucosa) and functions (taste and other sensations). A MedDRA search at the preferred term (PT) level identified 128 PTs relevant to the oral cavity. This framework was described in a previous study7 and is presented in Figure 1.7

Oral AE reports were stratified by sex (female/male), age group (infants, children, young adults, middle-aged adults, pre-seniors, seniors, and elderly) according to the United States Census Bureau classification,21 clinical course (severe, hospitalized or fatal) according to the definitions provided in the VAERS user guidelines,6 vaccine type (mRNA, vector-based and protein subunit), and state-level political inclination (blue (Democratic) or red (Republican)) as indicated by the outcomes of the US 2020 presidential election.22 Lastly, to assess temporal trends, the study period was divided into pre-pandemic (1990–2019) and pandemic (2020–2024) phases.

Statistical analysis

Statistical analyses were conducted in 2 stages. The primary analysis assessed disproportionate reporting of 128 potential oral AEs to identify true SDRs by applying both the frequentist and Bayesian conditions. This resulted in the identification of 39 oral AEs as true SDRs, as they met the predefined signal detection criteria.

The frequentist criteria for identifying true SDRs were as follows:

– proportional reporting ratio (PRR) ≥2, with the lower bound of the 95% confidence interval (95% CI) ≥1;

– reporting odds ratio (ROR) ≥2, with the lower bound of the 95% CI ≥ 1;

– likelihood ratio test (LRT) ≥3.84;

χ² test with Yates’s correction ≥4;

– total number of reports >3.

The Bayesian criteria were:

– new information component (IC) method, requiring both the point estimate and the lower limit of the 95% CI for the IC (IC025) to be >0;

– Bayesian Confidence Propagation Neural Network (BCPNN) method, requiring both the point estimate and the IC025 to be >0.

A secondary (sensitivity) analysis was conducted on the 39 true SDRs to control for potential reporting biases, including selective reporting bias and notoriety bias. Disproportionality estimates were stratified by sex, age, clinical severity, vaccine type, vaccine schedule, state-level political inclination, and time period.

To examine potential notoriety bias in gustatory AEs, Cohen’s kappa coefficient was calculated to assess the agreement between gustatory and olfactory AEs, stratified by time period, sex, age, and vaccine type. Specifically, agreement coefficients were compared between pre-pandemic and pandemic periods, as well as between COVID-19 and non-COVID-19 vaccines during the pandemic. Multivariable logistic regression analyses were conducted to estimate adjusted odds ratios (AORs) for true SDRs, adjusting for sex, age, state-level political inclination, vaccine type, and time period.

All statistical analyses were conducted using the R software, v. 4.4.2 (https://www.r-project.org).23

Results

As of September 2024, VAERS contained 1,860,256 unique ICSRs, of which 56,501 reported oral AEs (30.37 cases per 1,000 ICSRs). The crude PRR of oral AEs following COVID-19 vaccination was 2.40 (95% CI: 2.35–2.44), indicating a higher reporting frequency compared with other vaccines. Females exhibited a higher PRR (2.29) than males (1.67), and younger vaccine recipients had lower PRRs than older groups. Non-severe, non-hospitalized and non-fatal cases showed higher PRRs than severe, hospitalized and fatal cases. Proportional reporting ratios were nearly identical in red and blue states (Table 1).

Primary analysis

Of the 128 oral AEs evaluated, 45 met the frequentist criteria, 50 met the Bayesian criteria, and 39 satisfied both, thereby qualifying as true SDRs. These SDRs were distributed across tongue (= 9), oral mucosa (= 9), lips (= 6), taste (= 4), other sensations (= 4), dentition (= 4), salivary glands (= 2), and palate (= 1).

Within taste-related AEs, taste disorder showed the highest PRR (23.96), followed by ageusia (17.79), hypogeusia (6.25) and dysgeusia (3.22). Other sensory AEs also exhibited high PRRs, including oral anesthesia (16.62), burning mouth syndrome (4.67), oral paresthesia (3.72), and oral hypoesthesia (3.50).

For oral mucosal AEs, aphthous ulcer (4.43), oral lichen planus (3.12) and oral pruritus (2.65) were identified as true SDRs. In contrast, oral herpes (1.51) and oral candidiasis (1.39) did not meet the criteria for true SDRs (Table 2).

Sensitivity analyses

Sex

The frequentist criteria identified 38 true SDRs in females and 21 in males, while the Bayesian criteria identi­fied 39 true SDRs in females and 38 in males. Twenty-one SDRs were confirmed by both methods across both sexes.

Taste disorder had the highest PRR in both females (19.23) and males (28.06). In females, this was followed by dental paresthesia (18.30) and ageusia (15.97), while in males, tongue erythema (23.04) and ageusia (17.25) were the most prominent (Supplementary File: Table S1 (https://doi.org/10.17605/OSF.IO/3S8KW)).

Age

Infants and toddlers (0–4 years) showed only 1 true SDR (oral hypoesthesia (PRR: 26.77)), while children and adolescents (5–17 years) had 4 true SDRs, namely taste disorder (20.71), ageusia (11.10), aphthous ulcer (9.53), and mouth swelling (3.71).

Young adults (18–34 years) exhibited 6 true SDRs: taste disorder (27.72); ageusia (11.34); tongue discomfort (5.87); tongue pruritus (5.66); mouth swelling (2.83); and oral paresthesia (2.14). Similarly, middle-aged adults (35–49 years) showed 7 true SDRs, such as taste disorder (14.46), ageusia (9.50), tongue discomfort (5.48), tongue pruritus (4.82), mouth swelling (4.37), toothache (3.05), and oral paresthesia (2.08). Moreover, pre-seniors (50–64 years) had 8 true SDRs: taste disorder (12.86); ageusia (11.72); tongue discomfort (5.46); tongue pruritus (5.19); oral paresthesia (2.34); dysgeusia (2.31); oral hypoesthesia (2.21); and oral discomfort (2.03).

Seniors (65–79 years) had 4 true SDRs, namely taste disorder (11.52), ageusia (10.43), tongue discomfort (4.99), and oral paresthesia (2.13), whereas ageusia (7.54) was the only true SDR identified among individuals aged ≥80 years (Supplementary File: Table S2).

Clinical course

Severe cases had 8 true SDRs, while non-severe cases showed 30 true SDRs. Six SDRs were shared between both groups, including ageusia (severe (PRR: 10.04) vs. non-severe PRR: 22.38)), hypogeusia (6.81 vs. 6.49), taste disorder (31.94 vs. 21.12), tongue discomfort (5.12 vs. 8.81), tongue pruritus (3.61 vs. 6.59), and mouth swelling (2.28 vs. 3.48) (Supplementary File: Table S3).

Hospitalized cases showed only 2 true SDRs, compared with 34 among non-hospitalized cases. Both hospitalized and non-hospitalized cases had jointly 2 true SDRs, including ageusia (hospitalized (PRR: 11.73) vs. non-hospitalized (PRR: 18.30)) and taste disorder (9.65 vs. 25.40, respectively) (Supplementary File: Table S4).

Mortality cases showed no true SDRs, while non-mortality cases exhibited 36 true SDRs. Among fatal cases, the Bayesian criteria were not met by any oral AE, while the frequentist conditions were met by ageusia only (PRR: 7.81) (Supplementary File: Table S5).

Vaccine schedule

Primary COVID-19 vaccination doses were associated with 35 true SDRs, while booster doses showed 10 true SDRs. Nine SDRs were shared between both schedules, including ageusia (primer (PRR: 17.79) vs. booster (PRR: 17.68)), hypogeusia (6.20 vs. 7.47), taste disorder (24.37 vs. 14.14), toothache (3.21 vs. 3.79), tongue blistering (2.73 vs. 3.26), tongue erythema (7.95 vs. 6.49), lip pain (2.45 vs. 2.24), aphthous ulcer (4.45 vs. 3.82), and mouth swelling (3.51 vs. 3.43) (Supplementary File: Table S6).

Vaccine type

The mRNA-based and viral vector-based COVID-19 vaccines exhibited 35 and 25 true SDRs, respectively, whereas protein subunit vaccines showed 6 true SDRs, as follows: ageusia (PRR: 18.74); taste disorder (14.93); glossodynia (4.53); dry mouth (4.21); dysgeusia (4.09); and oral paresthesia (2.31).

Among mRNA-based vaccines, taste disorder had the highest PRR (23.77), followed by ageusia (17.58), oral anesthesia (16.13), dental discomfort (15.23), dental paresthesia (12.54), hyperesthesia of teeth (11.85), tongue discomfort (9.11), tongue erythema (8.01), tongue pruritus (6.87), and hypogeusia (6.13). Similarly, for viral vector-based vaccines, taste disorder came first (26.07), followed by oral anesthesia (22.28), ageusia (20.55), den­tal paresthesia (16.71), dental discomfort (13.92), and hyperesthesia of teeth (10.28). When evaluating influenza vaccines, no true SDRs were found (Supplementary File: Table S7).

State-level political inclination

Blue (Democratic) states exhibited 30 true SDRs, and red (Republican) states showed 25 true SDRs. Both types of states shared 25 true SDRs, including taste disorder (blue (PRR: 23.20) vs. red (PRR: 25.22)), ageusia (17.27 vs. 20.56), hypogeusia (9.06 vs. 4.51), dysgeusia (3.11 vs. 3.30), oral paresthesia (3.72 vs. 3.56), oral hypoesthesia (3.57 vs. 3.32), and aphthous ulcer (4.71 vs. 4.38). Five AEs were unique to blue states: dental discomfort; dry tongue; tongue eruption; lip disorder; and palatal swelling (Supplementary File: Table S8).

Co-occurrence of chemosensory AEs

Overall, gustatory and olfactory AEs co-occurred with a Cohen’s kappa (κ) of 0.459, indicating moderate agreement. The strongest agreement was observed for ageusia and anosmia (κ = 0.699), followed by hypogeusia and hyposmia (κ = 0.399), and taste disorder and parosmia (κ = 0.258) (Supplementary File: Table S9).

For non-COVID-19 vaccines, a considerable difference was observed between the pre-pandemic (January 1990–December 2019) and pandemic (January 2020–October 2024) intervals. The co-occurrence of any gustatory AE and any olfactory AE was slight in the pre-pandemic period (κ = 0.115) but moderate in the pandemic period (κ = 0.500). Ageusia and anosmia exhibited fair agreement in the pre-pandemic period (κ = 0.283), but substantial agreement was noted between the two in the pandemic interval (κ = 0.721). Similarly, hypogeusia and hyposmia showed no agreement pre-pandemic (κ < 0.001), and moderate agreement in the pandemic period (κ = 0.474).

During the pandemic, the co-occurrence of chemo­sensory AEs was moderate for both non-COVID-19 (κ = 0.500) and COVID-19 vaccines (κ = 0.489). Ageusia and anosmia exhibited substantial agreement for non-COVID-19 (κ = 0.721) and COVID-19 vaccines (κ = 0.710). Similarly, hypogeusia and hyposmia showed moderate agreement for non-COVID-19 (κ = 0.474) and COVID-19 vaccines (κ = 0.438) (Figure 2).

Google Trends and VAERS reports

A non-parametric correlation analysis was performed between the weekly search volume of keywords (taste loss, ageusia and dysgeusia) in Google Trends (https://trends.google.com/trends) and the weekly number of gustatory AE reports in VAERS (taste disorder, ageusia, dysgeusia, and hypogeusia). Spearman’s rho coefficient was 33.3% during the pandemic period preceding the COVID-19 vaccine rollout, and increased to 75.0% following the public administration of COVID-19 vaccines on December 14, 2020 (Figure 3).

Regression analyses

Binary logistic regression models were constructed for each true SDR, using sex (female vs. male), age (per year increase), state (red vs. blue), and vaccine type (COVID-19 vaccines vs. non-COVID-19 vaccines) as predictors to calculate adjusted odds ratios (AORs) with 95% CIs (Table 3).

Females had significantly higher odds for 32 SDRs, while no SDRs were more prevalent in males. Notably, elevated risks in females were observed for dysgeusia (AOR = 2.056 (1.921–2.199)), ageusia (AOR = 1.094 (1.032–1.160)), taste disorder (AOR = 1.464 (1.333–1.609)), oral paresthesia (AOR = 3.742 (3.485–4.019)), oral hypoesthesia (AOR = 2.433 (2.266–2.612)), dry mouth (AOR = 1.514 (1.387–1.653)), aphthous ulcer (AOR = 1.674 (1.330–2.108)), and oral lichen planus (AOR = 2.708 (1.211–6.055)), among others (Figure 4A).

Increasing age was associated with higher odds for 27 SDRs. For each additional year of age, the probability of developing coating in the mouth increased by 3.4% (1.2–5.7%), burning mouth syndrome by 2.6% (1.0–4.1%), oral lichen planus by 2.4% (0.9–4.0%), and tongue erythema by 2.2% (1.3–3.0%). These findings suggest a cumulative effect of age, where the likelihood of developing these SDRs progressively increases over time (Figure 4B).

State-level political inclination was not statistically significant for 36 SDRs. However, 3 SDRs showed significant variation: tongue blistering and ageusia were more prevalent in red states, whereas oral paresthesia was more common in blue states (Figure 4C).

For 38 SDRs, odds were significantly higher for COVID-19 vaccines compared with other vaccines, except for coating in the mouth (Figure 4D).

After adding time period to the models, sex-, age- or state-based associations remained stable, while some vaccine-based associations lost statistical significance, including oral anesthesia, burning mouth syndrome and oral lichen planus, among others. The pandemic period was associated with increased odds for 19 SDRs, including taste disorder, ageusia, oral paresthesia, and aphthous ulcer (Table 4).

Discussion

Key findings

The disproportionality analysis demonstrated that oral AEs were reported 2.40 times more frequently following COVID-19 vaccination than after all other vaccines in the VAERS database. Females and older adults exhibited higher PRRs, whereas severe, hospitalized and fatal cases showed substantially lower PRRs. Among the 39 true SDRs, taste-related AEs showed the highest PRRs, including taste disorder (23.96), ageusia (17.79), hypogeusia (6.25), and dysgeusia (3.22), alongside other sensory SDRs such as oral paresthesia (3.72) and oral hypoesthesia (3.50).

Sensitivity analyses confirmed that females exhibited a greater number of SDRs (32/39) than males (21/39). Middle-aged adults showed the highest number of true SDRs, whereas children (<5 years) and the elderly (≥80 years) exhibited the fewest. Non-severe (30/39), non-hospitalized (34/39) and non-fatal (36/39) cases accounted for substantially more SDRs than severe (8/39), hospitalized (2/39) and fatal cases (0/39). The mRNA-based (35/39) and viral vector-based (25/39) vaccines were associated with more SDRs than protein subunit COVID-19 vaccines (6/39) and influenza vaccines (0/39). Co-occurrence analyses demonstrated moderate agreement between gustatory and olfactory AEs (κ = 0.459), which increased for non-COVID-19 vaccines during the pandemic (κ = 0.500) compared with the pre-pandemic period (κ = 0.115). This pattern suggests the presence of notoriety bias rather than a causal association with COVID-19 vaccines.

Regression analyses confirmed that female sex was associated with significantly higher odds for 32 true SDRs, and that increasing age was associated with a higher probability of developing 27 SDRs. State-level political inclination had no significant influence on SDR reporting, except for 3 SDRs. The inclusion of time period as a predictor did not alter sex-, age- or state-based associations, indicating that notoriety bias did not substantially affect these patterns. However, adjustment for time attenuated the associations for several SDRs, particularly burning mouth syndrome, oral anesthesia and oral lichen planus, suggesting that reporting trends influenced the strength of association for certain AEs over time.

Sex- and age-related disparities

The higher susceptibility of females to reporting oral AEs following COVID-19 vaccination aligns with previous pharmacovigilance studies involving other organ systems.24 Disproportionality analyses using the WHO VigiBase database have consistently shown that females are at least twice as likely to report autoimmune,25 neurologic26, 27 and cutaneous AEs28, 29 following COVID-19 vaccination.25, 26, 27, 28, 29 This sex disparity may be attributed to both biological and behavioral factors.30 Sex hormones, particularly estrogen, enhance immune responses and contribute to greater reactogenicity, while chromosomal differences further modulate immune function.31 Additionally, higher baseline prevalence of certain conditions in females, coupled with increased health-seeking and reporting behaviors, may amplify these disparities.30

The observed age-related patterns are consistent with prior analyses indicating that adults, especially middle-aged individuals, are more susceptible to AEs following COVID-19 vaccination than minors (≤18 years) and seniors (≥64 years).25, 32, 33 Increase in AE reporting with age has been documented for conditions such as herpes zoster, myocardial infarction and circulatory collapse.28, 34 In contrast, some studies have identified a reversed pat­tern, where certain AEs, including myocarditis/pericarditis, thrombosis/thrombocytopenia, and anaphylaxis were more frequently reported in younger populations, while others found no significant age-related differences.35, 36, 37, 38, 39, 40

State-level political inclination

Political preferences have been shown to influence perceptions of vaccine safety.3, 41, 42, 43 A recent US cross-sectional study reported that while vaccinated individu­als across political groups experienced similar AEs, Republicans were more likely to perceive these events as severe, report higher rates of negative reactions among their social circles, and discourage others from vaccination.41 The study highlights the role of political ideology in shaping vaccine perceptions even among the vaccinated.41 Consistently, Asch et  al. performed a disproportionality analysis of COVID-19 vaccine AEs in VAERS, revealing that a 10% increase in Republican voting was associated with a 5% rise in overall AE reporting, a 25% increase in severe AE reports, and a 21% higher likelihood that any reported AE was classified as severe.42 Moreover, partisan divisions over COVID-19 vaccines are speculated to erode public support for other vaccination programs, including childhood immunization mandates.43 Media politicization may further reinforce these trends, as right-leaning outlets were more likely to emphasize the risks of COVID-19 vaccine-associated myocarditis (CVM) without contextualizing its rarity or comparing it to the risks of myocarditis from SARS-CoV-2 infection, whereas left-leaning media were highlighting the benefits of vaccination and provided numerical risk estimates to contextualize CVM concerns.3 In the present analysis, state-level political inclination was used as a proxy for political orientation, as previously described.42 No strong association was noted between politi­cal affiliation and oral AE reporting patterns.42

Vaccine schedule and type

Primary vaccination doses were associated with higher AE reporting rates than booster doses, which is consistent with previous evidence of greater reactogenicity among dose-naïve individuals.17, 44 The mRNA vaccines exhibited more SDRs than vector-based or protein subunit vaccines, which aligns with previous reports highlighting greater reactogenicity of mRNA platforms.45, 46

Are taste-related AEs a manifestation of notoriety bias?

The strong association between chemosensory disorders, particularly gustatory and olfactory dysfunction, and the SARS-CoV-2 infection may have increased public vigilance of these symptoms due to their diagnostic and prognostic relevance.13, 14, 15 As a result, sporadic cases of gustatory and olfactory dysfunction following COVID-19 vaccination have been reported.16, 47 In response to this heightened suspicion, active surveillance studies funded by the European Medicines Agency (EMA), including SAFETY–VAC, COVID-19 Vaccine Monitor (CVM), and Early COVID-19 Vaccine Monitor (ECVM), included anosmia and ageusia among their AEs of interest.48, 49 Surprisingly, evidence from these cohort studies indicated that the observed rates of anosmia and ageusia decreased following COVID-19 vaccination compared to the background rates, which had been severely elevated during the COVID-19 pandemic.50, 51, 52

In passive surveillance databases, chemosensory AEs were increasingly reported following COVID-19 vaccination, raising alternative hypotheses beyond a direct causal link to the vaccine, including coincidental or breakthrough infection.7, 8, 9 Both scenarios may be influenced by notoriety bias. Our findings partially support the notoriety bias hypotheses, as we observed a weak co-occurrence of gustatory and olfactory AEs before COVID-19, which became more pronounced during the pandemic for both COVID-19 and non-COVID-19 vaccines. Also, the crude reporting rate of taste-related AEs increased several-fold during the pandemic.7 Furthermore, the strengthened correlation between Google search activity and VAERS reporting after vaccine rollout was observed.

Strengths

The present study has several strengths. The hybrid analytical approach employed is strongly recommended, as no single data-mining method is inherently superior; therefore, combining multiple approaches is essential for identifying the most reliable SDRs.4, 53 Additionally, comprehensive stratification and sensitivity analyses across sex, age, clinical course, political inclination, vaccine type, and time period offer deeper insights into oral AE patterns and help identify potential reporting biases.4 The suspected notoriety bias associated with taste-related AEs was investigated using an innovative framework that incorporated stratified co-occurrence analysis and real-time digital search data. Moreover, this study is among the few to examine the role of political determinants in AE reporting.42

Limitations

This study has several limitations. First, reliance on passive surveillance data from VAERS is subject to inherent biases, including underreporting, overreporting and the inability to establish causal relationships between vaccines and reported AEs.12 As with all disproportionality analyses, causality cannot be inferred from statistical associations alone. Second, while the hybrid frequentist–Bayesian approach enhances the robustness of signal detection, disproportionality analysis alone cannot determine the clinical relevance or biological mechanisms underlying observed SDRs.5 Third, state-level political inclination was used as a proxy for individual political preferences, which may not fully capture the complexity of political influences on AE reporting.42 Finally, Google Trends data was utilized as an external indicator of notoriety bias. However, extensive media coverage and heightened public awareness, especially during the pandemic, may have contributed to the overestimation of certain SDRs, especially taste-related AEs.

Conclusions

The findings of the present study underscore the need for granular evaluation of clinically relevant oral SDRs, such as oral lichen planus, using self-controlled case-series methodologies to validate them as true safety signals.54 Given the potential role of notoriety bias in chemo­sensory AE reporting, future disproportionality analyses should incorporate sensitivity analyses and innovative analytical approaches to minimize its impact. Furthermore, as most oral AEs were strongly associated with favorable clinical outcomes (non-severe, non-hospitalized and non-fatal), an important public health message emerges: although oral AEs following COVID-19 vaccination may occur, they should not be perceived as life-threatening or abused by antivaccine propaganda to undermine public confidence in vaccine safety.

Ethics approval and consent to participate

Not applicable.

Data availability

Publicly available datasets were analyzed in this study. This data can be found at https://vaers.hhs.gov/data/datasets.html. The datasets supporting the findings of the current study are openly available in the Open Science Framework (OSF) at https://doi.org/10.17605/OSF.IO/3S8KW.

Consent for publication

Not applicable.

Use of AI and AI-assisted technologies

Generative AI was used in the preparation of the man­uscript. Specifically, ChatGPT (v. 4; OpenAI, San Francisco, USA) was employed for proofreading and language refinement. This tool was used solely to improve grammar and readability. All substantive content was independently developed by the authors.

Tables


Table 1. Frequency and reporting ratios of oral adverse events (AEs) across demographic and clinical subgroups in the United States

Variable

ICSRs, n (%)

Oral AEs, n (rate per 1,000 ICSRs)

Frequentist

Bayesian

PRR
(95% CI)

ROR
(95% CI)

χ2 test statistic

IC (lower bound of the 95% CI)

Sex

female

1,102,436 (59.26)

42,740 (38.77)

2.29 (2.24–2.35)

2.36 (2.31–2.42)

5,830.65

1.15 (1.08)

male

594,129 (31.94)

12,541 (21.11)

1.67 (1.61–1.73)

1.69 (1.63–1.75)

764.71

1.15 (0.98)

unknown

163,691 (8.80)

1,220 (7.45)

6.21 (5.50–7.00)

6.31 (5.59–7.13)

1,148.69

3.30 (2.36)

Age group

infants

149,920 (8.06)

1,238 (8.26)

0.78 (0.56–1.10)

0.78 (0.55–1.10)

1.96

3.81 (2.79)

children

185,715 (9.98)

2,292 (12.34)

0.89 (0.81–0.98)

0.89 (0.81–0.98)

5.72

1.80 (1.26)

young adults

252,743 (13.59)

8,054 (31.87)

1.64 (1.57–1.72)

1.67 (1.59–1.75)

417.43

0.94 (0.76)

middle-aged adults

276,014 (14.84)

13,884 (50.30)

1.59 (1.52–1.65)

1.62 (1.55–1.69)

466.80

0.58 (0.47)

pre-seniors

332,348 (17.87)

15,557 (46.81)

1.77 (1.70–1.84)

1.81 (1.74–1.89)

878.99

0.74 (0.64)

seniors

309,914 (16.66)

10,106 (32.61)

1.66 (1.59–1.74)

1.69 (1.61–1.77)

497.84

0.81 (0.65)

elderly

86,378 (4.64)

1,650 (19.10)

1.12 (1.00–1.25)

1.12 (1.00–1.25)

3.57

0.47 (−0.04)

unknown

267,224 (14.36)

3,720 (13.92)

4.52 (4.20–4.86)

4.61 (4.29–4.97)

1,980.13

2.29 (1.90)

Severity

severe

320,852 (17.25)

7,629 (23.78)

0.79 (0.75–0.83)

0.78 (0.74–0.82)

92.15

1.35 (1.13)

non-severe

1,539,404 (82.75)

48,872 (31.75)

3.04 (2.97–3.11)

3.14 (3.06–3.21)

10,448.42

1.22 (1.15)

Mortality

fatal

24,675 (1.33)

167 (6.77)

0.93 (0.65–1.32)

0.93 (0.65–1.32)

0.07

0.34 (−2.28)

non-fatal

1,835,581 (98.67)

56,334 (30.69)

2.42 (2.38–2.47)

2.49 (2.44–2.53)

9301.76

1.33 (1.26)

Hospitalization

hospitalized

131,117 (7.05)

2,751 (20.98)

0.73 (0.68–0.79)

0.73 (0.67–0.79)

64.05

0.38 (0.01)

not hospitalized

1,729,139 (92.95)

53,750 (31.08)

2.59 (2.54–2.64)

2.66 (2.61–2.71)

10,161.07

1.39 (1.32)

ER visit

visited ER

186,794 (10.04)

4,868 (26.06)

2.50 (1.35–4.63)

2.60 (1.35–5.03)

6.06

3.39 (−4.92)

did not visit ER

1,673,462 (89.96)

51,633 (30.85)

2.80 (2.74–2.86)

2.88 (2.82–2.94)

9,408.82

1.14 (1.07)

Life threat

life-threatening

25,714 (1.38)

1,135 (44.14)

0.92 (0.82–1.03)

0.91 (0.81–1.03)

2.10

0.70 (0.29)

non-life-threatening

1,834,542 (98.62)

55,366 (30.18)

2.45 (2.40–2.49)

2.51 (2.46–2.56)

9,251.78

1.33 (1.26)

Political inclination

red state

597,166 (32.10)

19,189 (32.13)

2.41 (2.33–2.48)

2.47 (2.39–2.55)

3,229.49

1.39 (1.28)

blue state

969,667 (52.13)

31,424 (32.41)

2.40 (2.34–2.46)

2.46 (2.40–2.53)

5,107.13

1.33 (1.24)

other (not specified)

293,423 (15.77)

5,888 (20.07)

2.80 (2.63–2.99)

2.85 (2.67–3.05)

1,072.24

1.15 (0.89)

Total

1,860,256 (100.00)

56,501 (30.37)

2.40 (2.35–2.44)

2.46 (2.41–2.50)

9,058.75

1.32 (1.25)

The Bayesian Confidence Propagation Neural Network (BCPNN) method was used to calculate the information component (IC) and its lower bound of the 95% confidence interval (95% CI).
ER – emergency room; ICSR – individual case safety report; PRR – proportional reporting ratio; ROR – reporting odds ratio.
Table 2. Frequentist and Bayesian analyses of oral adverse events (AEs) reported following coronavirus disease 2019 (COVID-19) vaccination in the United
States (as of September 2024)

AE category

Preferred term
(MedDRA number)

ARR (per 1,000 reports following COVID-19 vaccination)

Frequentist

Frequentist

Bayesian

SDR (frequentist and Bayesian)

PRR (95% CI)

ROR (95% CI)

LRT

χ2

SDR

new IC (IC025)

BCPNN (IC025)

SDR

Taste

ageusia (10001480)

6.11

17.79 (15.81–20.01)

17.89 (15.91–20.13)

5,613.85

4,404.14

yes

0.81 (1.71)

0.81 (0.77)

yes

yes

dysgeusia (10013911)

5.07

3.22 (3.03–3.42)

3.23 (3.04–3.44)

1,763.76

1,624.72

yes

0.54 (1.42)

0.54 (0.51)

yes

yes

hypogeusia (10020989)

0.19

6.25 (4.12–9.48)

6.25 (4.12–9.49)

112.86

95.94

yes

0.69 (1.39)

0.69 (0.50)

yes

yes

taste disorder (10082490)

2.58

23.96 (19.44–29.53)

24.02 (19.49–29.60)

2,523.77

1,936.15

yes

0.82 (1.70)

0.82 (0.77)

yes

yes

Other sensory AEs

anesthesia oral (10082548)

0.02

16.62 (2.23–123.83)

16.62 (2.23–123.83)

17.73

12.39

yes

0.78 (1.05)

0.80 (0.19)

yes

yes

burn oral cavity (10075532)

0.01

1.87 (0.58–6.07)

1.87 (0.58–6.07)

1.16

0.61

no

0.32 (0.59)

0.34 (–0.51)

no

no

burning mouth syndrome (10068065)

0.04

4.67 (2.20–9.91)

4.67 (2.20–9.92)

22.09

18.41

yes

0.63 (1.13)

0.64 (0.24)

yes

yes

hypoesthesia oral (10057371)

4.97

3.50 (3.29–3.73)

3.51 (3.30–3.74)

1,896.22

1,732.77

yes

0.57 (1.44)

0.57 (0.53)

yes

yes

oral dysesthesia (10050820)

0.004

1.11 (0.25–4.95)

1.11 (0.25–4.95)

0.02

0.00

no

0.06 (0.31)

0.07 (–1.16)

no

no

paresthesia oral (10057372)

6.72

3.72 (3.52–3.93)

3.73 (3.53–3.95)

2,735.32

2,485.39

yes

0.58 (1.46)

0.58 (0.55)

yes

yes

Dentition1

dental discomfort (10054217)

0.07

15.16 (5.54–41.49)

15.17 (5.54–41.49)

63.18

48.57

yes

0.79 (1.36)

0.80 (0.48)

yes

yes

dental paresthesia (10078276)

0.03

12.88 (3.08–53.81)

12.88 (3.08–53.82)

25.57

19.03

yes

0.77 (1.16)

0.78 (0.29)

yes

yes

hyperesthesia teeth (10082426)

0.18

11.76 (6.70–20.64)

11.76 (6.70–20.64)

147.33

118.00

yes

0.77 (1.47)

0.77 (0.57)

yes

yes

hypoesthesia teeth (10051780)

0.01

5.82 (1.32–25.59)

5.82 (1.32–25.59)

8.04

5.72

yes

0.65 (0.87)

0.68 (−0.04)

no

no

toothache (10044055)

1.19

3.23 (2.86–3.66)

3.24 (2.86–3.66)

415.90

382.15

yes

0.54 (1.38)

0.54 (0.47)

yes

yes

Salivary glands and saliva2

aptyalism (10003068)

0.04

4.63 (2.07–10.35)

4.63 (2.07–10.35)

19.00

15.69

yes

0.62 (1.10)

0.63 (0.21)

yes

yes

dry mouth (10013781)

2.43

2.65 (2.44–2.87)

2.65 (2.44–2.87)

642.99

602.86

yes

0.48 (1.34)

0.48 (0.43)

yes

yes

non-infective sialoadenitis (10075243)

0.01

3.12 (1.03–9.39)

3.12 (1.03–9.39)

4.91

3.61

no

0.51 (0.81)

0.53 (−0.15)

no

no

saliva altered (10039379)

0.02

1.74 (0.85–3.56)

1.74 (0.85–3.56)

2.40

1.83

no

0.30 (0.79)

0.31 (−0.22)

no

no

saliva discoloration (10049069)

0.01

1.16 (0.37–3.67)

1.16 (0.37–3.67)

0.07

0.00

no

0.09 (0.44)

0.09 (−0.84)

no

no

salivary gland calculus (10039394)

0.00

3.32 (0.37–29.74)

3.32 (0.37–29.74)

1.41

0.48

no

0.48 (0.42)

0.55 (−0.76)

no

no

salivary gland disorder (10061935)

0.02

3.32 (1.11–9.94)

3.32 (1.11–9.94)

5.66

4.23

yes

0.53 (0.83)

0.55 (−0.11)

no

no

salivary gland enlargement (10039408)

0.05

0.70 (0.49–1.01)

0.70 (0.49–1.01)

3.71

3.38

no

−0.26 (0.63)

−0.26 (−0.58)

no

no

salivary gland pain (10039421)

0.03

1.50 (0.80–2.81)

1.50 (0.80–2.81)

1.61

1.22

no

0.23 (0.78)

0.24 (−0.25)

no

no

salivary hypersecretion (10039424)

0.29

0.51 (0.44–0.59)

0.51 (0.44–0.59)

88.87

88.37

no

−0.53 (0.62)

−0.53 (−0.66)

no

no

sialoadenitis (10040628)

0.03

0.14 (0.10–0.20)

0.14 (0.10–0.20)

165.73

152.35

no

−1.91 (0.19)

−1.92 (−2.28)

no

no

Tongue3

glossitis (10018386)

0.16

1.44 (1.11–1.87)

1.44 (1.11–1.87)

7.98

7.49

no

0.22 (0.99)

0.22 (0.02)

yes

no

glossodynia (10018388)

0.63

2.22 (1.92–2.58)

2.22 (1.92–2.58)

123.31

116.82

yes

0.41 (1.23)

0.41 (0.31)

yes

yes

hypertrophy of tongue papillae (10020893)

0.01

3.05 (0.85–10.92)

3.05 (0.85–10.92)

3.50

2.35

no

0.50 (0.72)

0.52 (−0.27)

no

no

macroglossia (10025391)

0.001

1.66 (0.15–18.33)

1.66 (0.15–18.33)

0.18

0.00

no

0.23 (0.19)

0.29 (−1.50)

no

no

plicated tongue (10035630)

0.01

1.83 (0.64–5.26)

1.83 (0.64–5.26)

1.33

0.78

no

0.32 (0.63)

0.33 (−0.44)

no

no

strawberry tongue (10051495)

0.01

0.64 (0.28–1.46)

0.64 (0.28–1.46)

1.15

0.75

no

−0.31 (0.39)

−0.33 (−1.07)

no

no

stiff tongue (10081491)

0.01

9.14 (1.18–70.80)

9.14 (1.18–70.80)

8.00

5.24

yes

0.71 (0.83)

0.75 (−0.07)

no

no

swollen tongue (10042727)

4.68

2.36 (2.23–2.50)

2.37 (2.24–2.50)

1,025.91

972.37

yes

0.44 (1.32)

0.44 (0.40)

yes

yes

tongue blistering (10043942)

0.17

2.75 (2.01–3.77)

2.75 (2.01–3.77)

46.77

42.86

yes

0.49 (1.20)

0.49 (0.29)

yes

yes

tongue coated (10043945)

0.05

1.90 (1.14–3.17)

1.90 (1.14–3.17)

6.44

5.63

no

0.34 (0.94)

0.35 (−0.02)

no

no

tongue discoloration (10043949)

0.21

1.64 (1.30–2.06)

1.64 (1.30–2.06)

18.47

17.55

no

0.28 (1.06)

0.28 (0.11)

yes

no

tongue disorder (10043951)

0.58

1.09 (0.97–1.24)

1.10 (0.97–1.24)

2.11

2.02

no

0.06 (0.96)

0.06 (−0.04)

no

no

tongue discomfort (10077855)

0.65

9.06 (6.97–11.77)

9.06 (6.97–11.78)

482.07

399.22

yes

0.75 (1.55)

0.75 (0.64)

yes

yes

tongue dry (10049713)

0.09

4.20 (2.57–6.87)

4.20 (2.57–6.87)

43.06

37.49

yes

0.61 (1.24)

0.61 (0.34)

yes

yes

tongue eruption (10052002)

0.08

2.98 (1.89–4.68)

2.98 (1.89–4.68)

26.54

23.70

yes

0.51 (1.14)

0.52 (0.24)

yes

yes

tongue erythema (10079075)

0.15

7.89 (4.72–13.21)

7.89 (4.72–13.21)

103.48

85.72

yes

0.73 (1.40)

0.73 (0.51)

yes

yes

tongue exfoliation (10064488)

0.01

1.31 (0.51–3.37)

1.31 (0.51–3.37)

0.31

0.10

no

0.15 (0.57)

0.16 (−0.59)

no

no

tongue movement disturbance (10043963)

0.06

2.88 (1.68–4.95)

2.88 (1.68–4.95)

17.44

15.33

yes

0.50 (1.08)

0.51 (0.17)

yes

yes

tongue edema (10043967)

0.04

0.07 (0.05–0.10)

0.07 (0.05–0.10)

528.48

464.43

no

−2.77 (0.11)

−2.78 (−3.10)

no

no

tongue paralysis (10043972)

0.03

0.80 (0.49–1.33)

0.80 (0.49–1.33)

0.72

0.53

no

−0.15 (0.61)

−0.15 (−0.59)

no

no

tongue pigmentation (10069164)

0.004

3.32 (0.37–29.74)

3.32 (0.37–29.74)

1.41

0.48

no

0.48 (0.42)

0.55 (−0.76)

no

no

tongue pruritus (10070072)

0.50

6.62 (5.11–8.59)

6.62 (5.11–8.59)

316.74

270.08

yes

0.70 (1.49)

0.70 (0.58)

yes

yes

tongue rough (10043977)

0.01

5.82 (1.32–25.59)

5.82 (1.32–25.59)

8.04

5.72

yes

0.65 (0.87)

0.68 (−0.04)

no

no

tongue spasm (10043981)

0.01

1.78 (0.73–4.37)

1.78 (0.73–4.37)

1.68

1.13

no

0.31 (0.70)

0.32 (−0.34)

no

no

tongue thrust (10082545)

0.002

0.83 (0.12–5.90)

0.83 (0.12–5.90)

0.03

0.00

no

−0.10 (0.15)

−0.13 (−1.82)

no

no

tongue ulceration (10043991)

0.15

1.76 (1.32–2.33)

1.76 (1.32–2.33)

16.14

15.14

no

0.31 (1.05)

0.31 (0.11)

yes

no

trichoglossia (10080276)

0.01

8.31 (1.06–64.91)

8.31 (1.06–64.91)

6.97

4.47

yes

0.69 (0.79)

0.74 (−0.12)

no

no

Lips4

angular cheilitis (10002509)

0.02

3.05 (1.24–7.51)

3.05 (1.24–7.51)

7.00

5.55

yes

0.51 (0.90)

0.52 (−0.03)

no

no

cheilitis (10008417)

0.33

1.40 (1.17–1.67)

1.40 (1.17–1.67)

14.25

13.72

no

0.20 (1.03)

0.20 (0.06)

yes

no

chapped lips (10049047)

0.25

2.06 (1.64–2.60)

2.07 (1.64–2.60)

41.25

38.89

yes

0.38 (1.15)

0.38 (0.22)

yes

yes

lip blister (10049307)

0.32

1.43 (1.20–1.72)

1.43 (1.20–1.72)

16.09

15.48

no

0.21 (1.04)

0.21 (0.07)

yes

no

lip discoloration (10024549)

0.12

1.37 (1.02–1.84)

1.37 (1.02–1.84)

4.46

4.10

no

0.19 (0.94)

0.19 (−0.04)

no

no

lip disorder (10048470)

0.14

3.65 (2.50–5.33)

3.65 (2.50–5.33)

56.85

50.67

yes

0.57 (1.26)

0.58 (0.36)

yes

yes

lip dry (10024552)

0.22

2.38 (1.84–3.07)

2.38 (1.84–3.07)

48.57

45.25

yes

0.44 (1.18)

0.44 (0.27)

yes

yes

lip erythema (10080124)

0.17

3.25 (2.32–4.54)

3.25 (2.32–4.54)

57.80

52.22

yes

0.54 (1.24)

0.54 (0.34)

yes

yes

lip exfoliation (10064482)

0.07

1.35 (0.93–1.98)

1.35 (0.93–1.98)

2.48

2.16

no

0.18 (0.88)

0.18 (−0.12)

no

no

lip edema (10024558)

0.06

0.86 (0.61–1.21)

0.86 (0.61–1.21)

0.76

0.61

no

−0.10 (0.72)

−0.11 (−0.40)

no

no

lip pain (10024561)

0.30

2.44 (1.95–3.06)

2.44 (1.95–3.06)

68.69

64.14

yes

0.45 (1.22)

0.45 (0.30)

yes

yes

lip pruritus (10070721)

0.39

4.17 (3.27–5.30)

4.17 (3.27–5.30)

176.39

157.29

yes

0.61 (1.38)

0.61 (0.48)

yes

yes

lip scab (10082767)

0.01

5.82 (0.72–47.28)

5.82 (0.72–47.28)

4.02

2.29

no

0.62 (0.64)

0.68 (−0.33)

no

no

lip swelling (10024570)

5.64

1.56 (1.50–1.63)

1.57 (1.50–1.64)

414.45

405.24

no

0.26 (1.16)

0.26 (0.22)

yes

no

lip ulceration (10024572)

0.03

0.92 (0.55–1.53)

0.92 (0.55–1.53)

0.10

0.04

no

−0.06 (0.66)

−0.06 (−0.49)

no

no

Palate5

palatal disorder (10052453)

0.02

1.22 (0.63–2.35)

1.22 (0.63–2.35)

0.35

0.18

no

0.12 (0.68)

0.12 (−0.41)

no

no

palatal edema (10056998)

0.01

0.65 (0.32–1.30)

0.65 (0.32–1.30)

1.52

1.12

no

−0.31 (0.45)

−0.32 (−0.95)

no

no

palatal swelling (10074403)

0.09

4.35 (2.59–7.31)

4.35 (2.59–7.31)

41.18

35.65

yes

0.62 (1.23)

0.62 (0.34)

yes

yes

palatal ulcer (10077519)

0.004

1.66 (0.30–9.07)

1.66 (0.30–9.07)

0.36

0.03

no

0.25 (0.36)

0.29 (−0.98)

no

no

Oral mucosa6

aphthous ulcer (10002959)

0.40

4.43 (3.47–5.66)

4.43 (3.47–5.66)

190.27

168.67

yes

0.62 (1.39)

0.62 (0.49)

yes

yes

circumoral edema (10052250)

0.01

1.83 (0.64–5.26)

1.83 (0.64–5.26)

1.33

0.78

no

0.32 (0.63)

0.33 (−0.44)

no

no

circumoral swelling (10081703)

0.05

4.71 (2.32–9.56)

4.71 (2.32–9.56)

25.19

21.14

yes

0.63 (1.15)

0.64 (0.26)

yes

yes

coating in the mouth (10075366)

0.02

4.15 (1.42–12.16)

4.15 (1.42–12.16)

8.89

6.87

yes

0.59 (0.93)

0.61 (0.02)

yes

yes

leukoplakia oral (10024396)

0.01

0.48 (0.19–1.23)

0.48 (0.19–1.23)

2.42

1.76

no

−0.54 (0.29)

−0.57 (−1.43)

no

no

mouth swelling (10075203)

1.03

3.51 (3.05–4.03)

3.51 (3.06–4.03)

393.64

358.70

yes

0.57 (1.39)

0.57 (0.48)

yes

yes

mouth ulceration (10028034)

0.42

0.75 (0.65–0.85)

0.75 (0.65–0.85)

19.51

19.33

no

−0.21 (0.79)

−0.21 (−0.32)

no

no

edema mouth (10030110)

0.01

0.05 (0.03–0.09)

0.05 (0.03–0.09)

249.85

214.24

no

−3.11 (0.06)

−3.15 (−3.69)

no

no

oral blood blister (10076590)

0.05

3.91 (1.97–7.73)

3.91 (1.97–7.73)

19.71

16.72

yes

0.59 (1.11)

0.59 (0.21)

yes

yes

oral candidiasis (10030963)

0.14

1.39 (1.06–1.82)

1.39 (1.06–1.82)

5.85

5.46

no

0.20 (0.96)

0.20 (−0.01)

no

no

oral discomfort (10030973)

0.86

3.38 (2.91–3.93)

3.38 (2.91–3.93)

314.39

287.33

yes

0.56 (1.37)

0.56 (0.47)

yes

yes

oral disorder (10067621)

0.22

1.47 (1.18–1.83)

1.47 (1.18–1.83)

12.51

11.92

no

0.23 (1.02)

0.23 (0.06)

yes

no

oral fungal infection (10061324)

0.02

1.66 (0.71–3.88)

1.66 (0.71–3.88)

1.44

0.96

no

0.28 (0.70)

0.29 (−0.34)

no

no

oral herpes (10067152)

1.52

1.51 (1.39–1.64)

1.51 (1.39–1.64)

95.20

93.00

no

0.24 (1.12)

0.24 (0.17)

yes

no

oral lichen planus (10030983)

0.04

3.12 (1.65–5.89)

3.12 (1.65–5.89)

14.72

12.65

yes

0.52 (1.05)

0.53 (0.14)

yes

yes

oral mucosa erosion (10064594)

0.001

0.83 (0.05–13.28)

0.83 (0.05–13.28)

0.02

0.00

no

−0.09 (0.07)

−0.13 (−2.53)

no

no

oral mucosal blistering (10030995)

0.43

1.46 (1.25–1.71)

1.46 (1.25–1.71)

23.39

22.62

no

0.22 (1.06)

0.22 (0.10)

yes

no

oral mucosal discoloration (10030996)

0.01

0.91 (0.39–2.15)

0.91 (0.39–2.15)

0.04

0.00

no

−0.06 (0.49)

−0.06 (−0.79)

no

no

oral mucosal eruption (10030997)

0.20

1.33 (1.06–1.66)

1.33 (1.06–1.66)

6.36

6.01

no

0.17 (0.98)

0.17 (0.00)

no

no

oral mucosal erythema (10067418)

0.09

1.61 (1.14–2.28)

1.61 (1.14–2.28)

7.49

6.87

no

0.27 (0.97)

0.27 (0.01)

yes

no

oral mucosal exfoliation (10064487)

0.03

1.34 (0.74–2.41)

1.34 (0.74–2.41)

0.96

0.69

no

0.17 (0.76)

0.18 (-0.29)

no

no

oral pain (10031009)

0.82

2.21 (1.94–2.52)

2.21 (1.94–2.52)

158.52

150.47

yes

0.41 (1.24)

0.41 (0.32)

yes

yes

oral papule (10031010)

0.002

0.55 (0.09–3.32)

0.55 (0.09–3.32)

0.43

0.04

no

−0.37 (0.13)

−0.45 (−2.09)

no

no

oral pruritus (10052894)

0.50

2.65 (2.22–3.17)

2.65 (2.22–3.17)

132.47

123.48

yes

0.48 (1.27)

0.48 (0.36)

yes

yes

oral purpura (10083533)

0.003

2.49 (0.26–23.97)

2.49 (0.26–23.97)

0.71

0.10

no

0.38 (0.31)

0.46 (−1.04)

no

no

oral pustule (10056674)

0.01

0.83 (0.40–1.74)

0.83 (0.40–1.74)

0.24

0.09

no

−0.12 (0.51)

−0.13 (−0.77)

no

no

oropharyngeal blistering (10067950)

0.06

0.60 (0.42–0.84)

0.60 (0.42–0.84)

8.85

8.39

no

−0.38 (0.58)

−0.39 (−0.70)

no

no

oropharyngeal plaque (10067721)

0.01

1.45 (0.43–4.97)

1.45 (0.43–4.97)

0.37

0.09

no

0.20 (0.48)

0.22 (−0.73)

no

no

perioral dermatitis (10034541)

0.02

1.25 (0.60–2.59)

1.25 (0.60–2.59)

0.35

0.17

no

0.13 (0.65)

0.14 (−0.45)

no

no

stomatitis (10042128)

0.96

1.48 (1.33–1.64)

1.48 (1.33–1.64)

55.21

53.86

no

0.23 (1.10)

0.23 (0.15)

yes

no

The frequentist criteria for identifying a signal of disproportionate reporting (SDR) were as follows: 1) PRR ≥ 2 with a 95% CI lower bound ≥1; 2) ROR ≥ 2 with a 95% CI lower bound ≥1; 3) likelihood ratio test (LRT) ≥3.84; 4) χ2 with Yates’s correction ≥4; and 5) total number of reports >3.
The Bayesian criteria for identifying an SDR were as follows: 1) point estimate and lower limit of the 95%
CI of the new IC method (IC025) are >0;
and 2) Bayesian Confidence Propagation Neural Network (BCPNN) point estimate and corresponding IC
025 are >0.
1 The preferred term “sensitivity of teeth (10040012)” was not reported in any vaccine groups.
2 The preferred terms “salivary duct inflammation (10056681)”, “salivary duct obstruction (10039386)”, “salivary duct stenosis (10039388)”, “salivary gland induration (10071363)”, and “salivary gland mass (10057002)” were not reported in any vaccine groups.
3 The preferred terms “acquired macroglossia (10058835)”, “ankyloglossia acquired (10049243)”, “atrophic glossitis (10069085)”, “atrophy of tongue papillae (10003712)”, “tongue black hairy (10043941)”, “tongue fungal infection (10075845)”, and “tongue induration (10084548)” were not reported in any vaccine groups.
4 The preferred term “lip erosion (10051992)” was not reported in any vaccine groups.
5 The preferred term “palatal palsy (10072012)” was not reported in any vaccine groups.
6 The preferred terms “aphthous stomatitis (10002958)”, “buccal mucosal roughening (10048479)”, “mouth plaque (10028032)”, “oral lichenoid reaction (10083833)”, “oral mucosal hypertrophy (10062956)”, “oral mucosal petechiae (10030998)”, “oral mucosal roughening (10084009)”, “oral mucosal scab (10082769)”, “oral pigmentation (10077552)”, “oral soft tissue disorder (10061326)”, and “oral viral infection (10065234)” were not reported in any vaccine groups.
ARR – absolute reporting ratio; MedDRA – Medical Dictionary for Regulatory Activities.
Table 3. Logistic regression analysis of eligible oral signals of dipropionate reporting (SDRs) associated with coronavirus disease 2019 (COVID-19) vaccination in the United States

Preferred term

Sex (female vs. male)

Age (increase per year)

State (red vs. blue)

Vaccine type (COVID-19 vaccine vs. non-COVID-19 vaccines)

Ageusia

1.094 (1.032–1.160); 0.003*

1.007 (1.006–1.009); <0.001*

1.098 (1.040–1.160); 0.001*

15.182 (13.313–17.313); <0.001*

Dysgeusia

2.056 (1.921–2.199); <0.001*

1.007 (1.006–1.008); <0.001*

0.994 (0.941–1.050); 0.834

2.648 (2.474–2.834); <0.001*

Hypogeusia

0.784 (0.581–1.056); 0.109

1.009 (1.002–1.016); 0.011*

1.009 (0.749–1.359); 0.952

5.682 (3.528–9.152); <0.001*

Taste disorder

1.464 (1.333–1.609); <0.001*

1.008 (1.006–1.010); <0.001*

1.089 (1.002–1.183); 0.044

19.645 (15.688–24.599); <0.001*

Anesthesia oral

0.915 (0.337–2.480); 0.861

0.986 (0.963–1.009); 0.216

0.704 (0.248–2.000); 0.510

16.931 (2.111–135.767); 0.008*

Burning mouth syndrome

2.568 (1.145–5.762); 0.022*

1.026 (1.010–1.041); 0.001*

1.475 (0.816–2.665); 0.198

4.454 (1.743–11.381); 0.002*

Hypoesthesia oral

2.433 (2.266–2.612); <0.001*

1.003 (1.001–1.004); <0.001*

0.966 (0.914–1.021); 0.216

2.966 (2.768–3.179); <0.001*

Paresthesia oral

3.742 (3.485–4.019); <0.001*

1.002 (1.001–1.004); <0.001*

0.911 (0.869–0.956); <0.001*

3.164 (2.977–3.362); <0.001*

Dental discomfort

1.893 (1.029–3.480); 0.040*

1.016 (1.003–1.029); 0.015*

1.047 (0.633–1.730); 0.859

39.081 (5.394–283.152); <0.001*

Dental paresthesia

1.465 (0.581–3.694); 0.418

0.999 (0.980–1.018); 0.909

0.993 (0.434–2.270); 0.987

8.719 (1.972–38.555); 0.004*

Hyperesthesia teeth

1.806 (1.237–2.637); 0.002*

1.007 (1.000–1.015); 0.062

0.876 (0.633–1.211); 0.423

10.397 (5.433–19.895); <0.001*

Toothache

1.564 (1.376–1.778); <0.001*

1.016 (1.014–1.019); <0.001*

0.926 (0.827–1.036); 0.180

2.351 (2.051–2.695); <0.001*

Aptyalism

0.970 (0.510–1.842); 0.925

1.018 (1.003–1.033); 0.018*

1.105 (0.597–2.047); 0.751

3.654 (1.515–8.817); 0.004*

Dry mouth

1.514 (1.387–1.653); <0.001*

1.010 (1.009–1.012); <0.001*

0.977 (0.904–1.055); 0.550

1.979 (1.809–2.165); <0.001*

Glossodynia

1.871 (1.575–2.222); <0.001*

1.013 (1.010–1.017); <0.001*

0.913 (0.790–1.056); 0.220

1.632 (1.391–1.914); <0.001*

Swollen tongue

2.566 (2.391–2.753); <0.001*

1.005 (1.004–1.007); <0.001*

0.962 (0.912–1.015); 0.160

1.979 (1.861–2.105); <0.001*

Tongue blistering

2.683 (1.818–3.960); <0.001*

1.014 (1.007–1.020); <0.001*

1.570 (1.186–2.079); 0.002*

2.063 (1.470–2.895); <0.001*

Tongue discomfort

2.929 (2.340–3.665); <0.001*

1.010 (1.006–1.013); <0.001*

0.924 (0.785–1.087); 0.339

7.401 (5.549–9.872); <0.001*

Tongue dry

3.517 (1.922–6.436); <0.001*

1.009 (1.000–1.019); 0.056

0.903 (0.597–1.365); 0.629

2.761 (1.651–4.616); <0.001*

Tongue eruption

2.052 (1.240–3.395); 0.005*

0.998 (0.989–1.007); 0.672

1.221 (0.815–1.830); 0.333

2.677 (1.621–4.421); <0.001*

Tongue erythema

2.194 (1.446–3.328); <0.001*

1.022 (1.013–1.030); <0.001*

0.886 (0.634–1.238); 0.478

4.937 (2.925–8.335); <0.001*

Tongue movement disturbance

1.218 (0.722–2.055); 0.461

0.997 (0.986–1.008); 0.611

0.841 (0.509–1.389); 0.498

2.906 (1.583–5.333); 0.001*

Tongue pruritus

3.272 (2.534–4.226); <0.001*

0.989 (0.985–0.993); <0.001*

0.847 (0.705–1.017); 0.075

7.908 (5.895–10.608); <0.001*

Chapped lips

1.575 (1.208–2.054); 0.001*

1.009 (1.004–1.014); <0.001*

1.046 (0.830–1.319); 0.702

1.712 (1.319–2.221); <0.001*

Lip disorder

1.526 (1.053–2.212); 0.026*

1.004 (0.997–1.012); 0.246

0.786 (0.559–1.105); 0.166

3.032 (1.990–4.617); <0.001*

Lip dry

1.783 (1.322–2.405); <0.001*

1.006 (1.001–1.012); 0.028*

1.035 (0.803–1.333); 0.790

1.972 (1.472–2.641); <0.001*

Lip erythema

1.970 (1.365–2.841); <0.001*

1.002 (0.995–1.008); 0.667

1.060 (0.785–1.433); 0.702

2.861 (1.960–4.176); <0.001*

Lip pain

2.600 (1.954–3.461); <0.001*

1.011 (1.006–1.016); <0.001*

1.057 (0.853–1.309); 0.612

1.842 (1.442–2.353); <0.001*

Lip pruritus

4.514 (3.268–6.235); <0.001*

0.996 (0.992–1.001); 0.125

1.058 (0.868–1.289); 0.578

4.043 (3.086–5.297); <0.001*

Palatal swelling

1.784 (1.101–2.891); 0.019*

1.014 (1.004–1.024); 0.005*

0.864 (0.570–1.309); 0.490

3.249 (1.880–5.615); <0.001*

Aphthous ulcer

1.674 (1.330–2.108); <0.001*

1.004 (0.999–1.008); 0.097

0.998 (0.819–1.216); 0.984

4.003 (3.043–5.265); <0.001*

Circumoral swelling

2.232 (1.081–4.606); 0.030*

0.997 (0.984–1.010); 0.628

1.339 (0.763–2.352); 0.309

3.608 (1.690–7.706); 0.001*

Coating in the mouth

0.702 (0.300–1.643); 0.415

1.034 (1.012–1.057); 0.003*

1.607 (0.697–3.707); 0.266

2.370 (0.793–7.086); 0.122

Mouth swelling

1.920 (1.663–2.216); <0.001*

1.005 (1.002–1.008); <0.001*

1.018 (0.904–1.146); 0.772

3.153 (2.703–3.677); <0.001*

Oral blood blister

0.974 (0.534–1.775); 0.931

1.014 (1.001–1.028); 0.034*

0.867 (0.482–1.562); 0.636

2.885 (1.370–6.077); 0.005*

Oral discomfort

2.921 (2.434–3.506); <0.001*

1.013 (1.010–1.016); <0.001*

1.003 (0.880–1.143); 0.969

2.588 (2.198–3.046); <0.001*

Oral lichen planus

2.708 (1.211–6.055); 0.015*

1.024 (1.009–1.040); 0.001*

0.636 (0.335–1.209); 0.167

3.816 (1.606–9.067); 0.002*

Oral pain

1.453 (1.258–1.678); <0.001*

1.013 (1.010–1.016); <0.001*

0.943 (0.829–1.073); 0.373

1.779 (1.538–2.057); <0.001*

Oral pruritus

3.932 (3.052–5.065); <0.001*

0.997 (0.993–1.000); 0.070

0.921 (0.779–1.089); 0.338

2.486 (2.041–3.029); <0.001*

Data is presented as adjusted odds ratio (95% confidence interval) (AOR (95% CI)), with the corresponding p-value. * statistically significant (p < 0.05).
Table 4. Time-adjusted logistic regression analysis of eligible oral signals of dipropionate reporting (SDRs) associated with coronavirus disease 2019 (COVID-19) vaccination in the United States

Preferred term

Sex
(female vs. male)

Age
(increase per year)

State
(red vs. blue)

Vaccine type (COVID-19 vaccine vs. non-COVID-19 vaccines)

Time period
(pandemic vs.
pre-pandemic)

Ageusia

1.097 (1.034–1.164); 0.002*

1.007 (1.006–1.009); <0.001*

1.094 (1.035–1.156); 0.001*

9.038 (7.195–11.353); <0.001*

1.978 (1.509–2.592); <0.001*

Dysgeusia

2.056 (1.920–2.201); <0.001*

1.007 (1.006–1.009); <0.001*

0.995 (0.941–1.051); 0.848

3.353 (2.872–3.913); <0.001*

0.750 (0.636–0.884); 0.001*

Hypogeusia

0.778 (0.576–1.051); 0.102

1.009 (1.002–1.016); 0.009*

1.013 (0.751–1.368); 0.931

14.035 (3.412–57.725); <0.001*

0.343 (0.081–1.456); 0.147

Taste disorder

1.478 (1.343–1.626); <0.001*

1.008 (1.006–1.010); <0.001*

1.091 (1.003–1.186); 0.042

4.687 (3.634–6.044); <0.001*

14.917 (8.828–25.206); <0.001*

Anesthesia oral

0.911 (0.336–2.470); 0.855

0.985 (0.962–1.007); 0.184

0.704 (0.248–2.000); 0.510

2.591 (0.335–20.058); 0.362

3,720,842.000 (0.000–Inf); 0.976

Burning mouth syndrome

2.495 (1.110–5.607); 0.027

1.025 (1.009–1.041); 0.002*

1.403 (0.771–2.555); 0.268

1.514 (0.469–4.895); 0.488

5.669 (0.947–33.941); 0.057

Hypoesthesia oral

2.432 (2.264–2.612); <0.001*

1.003 (1.001–1.004); <0.001*

0.966 (0.914–1.021); 0.222

2.690 (2.343–3.089); <0.001*

1.119 (0.963–1.300); 0.144

Paresthesia oral

3.735 (3.477–4.012); <0.001*

1.002 (1.001–1.004); <0.001*

0.910 (0.867–0.955); <0.001*

2.772 (2.459–3.126); <0.001*

1.163 (1.020–1.326); 0.024*

Dental discomfort

2.178 (1.134–4.185); 0.019*

1.013 (1.000–1.026); 0.053

1.136 (0.682–1.893); 0.624

7.388 (1.023–53.343); 0.047*

2,761,506.000 (0.000–Inf); 0.976

Dental paresthesia

1.459 (0.579–3.678); 0.423

0.997 (0.978–1.017); 0.783

0.993 (0.434–2.270); 0.987

1.506 (0.350–6.478); 0.582

6,614,348.000 (0.000–Inf); 0.975

Hyperesthesia teeth

1.785 (1.222–2.607); 0.003*

1.007 (0.999–1.015); 0.079

0.884 (0.639–1.224); 0.458

3.770 (1.554–9.148); 0.003*

4.489 (1.307–15.421); 0.017*

Toothache

1.570 (1.379–1.788); <0.001*

1.016 (1.013–1.019); <0.001*

0.934 (0.833–1.046); 0.238

1.554 (1.238–1.951); <0.001*

1.680 (1.293–2.181); <0.001*

Aptyalism

1.002 (0.517–1.943); 0.994

1.021 (1.005–1.036); 0.008*

1.082 (0.575–2.037); 0.807

18.339 (0.937–358.829); 0.055

0.149 (0.008–2.904); 0.209

Dry mouth

1.501 (1.374–1.639); <0.001*

1.010 (1.009–1.012); <0.001*

0.972 (0.899–1.051); 0.480

2.299 (1.900–2.782); <0.001*

0.827 (0.675–1.014); 0.067

Glossodynia

1.856 (1.562–2.206); <0.001*

1.013 (1.010–1.017); <0.001*

0.917 (0.793–1.062); 0.247

1.661 (1.215–2.272); 0.001*

0.967 (0.691–1.354); 0.846

Swollen tongue

2.572 (2.396–2.761); <0.001*

1.005 (1.004–1.006); <0.001*

0.964 (0.913–1.017); 0.182

1.714 (1.528–1.923); <0.001*

1.194 (1.054–1.353); 0.005*

Tongue blistering

2.737 (1.844–4.064); <0.001*

1.013 (1.006–1.020); <0.001*

1.618 (1.219–2.147); 0.001*

1.196 (0.704–2.030); 0.509

2.026 (1.093–3.755); 0.025*

Tongue discomfort

2.924 (2.333–3.663); <0.001*

1.009 (1.005–1.013); <0.001*

0.918 (0.780–1.082); 0.307

3.371 (2.188–5.193); <0.001*

3.068 (1.763–5.339); <0.001*

Tongue dry

3.423 (1.869–6.270); <0.001*

1.010 (1.000–1.020); 0.043*

0.851 (0.558–1.296); 0.452

2.333 (0.867–6.280); 0.094

1.170 (0.394–3.477); 0.778

Tongue eruption

2.104 (1.256–3.524); 0.005*

0.996 (0.987–1.006); 0.444

1.184 (0.784–1.788); 0.422

1.420 (0.653–3.090); 0.377

2.670 (1.064–6.704); 0.036*

Tongue erythema

2.271 (1.487–3.468); <0.001*

1.021 (1.012–1.029); <0.001*

0.895 (0.640–1.252); 0.518

2.654 (1.180–5.969); 0.018*

2.363 (0.865–6.454); 0.093

Tongue movement disturbance

1.189 (0.704–2.011); 0.517

0.997 (0.986–1.008); 0.586

0.859 (0.519–1.423); 0.555

1.783 (0.646–4.924); 0.264

1.811 (0.578–5.674); 0.308

Tongue pruritus

3.261 (2.525–4.212); <0.001*

0.988 (0.984–0.992); <0.001*

0.841 (0.700–1.011); 0.065

2.486 (1.682–3.673); <0.001*

5.349 (3.138–9.117); <0.001*

Chapped lips

1.630 (1.242–2.139); <0.001*

1.010 (1.005–1.015); <0.001*

1.078 (0.854–1.363); 0.527

2.161 (1.222–3.820); 0.008*

0.767 (0.420–1.400); 0.387

Lip disorder

1.538 (1.056–2.241); 0.025*

1.004 (0.997–1.012); 0.288

0.810 (0.575–1.141); 0.227

3.692 (1.411–9.662); 0.008*

0.763 (0.275–2.117); 0.604

Lip dry

1.829 (1.345–2.485); <0.001*

1.007 (1.001–1.013); 0.018*

1.036 (0.801–1.341); 0.786

1.743 (0.998–3.044); 0.051

1.167 (0.637–2.139); 0.618

Lip erythema

1.940 (1.344–2.799); <0.001*

1.000 (0.993–1.007); 0.979

1.079 (0.798–1.460); 0.620

1.022 (0.624–1.673); 0.932

4.512 (2.361–8.622); <0.001*

Lip pain

2.562 (1.925–3.411); <0.001*

1.010 (1.006–1.015); <0.001*

1.051 (0.847–1.303); 0.651

1.131 (0.767–1.669); 0.535

1.911 (1.223–2.983); 0.004*

Lip pruritus

4.479 (3.242–6.188); <0.001*

0.995 (0.991–1.000); 0.053

1.041 (0.853–1.270); 0.694

1.717 (1.159–2.543); 0.007*

3.264 (2.007–5.307); <0.001*

Palatal swelling

1.781 (1.099–2.887); 0.019*

1.013 (1.003–1.022); 0.011*

0.863 (0.569–1.309); 0.488

1.120 (0.563–2.229); 0.747

5.407 (2.008–14.561); 0.001*

Aphthous ulcer

1.704 (1.349–2.152); <0.001*

1.003 (0.998–1.007); 0.228

0.995 (0.815–1.215); 0.960

2.089 (1.359–3.211); 0.001*

2.480 (1.479–4.157); 0.001*

Circumoral swelling

2.169 (1.049–4.484); 0.037*

0.995 (0.982–1.008); 0.459

1.388 (0.786–2.449); 0.258

0.773 (0.342–1.745); 0.535

17.485 (3.613–84.612); <0.001*

Coating in the mouth

0.702 (0.300–1.644); 0.415

1.033 (1.010–1.056); 0.004*

1.607 (0.697–3.707); 0.266

1.057 (0.246–4.543); 0.940

3.496 (0.492–24.864); 0.211

Mouth swelling

1.915 (1.658–2.212); <0.001*

1.004 (1.001–1.007); 0.006*

1.017 (0.902–1.145); 0.787

1.156 (0.944–1.415); 0.162

4.484 (3.422–5.875); <0.001*

Oral blood blister

0.974 (0.534–1.775); 0.931

1.012 (0.998–1.025); 0.088

0.868 (0.482–1.563); 0.636

0.643 (0.299–1.383); 0.259

33.442 (4.170–268.206); 0.001*

Oral discomfort

2.952 (2.455–3.549); <0.001*

1.013 (1.010–1.016); <0.001*

0.996 (0.873–1.136); 0.950

1.622 (1.241–2.120); <0.001*

1.846 (1.353–2.518); <0.001*

Oral lichen planus

2.633 (1.176–5.896); 0.019*

1.023 (1.007–1.038); 0.004*

0.657 (0.345–1.252); 0.201

2.363 (0.577–9.675); 0.232

2.592 (0.437–15.366); 0.294

Oral pain

1.461 (1.263–1.689); <0.001*

1.013 (1.010–1.016); <0.001*

0.944 (0.828–1.075); 0.383

1.694 (1.282–2.238); <0.001*

1.070 (0.792–1.447); 0.658

Oral pruritus

3.957 (3.066–5.106); <0.001*

0.997 (0.993–1.001); 0.090

0.918 (0.776–1.086); 0.317

3.073 (1.965–4.806); <0.001*

0.765 (0.478–1.224); 0.264

Data is presented as AOR (95% CI), with the corresponding p-value. * statistically significant (p < 0.05).

Figures


Fig. 1. Study workflow for the disproportionality analysis of oral adverse events (AEs) following coronavirus disease 2019 (COVID-19) vaccination in the United States
Bay – Bayesian; BCPNN – Bayesian Confidence Propagation Neural Network; Frq – frequentist; hosp. – hospitalized; IC – information component; ICSR – individual case safety report; LRT – likelihood ratio test; MedDRA – Medical Dictionary for Regulatory Activities; O adults – older adults (>64 years); PIRR – pandemic induced reporting ratio; PRR – proportional reporting ratio; PT – preferred term; RCI – reporting change index; ROR – reporting odds ratio; SDR – signal of disproportionate reporting; VAERS – Vaccine Adverse Event Reporting System; W adult – working-age adults (18–64 years).
Fig. 2. Co-occurrence of chemosensory adverse events (AEs) across different subgroups
Cohen’s kappa values are color-coded as follows: values <0 are shown in dark gray; 0.00–0.20 in gray; 0.21–0.40 in yellow; 0.41–0.60 in orange; and 0.61–0.80 in red. Cells with not available values due to zero reports are displayed in black.
Fig. 3. Trends in taste disorder reports in the Vaccine Adverse Event Reporting System (VAERS) and Google Trends search activity (2020–2024)
KW – keyword.
Fig. 4. Logistic regression analysis of oral adverse events (AEs) following coronavirus disease 2019 (COVID-19) vaccination
A. Sex-based disparities; B. Age-based disparities; C. State-level political inclination; D. Vaccine type.
AOR – adjusted odds ratio.

References (54)

  1. Siani A. Vaccine Hesitancy and Refusal: History, Causes, Mitigation Strategies. In: Rezaei N, ed. Integrated Science of Global Epidemics. Cham, Switzerland: Springer International Publishing; 2023:503–517. doi:10.1007/978-3-031-17778-1_23
  2. Riad A. COVID – 19 Vaccine Hesitancy: A Tale of Two Pandemics [dissertation]. Prague, Czech Republic: Charles University; 2024. https://dspace.cuni.cz/handle/20.500.11956/189034. Accessed May 22, 2024.
  3. Matsumura A, Garg R, Hussain M, Matsumura ME. Political orientation of online media sources and reporting of Covid-19 vaccine myocarditis. PLoS One. 2024;19(1):e0296295. doi:10.1371/JOURNAL.PONE.0296295
  4. Cutroneo PM, Sartori D, Tuccori M, et al. Conducting and interpreting disproportionality analyses derived from spontaneous reporting systems. Front Drug Saf Regul. 2024;3:1323057. doi:10.3389/FDSFR.2023.1323057
  5. European Medicines Agency. Guideline on good pharmacovigilance practices (GVP) – Module IX Addendum I – Methodological aspects of signal detection from spontaneous reports of suspected adverse reactions. 2017. https://www.ema.europa.eu/en/documents/scientific-guideline/guideline-good-pharmacovigilance-practices-gvp-module-ix-addendum-i-methodological-aspects-signal-detection-spontaneous-reports-suspected-adverse-reactions_en.pdf. Accessed February 14, 2025.
  6. Vaccine Adverse Event Reporting System (VAERS). Guide to Interpreting VAERS Data. https://vaers.hhs.gov/data/dataguide.html. Accessed January 28, 2025.
  7. Riad A, Põld A, Kateeb E, Attia S. Oral adverse events following COVID-19 vaccination: Analysis of VAERS reports. Front Public Health. 2022;10:952781. doi:10.3389/FPUBH.2022.952781
  8. Riad A, Schulz-Weidner N, Dziedzic A, Howaldt HP, Attia S. Oral side effects of COVID-19 vaccines in 32 European countries: Analysis of EudraVigilance reports. J Med Virol. 2023;95(5):e28771. doi:10.1002/JMV.28771
  9. Riad A, Issa J, Attia S, Dušek L, Klugar M. Oral adverse events following COVID-19 and influenza vaccination in Australia. Hum Vaccin Immunother. 2023;19(2):2253589. doi:10.1080/21645515.2023.2253589
  10. Abubakr N, Salem ZA, Kamel AHM. Oral manifestations in mild-to-moderate cases of COVID-19 viral infection in the adult population. Dent Med Probl. 2021;58(1):7–15. doi:10.17219/DMP/130814
  11. Mazur M, Duś-Ilnicka I, Jedliński M, et al. Facial and oral manifestations following COVID-19 vaccination: A survey-based study and a first perspective. Int J Environ Res Public Health. 2021;18(9):4965. doi:10.3390/IJERPH18094965
  12. Faillie JL. Case–non-case studies: Principle, methods, bias and interpretation. Therapies. 2019;74(2):225–232. doi:10.1016/J.THERAP.2019.01.006
  13. Agyeman AA, Chin KL, Landersdorfer CB, Liew D, Ofori-Asenso R. Smell and taste dysfunction in patients with COVID-19: A systematic review and meta-analysis. Mayo Clin Proc. 2020;95(8):1621–1631. doi:10.1016/J.MAYOCP.2020.05.030
  14. Menni C, Valdes AM, Freidin MB, et al. Real-time tracking of self-reported symptoms to predict potential COVID-19. Nat Med. 2020;26(7):1037–1040. doi:10.1038/s41591-020-0916-2
  15. Lee Y, Min P, Lee S, Kim SW. Prevalence and duration of acute loss of smell or taste in COVID-19 patients. J Korean Med Sci. 2020;35(18):e174. doi:10.3346/JKMS.2020.35.E174
  16. Tsuchiya H, Mizogami M. Characteristics of oral adverse effects following COVID-19 vaccination and similarities with oral symptoms in COVID-19 patients: Taste and saliva secretory disorders. Med Princ Pract. 2025;34(2):101–120. doi:10.1159/000543182
  17. Moballegh Naseri M, Moballegh Naseri M, Maurya VK, Shams S, Pitaloka DAE. Epitope-based vaccine design against the membrane and nucleocapsid proteins of SARS-CoV-2. Dent Med Probl. 2023;60(3):489–495. doi:10.17219/DMP/161742
  18. Fusaroli M, Salvo F, Begaud B, et al. The REporting of A Disproportionality Analysis for DrUg Safety Signal Detection Using Individual Case Safety Reports in PharmacoVigilance (READUS-PV): Explanation and elaboration. Drug Saf. 2024;47(6):585–599. doi:10.1007/S40264-024-01423-7
  19. Vaccine Adverse Event Reporting System (VAERS). About VAERS. https://vaers.hhs.gov/about.html. Accessed January 27, 2025.
  20. MedDRA. Medical Dictionary for Regulatory Activities. MedDRA Hierarchy. https://www.meddra.org/how-to-use/basics/hierarchy. Accessed January 27, 2025.
  21. United States® Census Bureau. Exploring Age Groups in the 2020 Census. https://www.census.gov/library/visualizations/interactive/exploring-age-groups-in-the-2020-census.html. Accessed January 28, 2025.
  22. National Archives. 2020 Electoral College Results. https://www.archives.gov/electoral-college/2020. Accessed January 28, 2025.
  23. The R Foundation. The R Project for Statistical Computing. https://www.r-project.org/index.html. Accessed May 22, 2023.
  24. Sachdeva S, Saluja H, Mani A. Cognizance, adverse effects and motivation regarding COVID-19 vaccination amongst health care professionals: A cross-sectional study. Dent Med Probl. 2022;59(1):13–19. doi:10.17219/DMP/145757
  25. Kim S, Bea S, Choe SA, Choi NK, Shin JY. Autoimmune disorders reported following COVID-19 vaccination: A disproportionality analysis using the WHO database. Eur J Clin Pharmacol. 2024;80(3):445–453. doi:10.1007/S00228-023-03618-W
  26. Dutta S, Kaur R, Charan J, et al. Analysis of neurological adverse events reported in VigiBase from COVID-19 vaccines. Cureus. 2022;14(1):e21376. doi:10.7759/CUREUS.21376
  27. Kim JE, Park J, Song TJ. A disproportionality analysis for the association of central nervous system demyelinating diseases with COVID-19 vaccination using the World Health Organization pharmacovigilance database. Mult Scler. 2022;28(13):2112–2123. doi:10.1177/13524585221109397
  28. Préta LH, Contejean A, Salvo F, Treluyer JM, Charlier C, Chouchana L. Association study between herpes zoster reporting and mRNA COVID-19 vaccines (BNT162b2 and mRNA-1273). Br J Clin Pharmacol. 2022;88(7):3529–3534. doi:10.1111/BCP.15280
  29. The HL, Keowmani T, Tang MM. Risk factors associated with cutaneous reactions following COVID-19 vaccine immunisation: A registry-based case–control study. Malay J Med Sci. 2024;31(3):133–148. doi:10.21315/mjms2024.31.3.10
  30. Duijster JW, Lieber T, Pacelli S, et al. Sex-disaggregated outcomes of adverse events after COVID-19 vaccination: A Dutch cohort study and review of the literature. Front Immunol. 2023;14:1078736. doi:10.3389/FIMMU.2023.1078736
  31. Flanagan KL, Fink AL, Plebanski M, Klein SL. Sex and gender differences in the outcomes of vaccination over the life course. 2017;33:577–599. doi:10.1146/ANNUREV-CELLBIO-100616-060718
  32. Kim JE, Park J, Min YG, Hong YH, Song TJ. Associations of neuralgic amyotrophy with COVID-19 vaccination: Disproportionality analysis using the World Health Organization pharmacovigilance database. Muscle Nerve. 2022;66(6):766–770. doi:10.1002/MUS.27734
  33. Chen C, Fu F, Ding L, Xiao J. Hearing disorder following COVID-19 vaccination: A pharmacovigilance analysis using the Vaccine Adverse Event Reporting System. J Clin Pharm Ther. 2022;47(11):1789–1795. doi:10.1111/JCPT.13767
  34. Kaur RJ, Dutta S, Charan J, et al. Cardiovascular adverse events reported from COVID-19 vaccines: A study based on WHO database. Int J Gen Med. 2021;14:3909–3927. doi:10.2147/IJGM.S324349
  35. Foltran D, Delmas C, Flumian C, et al. Myocarditis and pericarditis in adolescents after first and second doses of mRNA COVID-19 vaccines. Eur Heart J Qual Care Clin Outcomes. 2022;8(2):99–103. doi:10.1093/EHJQCCO/QCAB090
  36. Li M, Yuan J, Lv G, Brown J, Jiang X, Lu ZK. Myocarditis and pericarditis following COVID-19 vaccination: Inequalities in age and vaccine types. J Pers Med. 2021;11(11):1106. doi:10.3390/JPM11111106
  37. Polack FP, Thomas SJ, Kitchin N, et al.; C4591001 Clinical Trial Group. Safety and efficacy of the BNT162b2 mRNA Covid-19 vaccine. N Eng J Med. 2020;383(27):2603–2615. doi:10.1056/NEJMOA2034577
  38. Oster ME, Shay DK, Su JR, et al. Myocarditis cases reported after mRNA-based COVID-19 vaccination in the US from December 2020 to August 2021. JAMA. 2022;327(4):331–340. doi:10.1001/JAMA.2021.24110
  39. Shimabukuro T, Nair N. Allergic reactions including anaphylaxis after receipt of the first dose of Pfizer-BioNTech COVID-19 vaccine. JAMA. 2021;325(8):780–781. doi:10.1001/JAMA.2021.0600
  40. Schultz NH, Sørvoll IH, Michelsen AE, et al. Thrombosis and thrombocytopenia after ChAdOx1 nCoV-19 vaccination. New Eng J Med. 2021;384(22):2124–2130. doi:10.1056/NEJMOA2104882
  41. Farabee D, Hawken A. Perceptions of COVID-19 vaccine side effects by political affiliation. J Public Health (Oxf). 2023;45(4):930–934. doi:10.1093/pubmed/fdad105
  42. Asch DA, Luo C, Chen Y. Reports of COVID-19 vaccine adverse events in predominantly Republican vs Democratic states. JAMA Netw Open. 2024;7(3):e244177. doi:10.1001/jamanetworkopen.2024.4177
  43. Motta M. Is partisan conflict over COVID-19 vaccination eroding support for childhood vaccine mandates? NPJ Vaccines. 2023;8(1):5. doi:10.1038/s41541-023-00611-3
  44. Shin J, Shim SR, Lee J, Ryu HS, Kim JY. Otorhinolaryngologic complications after COVID-19 vaccination, Vaccine Adverse Event Reporting System (VAERS). Front Public Health. 2024;11:1338862. doi:10.3389/FPUBH.2023.1338862
  45. di Mauro G, Mascolo A, Longo M, et al. European safety analysis of mRNA and viral vector COVID-19 vaccines on glucose metabolism events. Pharmaceuticals. 2022;15(6):677. doi:10.3390/PH15060677
  46. Ruggiero R, Donniacuo M, Mascolo A, et al. COVID-19 vaccines and atrial fibrillation: Analysis of the post-marketing pharmacovigilance European database. Biomedicines. 2023;11(6):1584. doi:10.3390/BIOMEDICINES11061584
  47. Arabzadeh Bahri R, Esmaeilpur Abianeh F, Peisepar M, et al. Anosmia or ageusia following COVID-19 vaccination: A systematic review. Ear Nose Throat J. 2024;103(1_suppl):164S–170S. doi:10.1177/01455613241233098
  48. VAC4EU. EMA-funded studies. Projects and Studies. https://vac4eu.org/projects-and-studies. Accessed February 14, 2025.
  49. Egbers T, Willame C, Belbachir L, et al. ACCESS-Background rate of adverse events-definition – anosmia & ageusia. doi:10.5281/ZENODO.5236687
  50. Sturkenboom MCJM, Messina D, Paoletti O, et al. Cohort monitoring of adverse events of special interest and COVID-19 diagnoses prior to and after COVID-19 vaccination. doi:10.5281/ZENODO.6762311
  51. Durán CE, Messina D, Gini R, et al. Rapid safety assessment of SARS-CoV-2 vaccines in EU member states using electronic health care data sources (COVID vaccine monitor-CVM study): Final study report for WP3 (electronic health record data). doi:10.5281/ZENODO.10093613
  52. Gallagher TJ, Parikh M, Herrera K, Lin ME, Hur K. Association of COVID-19 vaccination with changes in smell and taste. Otolaryngol Head Neck Surg. 2024;171(4):1240–1244. doi:10.1002/OHN.833
  53. Park G, Jung H, Heo SJ, Jung I. Comparison of data mining methods for the signal detection of adverse drug events with a hierarchical structure in postmarketing surveillance. Life (Basel). 2020;10(8):138. doi:10.3390/LIFE10080138
  54. Whitaker HJ, Hocine MN, Farrington CP. The methodology of self-controlled case series studies. Stat Methods Med Res. 2009;18(1):7–26. doi:10.1177/0962280208092342