Abstract
Background. Sleep-related breathing disorders (SRBD), including obstructive sleep apnea (OSA) and habitual snoring, can substantially impair quality of life (QoL). However, evidence regarding their impact in patients with orofacial pain (OFP) remains limited. Although disentangling the specific consequences of SRBD from the overlapping conditions is challenging, validated psychometric instruments provide a valuable means of screening for associated biopsychosocial burdens, such as depression and anxiety.
Objectives. The aim of the present study was to investigate potential associations between respiratory distress caused by SRBD, using self-report data and psychometric variables as indicators of psychosocial stress, and the overall well-being in individuals with OFP.
Material and methods. Anonymized data from 415 patients was analyzed. The participants were screened and categorized according to the presence or absence of respiratory distress. Psychometric measures were examined descriptively. Based on the responses (positive or negative) to the screening question, group differences were evaluated within subgroups matched for sex, age decade, employment status, body mass index (BMI), and typical pain intensity. Associations between the variables were subsequently analyzed using multiple regression models.
Results. Most patients were female (n = 290; 69.9%), aged 20–59 years (n = 296; 71.3%), workers (n = 246; 59.3%), with a normal weight (n = 255; 61.4%) and without any respiratory distress (n = 324; 78.1%). Most patients who reported respiratory distress were female (n = 57; 62.6%), and more than a half were 40–59 years old (n = 49; 53.8%). For all domains of psychosocial stress, the percentage of patients reaching a clinically relevant score was higher for the group with respiratory distress, except for the Dysmorphic Concern Questionnaire (DCQ). Significant effects of typical pain intensity were observed across all questionnaires except DCQ, the Injustice Experience Questionnaire (IEQ), the Patient Health Questionnaire-9 (PHQ-9), and the Patient Health Questionnaire for Stress (PHQ-Stress).
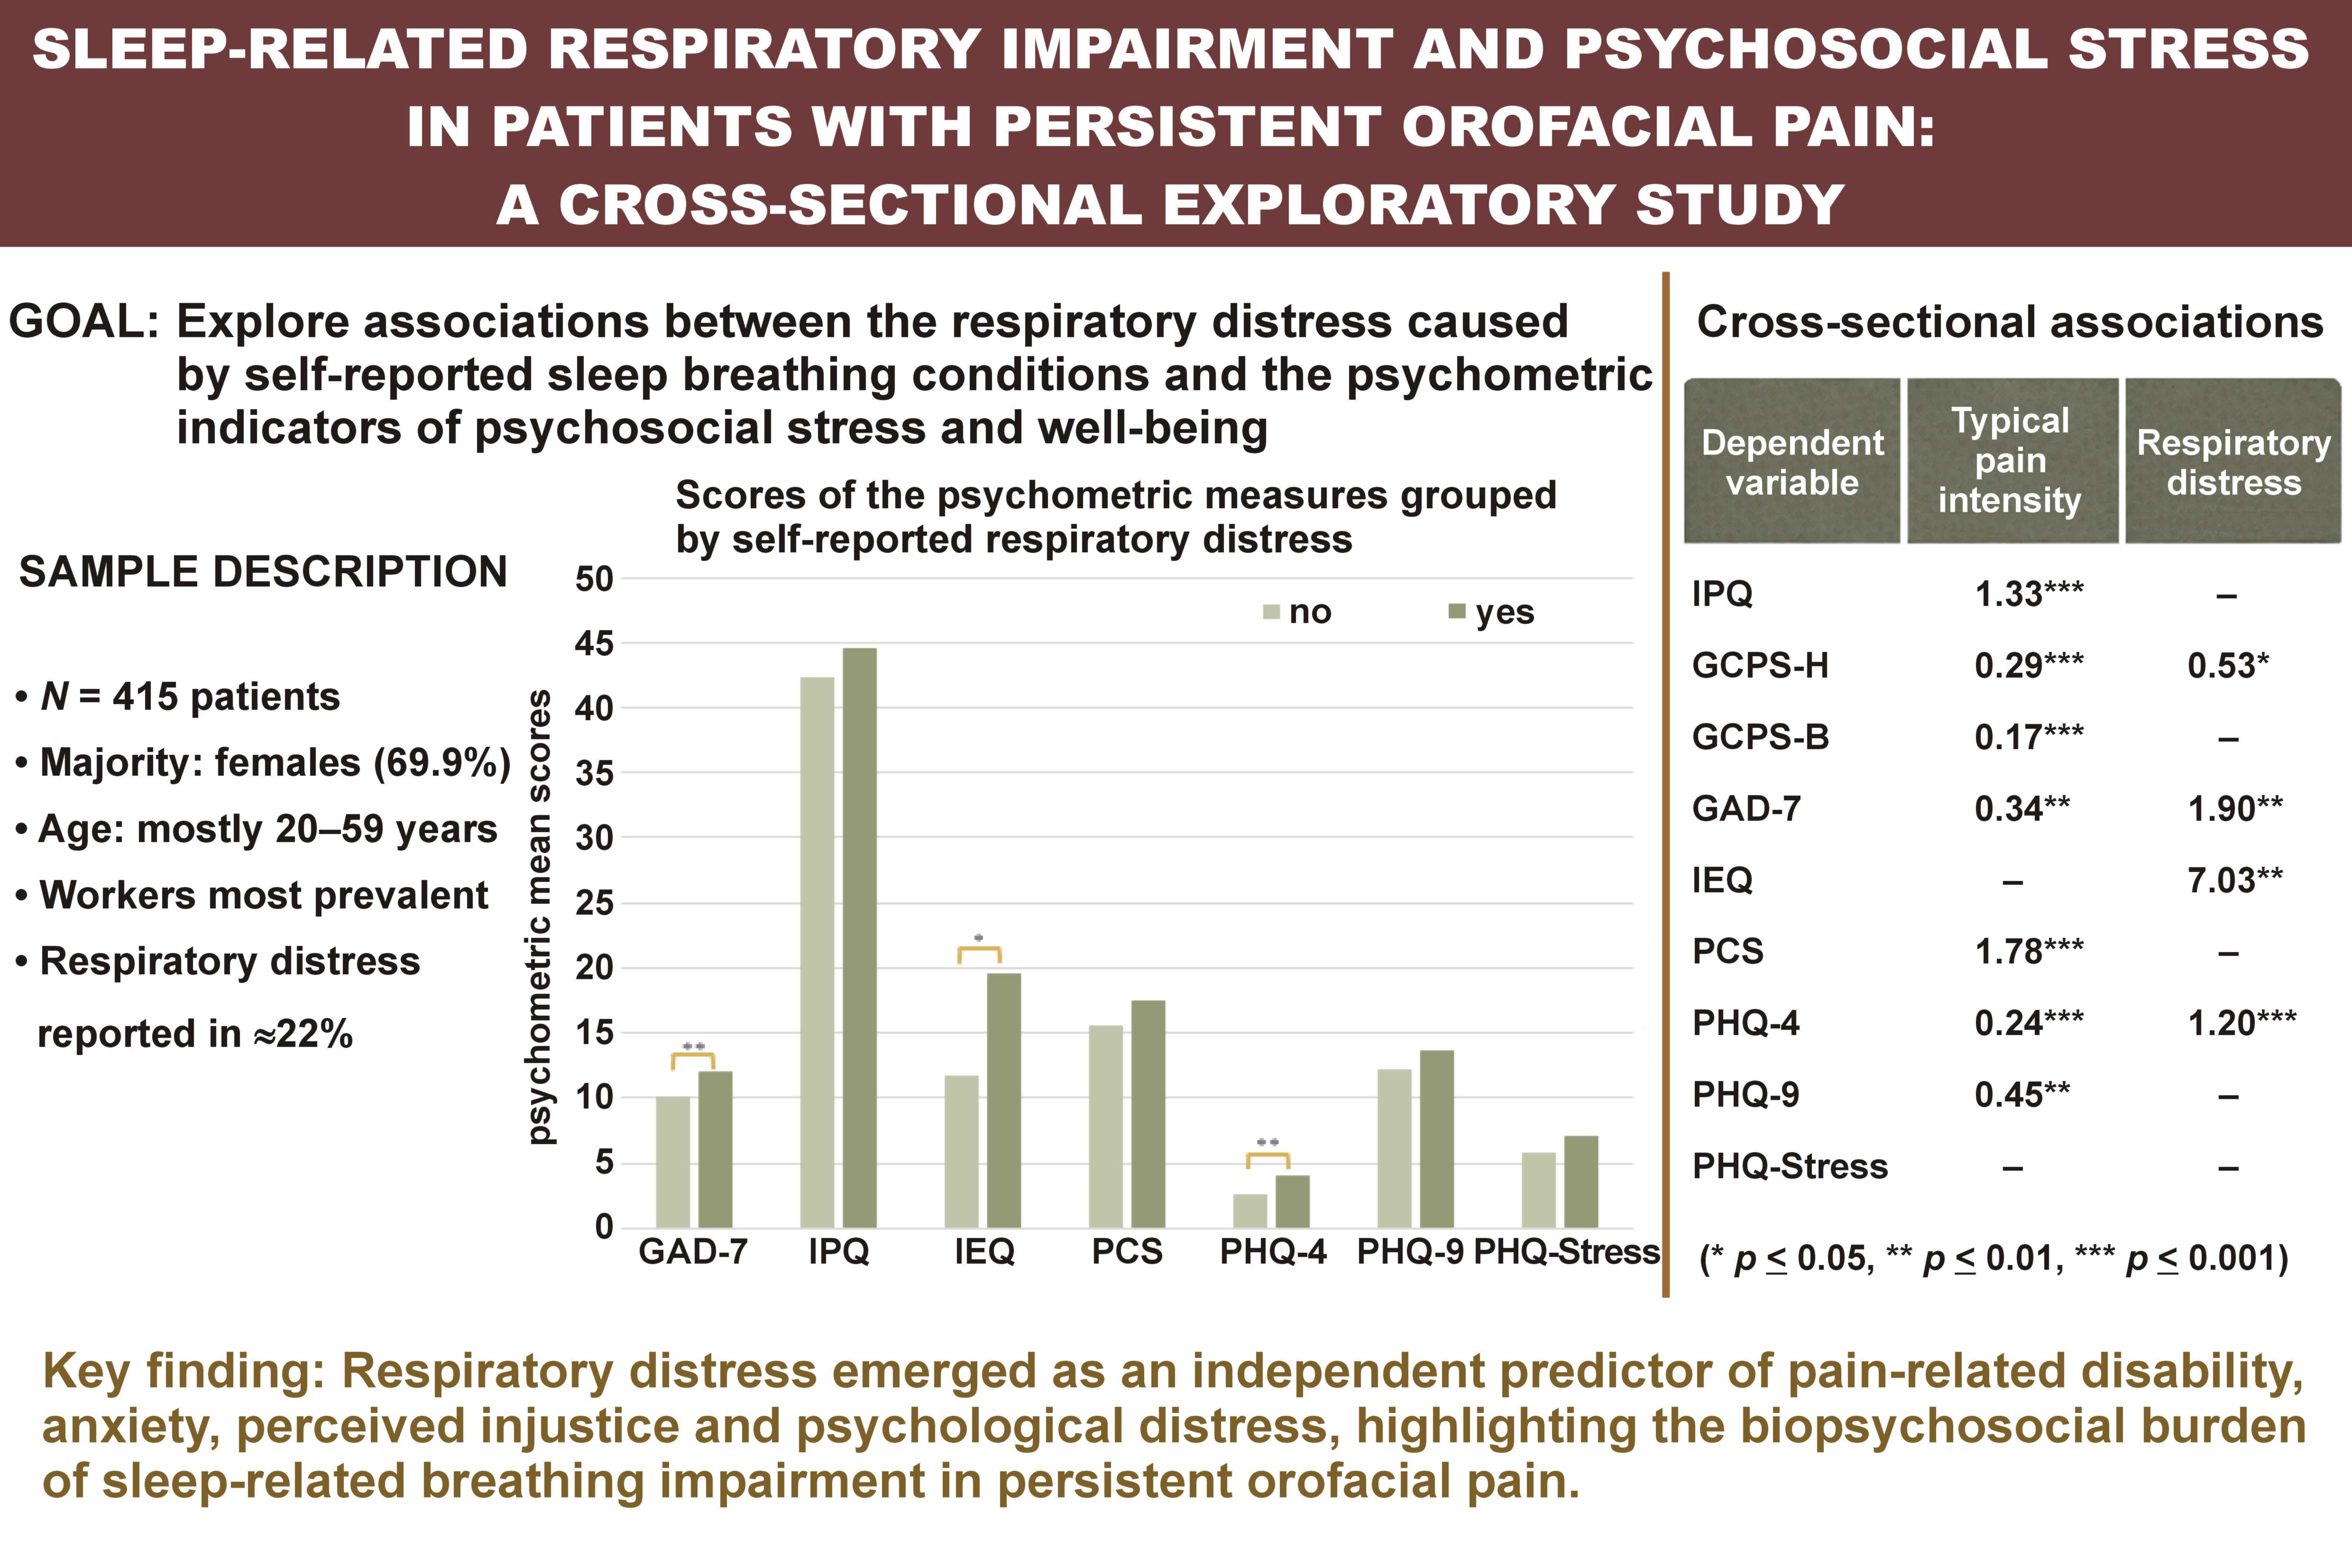
Conclusions. In this cross-sectional study, about 22% of the evaluated patients reported some form of SRBD. Moreover, SRBD were associated with higher psychometric scores, suggesting a close relationship between sleep-related respiratory difficulties and psychosocial impairment.
Keywords: snoring, anxiety, depression, sleep apnea, psychosocial stress
Introduction
Sleep-related breathing disorders (SRBD) are among the most common sleep disorders, constituting a major public health concern with a paramount impact on quality of life (QoL).1 The SRBD group ranges in severity from habitual snoring, where there is no severe gas exchange abnormality nor sleep fragmentation, to obstructive sleep apnea (OSA). The latter is a condition caused by the repetitive narrowing and collapsing of the upper airway during sleep.2, 3 Obstructive sleep apnea, which results in intermittent hypoxia, hypercapnia, as well as recurrent arousals, is the most common breathing disorder with a prevalence ranging from 9% to 38% in the general population.4, 5 When only considering the adult population, this prevalence increases to 15–75%.3 The OSA symptoms include snoring sounds, disturbed sleep, excessive daytime sleepiness, impaired neurocognitive functions, and mood disorders, all of which have a major influence on patients’ overall well-being. Aside from being indicative of OSA, snoring alone is commonly referred to as primary snoring, intermittent snoring or habitual snoring.6 Habitual snoring in the absence of OSA has a reported prevalence ranging from 10% to 60%.7 This condition may have a strong impact on sleep quality for both snorers and their bedfellows, ultimately leading to increased daytime anxiety, risk of depression and stress.8
A growing body of research has demonstrated that OSA and habitual snoring are associated with cognitive, behavioral and psychosocial problems.9 Specifically, the daytime symptoms of both conditions deserve particular attention, as they pertain to marked psychological distress and adverse psychosocial consequences.10 Sleep and well-being are therefore interrelated.11 Psychosocial stress refers to a state of emotional suffering that encompasses a diversity of comorbid psychological factors, such as depressive and anxiety symptoms, general stress, and sleep disturbance.12, 13 Depression and anxiety as measures of compromised well-being are commonly reported in adults with OSA.14, 15 Psychiatric symptoms have also been reported to be more frequent in the snoring population as compared to non-snorers.16
That being said, the consideration of biopsychosocial outcomes when assessing the impact of poor quality of sleep has evoked a great deal of interest among the scientific community over the last decades. Currently, there is a diverse set of psychometric instruments widely used for clinical care and research, such as the Hospital Anxiety and Depression Scale (HADS), the Patient Health Questionnaire (PHQ), the Pain Catastrophizing Scale (PCS), and the Graded Chronic Pain Scale (GCPS).17 The most common factors assessed by these tools include somatic symptoms, emotional functioning, pain coping, and perceived stress.18 Furthermore, socio-demographic variables, such as gender, age, the body mass index (BMI), the employment status, or drinking habits, should be considered when performing a psychometric assessment, as their impact on the aforementioned factors is well-documented.19, 20, 21, 22 With this in mind, the Web-based Instrument for Interdisciplinary Symptom Evaluation (WISE) was applied in this study. WISE is an online tool which relies on self-report data of patients.23 Its structure combines a symptom-burden checklist with validated psychometric in-depth questionnaires serving as case-finding instruments, and it further reports pain features, gender, age, BMI, and the employment status. This approach provides single-case summary reports from a biopsychosocial perspective, assisting clinicians with a comprehensive screening for providing tailored management to patients with orofacial pain (OFP) and/or temporomandibular disorders (TMD). Such assessment is relevant from a pain management standpoint, as psychosocial factors may influence treatment outcomes not only in patients experiencing OFP and/or TMD, but many other types of chronic pain.23 Research has shown that OFP patients report poor emotional and social functioning, and reduced QoL.24 On the other hand, OFP disorders, i.e., those experienced in the head, mouth and face area, are cross-sectionally related to depression, fatigue and pain-related sleep disturbance.24, 25
The aim of the present study was to investigate potential associations between respiratory distress caused by SRBD, using self-report data and psychometric variables as indicators of psychosocial stress, and the overall well-being in individuals with OFP.
Material and methods
Subjects
This study included anonymized WISE data from 415 patients who reported to an Interdisciplinary Orofacial Pain Unit, in Zurich, Switzerland. The patients completed the WISE questionnaire prior to their first medical appointment. The spectrum of diagnoses encountered in this unit has been reported elsewhere.26
According to the Swiss law, the analysis of strictly anonymized data does not require the approval by an ethics committee. Only data from patients who had given consent to the use of their anonymized data for research was used. Also, the screening question “During the last 4 weeks, how much have you been bothered by any of the following problems: snoring/apnea during sleep?” was a mandatory response item in the WISE questionnaire.
WISE dataset
As mentioned above, WISE is an instrument used for interdisciplinary subject-tailored assessment that combines a symptom-burden checklist addressing diverse symptom domains according to the PHQ-15 with validated psychometric in-depth questionnaires serving as case-finding instruments. The latter are presented to the patient when their checklist scores exceed a predefined threshold value. The psychometric measures from WISE used in this study are listed below.
Brief Illness Perception Questionnaire (IPQ)27
The IPQ assesses cognitive and emotional representations of illness and health threat. This questionnaire has 8 questions covering different aspects of illness perception, which are rated on a 11-point numeric response scale ranging from 0 to 10. The total score ranges from 0 to 80, and no cut-off score (CO) has been reported.
Dysmorphic Concern Questionnaire (DCQ)28
The DCQ is a psychometric measure assessing excessive preoccupation or concern with an imagined or slight physical defect that has a significant influence on psychosocial functioning. It consists of 7 items covering different aspects of dysmorphic concern, scored on a 4-point ordinal scale (0: not at all – 3: much more than most people). The total score ranges from 0 to 21, and a CO of 9 is indicative of a possible body dysmorphic disorder.
Graded Chronic Pain Scale (GCPS), v. 2.029
The GCPS is a multidimensional measure that assesses 2 dimensions of overall chronic pain severity: pain intensity; and pain-related disability. Both dimensions are scored independently, including 3 items for pain intensity and 4 items for pain-related disability. Scores are calculated for 3 subscales: pain intensity (the assessment of current, worst and average pain intensity for the last 30 days; 0: no pain – 10: pain as bad as it could be); the disability days score (the number of days being kept from daily activities by pain for the last 3 months; the number of days determines a disability score ranging from 0‒3); and the interference score (interference by pain during daily, social and working activities; 0: no interference – 10: unable to carry on any activities for the last 30 days). The latter two are used to calculate the disability points score, which ranges from 0 to 6. Two separate disability scores due to pain in the head (GCPS-H) or the body (GCPS-B) were calculated. A CO of 3 was used as indicative of high disability and severe limitation.
General Anxiety Disorder-7 (GAD-7)30
The GAD-7 is a screening tool for general anxiety in primary care patients. Using a 4-point ordinal rating scale, 7 items covering different aspects of general anxiety are scored between 0–3 (0: not at all – 3: nearly every day). Summary scores range from 0 to 21 and are assigned to the corresponding categories: “none/minimal” (0–4); “mild” (5–9); “moderate” (10–14); or “severe” (>14). The CO has been established at 10.
Injustice Experience Questionnaire (IEQ)31
The IEQ assesses injustice experienced due to accidents, injuries or maltreatment, and consists of 12 items reflecting the frequency of thoughts, beliefs and emotions associated with an injury. Each item is rated on an ordinal scale ranging from 0 to 4 (0: never – 4: all the time). The total score ranges from 0 to 48, with a CO of 18 being indicative of further professional assessment.
Pain Catastrophizing Scale (PCS)32
The PCS assesses catastrophizing thoughts, feelings and corresponding behaviors that patients may experience. This questionnaire has 13 items rated on a 5-point ordinal scale (0: not at all – 4: all the time), and total scores range from 0 to 52. The PCS can be categorized into 3 subscales, each one with a specific cut-off point: rumination; magnification; and helplessness. When considering the questionnaire as a whole, a CO of 30 should be considered as clinically relevant.
Patient Health Questionnaire-4 (PHQ-4)33
The PHQ-4 is an ultra-brief screener of both anxiety and depression in primary care patients. It consists of a 2-item depression scale (PHQ-2, which is part of PHQ-9) and a 2-item anxiety scale (GAD-2, which is part of GAD-7). The items are rated on an ordinal scale of 0–3 (0: not at all – 3: nearly every day). The maximum score can be calculated for the 2 subscales (max = 6) or for the questionnaire as a whole (max = 12). Sum scores ≥6 for the total score and ≥3 for the subscores indicate the need for further expert evaluation.
Patient Health Questionnaire-9 (PHQ-9)34
The PHQ-9 screens for depression and assesses its severity. As GAD-7, it correlates with functional impairment. Nine items approaching different aspects of depression are scored using the same scale as the PHQ-4. Total scores range from 0 to 27 and are assigned to the corresponding categories: “none/minimal” (0–4); “mild” (5–9); “moderate” (10–14); “moderately severe” (15–19); or “severe” (>19). A score of 10 has been recommended as the CO for patients to be referred to expert assessment.
Patient Health Questionnaire for Stress (PHQ-Stress)35
The PHQ-Stress is a 10-item subscale of the Primary Care Evaluation of Mental Disorders (PRIME-MD) Patient Health Questionnaire that addresses burden due to psychosocial stress. Patients rate the extent to which they have been bothered by each stressor on a 3-point ordinal rating scale (0: not at all – 2: a lot). Sum scores range from 0 to 20, reflecting the degree of psychosocial stress burden: “none/minimal” (0‒4); “mild” (5‒ 9); “medium” (10‒14); or “severe” (>14).
Statistical analysis
Descriptive statistics were calculated to characterize the dataset. A multivariate analysis of variance (MANOVA) was performed, as well as multiple comparisons analysis applying the Bonferroni or Tamhane correction, depending on whether the assumption of the homogeneity of variances was verified. Multiple regressions were performed to determine the cross-sectional associations between each of the independent (predictor) variables (gender, age group, BMI, employment status, typical pain intensity, and respiratory distress) and the dependent (predicted) variable (psychometric scores), expressed by the corresponding regression coefficients. Multiple regression analysis using a stepwise selection was then performed to assess which variables could accurately predict the score of each domain.
All statistical analyses were conducted using IBM SPSS Statistics for Windows, v. 26.0 (IBM Corp., Armonk, USA). Statistical significance was set at p ≤ 0.05.
Results
Most patients were female (n = 290; 69.9%), with a female to male ratio of 2.32:1, aged 20‒59 years (n = 296; 71.3%), workers (n = 246; 59.3%), and had a normal weight (n = 255; 61.4%). A total of 401 patients (96.93%) reported the typical pain intensity associated with their chief pain complaint. On a 11-point numeric rating scale from 0 to 10, the overall mean was 4.82; 161 patients (40.15%) reported typical pain intensity in the range of 4–6 (Table 1).
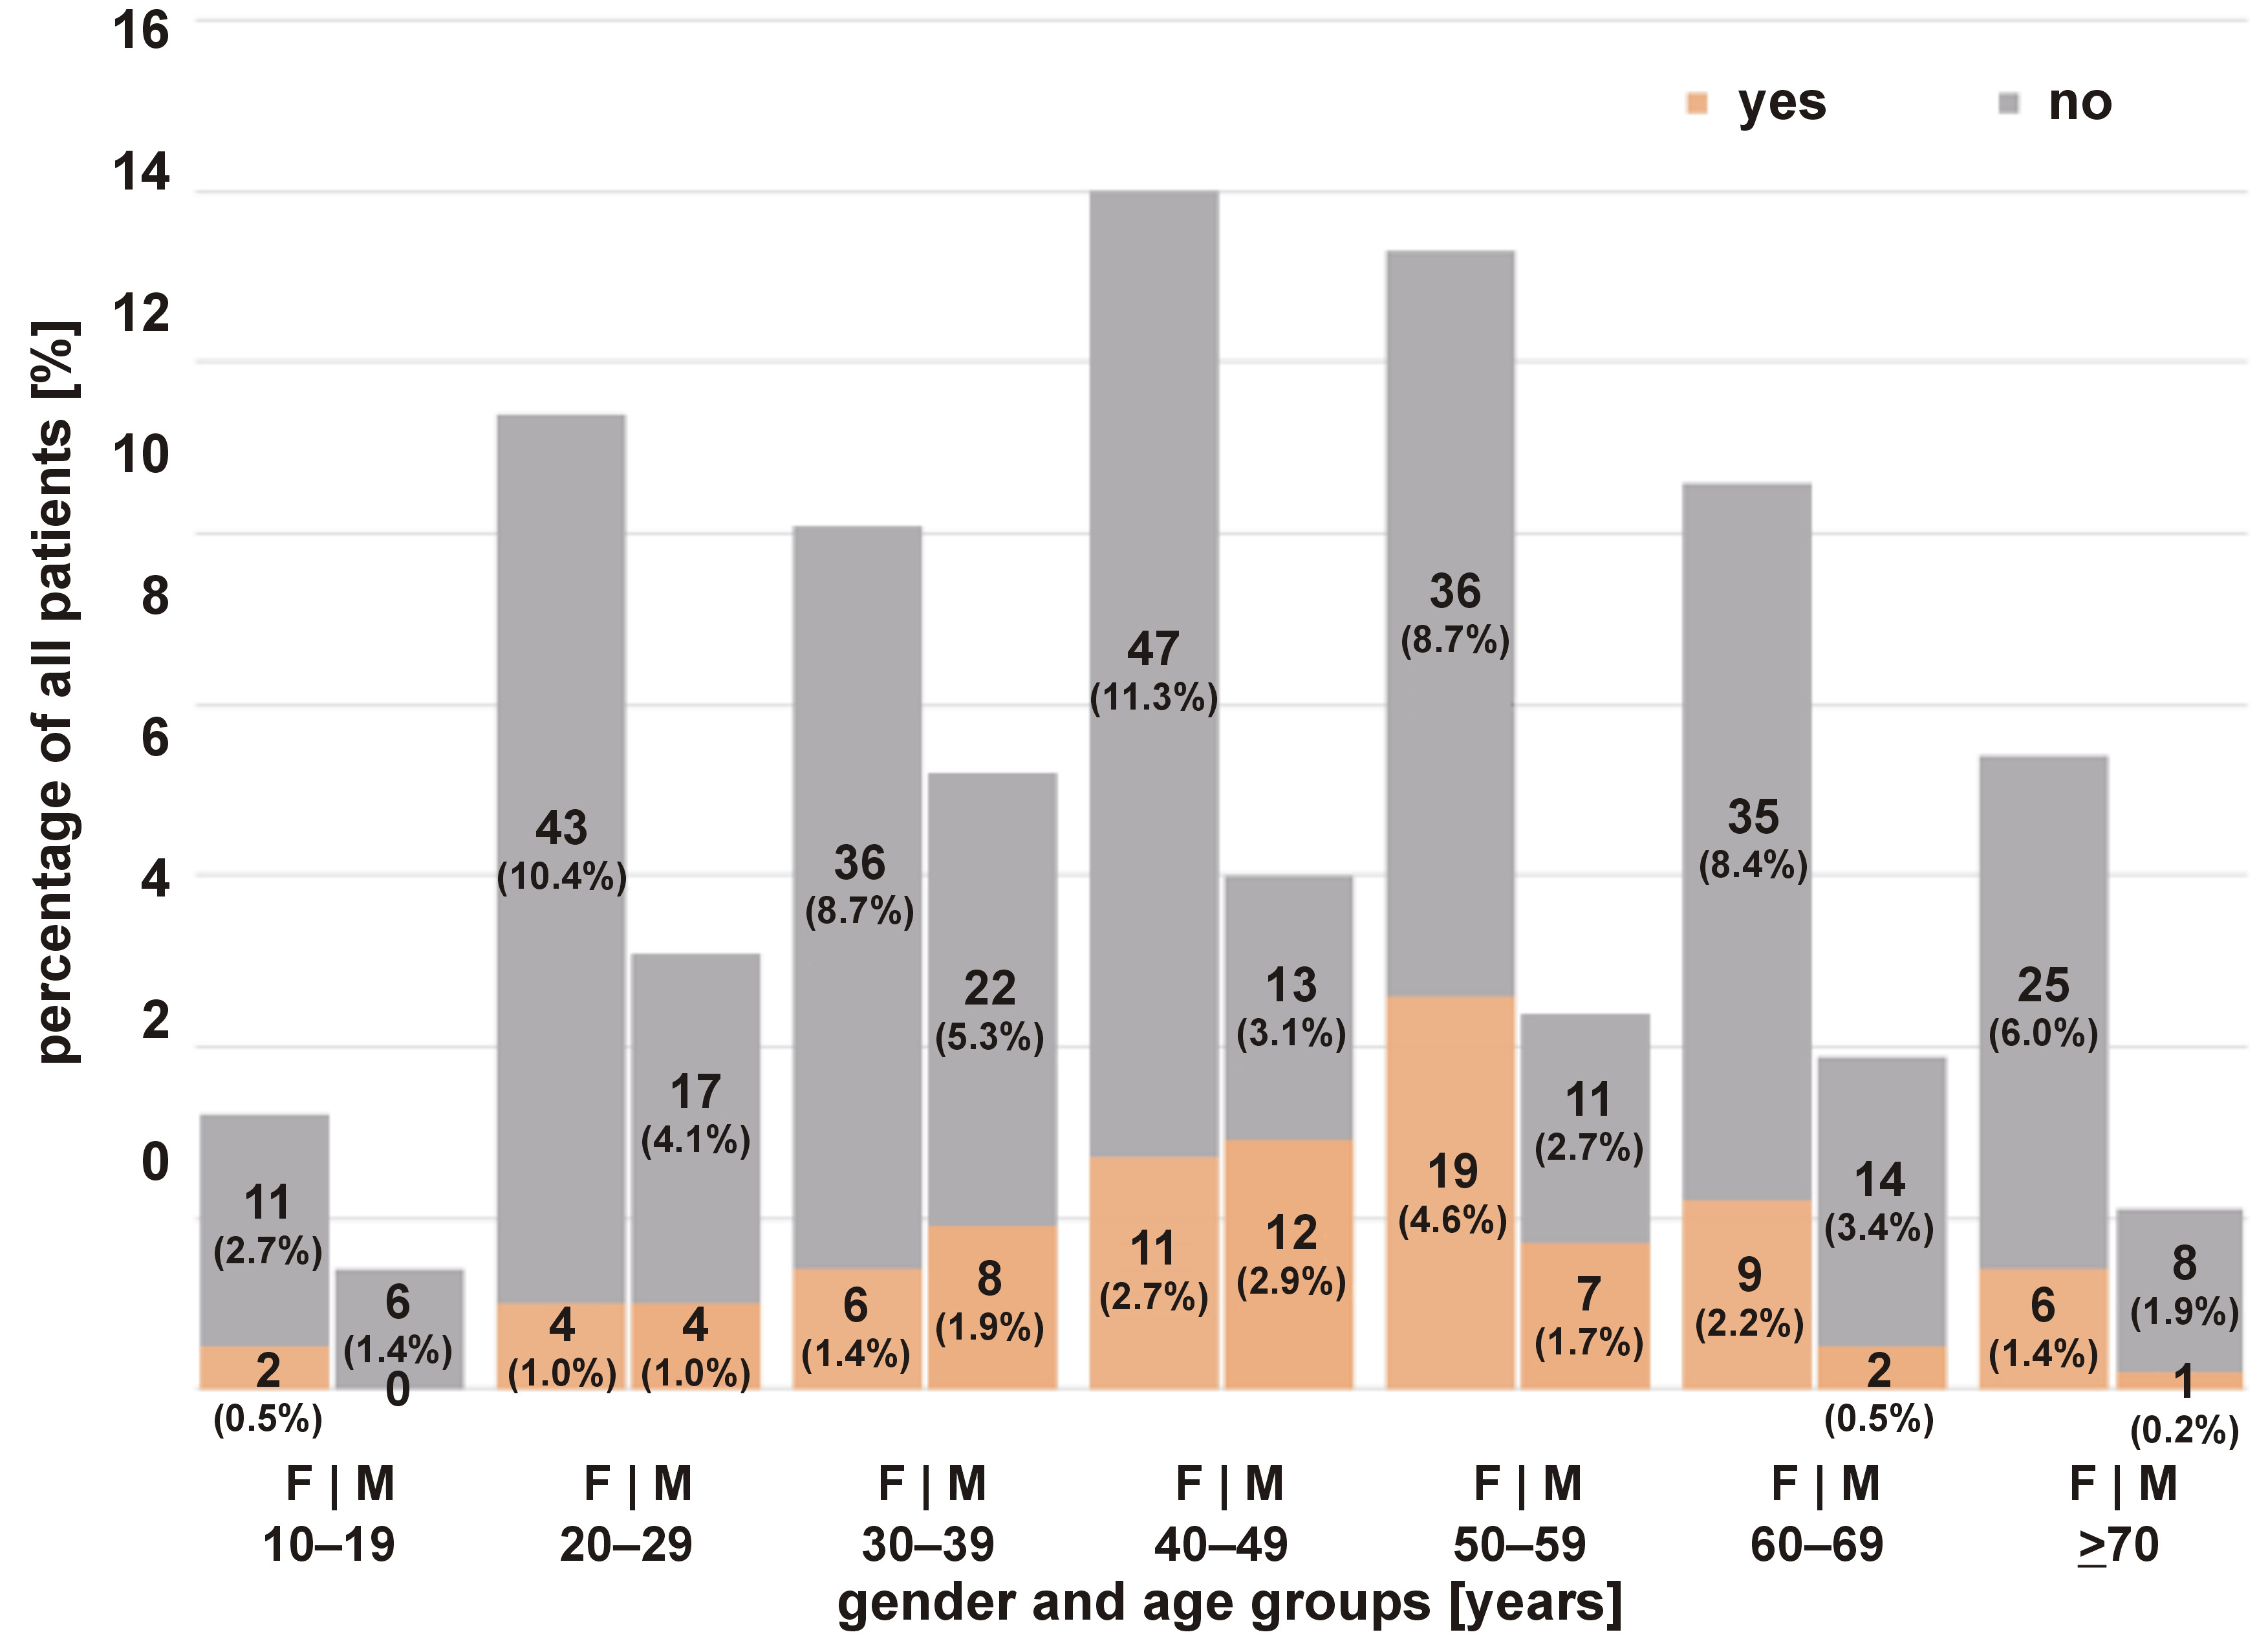
Table 2 elucidates the descriptive statistics of the study sample grouped by respiratory distress. Most patients did not report any respiratory distress (snoring/apnea during sleep) (n = 324; 78.1%). Among the 91 people who reported respiratory distress, the majority were females (n = 57; 62.6%). However, the relative percentage for each gender reveals that 19.7% of females had SRBD, while among males, 27.2% had SRBD. The highest percentage of SRBD was observed among the 50–59-year-old patients (n = 26; 35.6%). Furthermore, most were workers (n = 56; 61.5%), and most patients had a normal weight (n = 54; 59.3%). Surprisingly, the relative percentage of patients with SRBD was the highest among underweight patients (n = 7; 28.0%). Most people who reported respiratory distress registered typical pain intensity between 4 and 6 (n = 32; 35.16%). Women aged 50–59 years were the patients who suffered more from respiratory distress (n = 19; 4.6%). Only in the age range 30–49 years, more men than women suffered from respiratory distress (Figure 1).
Regarding the psychometric assessment, the number of patients who completed at least one of the case-finding questionnaires ranged from 45 (DCQ) to 415 (PHQ-4). The percentage of patients reaching a clinically relevant score (cut-off) ranged from 16.2% (PHQ-Stress) to 74.6% (PHQ-9) (Table 3). For all domains, the percentage of patients reaching a clinically relevant score was higher for the group with SRBD, except for DCQ (similar percentages). When comparing the groups with and without respiratory distress, the presence (or absence) of respiratory distress significantly influenced the score of GCPS-H, GCPS-B, GAD-7, IEQ, and PHQ-4 (p = 0.006, p = 0.009, p = 0.007, p = 0.023, and p = 0.004, respectively) (Table 4).
The analysis of variance of the mean psychometric domain scores grouped by gender, age group, employment status, BMI, typical pain intensity, and respiratory distress is shown in Table 5. Gender had a significant influence only on GCPS-H and GAD-7, with higher mean scores among women. There were no significant effects of age on the psychometric measures, except that older patient (≥70 years) had lower PHQ-Stress scores as compared to those aged 20‒59 years. The employment status had a significant influence on several measures: disabled patients had significantly higher scores as compared to workers on all questionnaires except DCQ and PHQ-9, and on IPQ, GCPS-H, GCPS-B, PCS, and PHQ-4 as compared to trainees. On the other hand, retired patients had significantly lower scores on IPQ, GCPS-H, GCPS-B, PCS, PHQ-4, and PHQ-Stress as compared to disabled persons, and also lower on PHQ-Stress than workers and higher on GCPS-B than trainees. There were no significant effects of BMI on the psychometric variables. Regarding the pain variable, significant effects of typical pain intensity were registered on all questionnaires except DCQ, IEQ, PHQ-9, and PHQ-Stress. The patients who reported a range of 7–10 had significantly higher scores as compared to patients with 0 and 1–3 pain intensity on half of the questionnaires (GCPS-H, GCPS-B, GAD-7, PCS, and PHQ-4, and IPQ, GPCS-H, GPSC-B, PCS, and PHQ-4, respectively). Patients with a reported pain intensity of 4–6 also had lower scores on IPQ and GCPS-H than patients with a pain intensity of 7–10, but significantly higher scores as compared to patients with 0 and 1–3 pain intensity on GCPS-B and PCS, and IPQ, GCPS-H and PCS, respectively. As for respiratory distress, it had a significant influence on GCPS-H, GCPS-B, GAD-7, IEQ and, PHQ-4.
Relationships between (1) gender, age, the employment status, BMI, typical pain intensity, and respiratory distress and (2) the psychometric-domain scores were assessed by multiple regressions (Table 6). The regression coefficients revealed that gender was positively associated with the scores of all questionnaires except IEQ and PHQ-9. This association was statistically significant for GCPS-H and GAD-7, meaning that being female resulted in higher GCPS-H and GAD-7 scores. Age was negatively associated with the score of all questionnaires except IEQ. This association was statistically significant for PHQ-9, meaning older persons had lower scores. The analysis for the employment status should be performed considering the reference category (retired). The positive regression coefficients of the disabled status mean that the psychometric scores were higher for this group than for the retired group, being most statistically significant of these coefficients. The training category exhibited mainly negative coefficients, suggesting that trainees had lower scores that retired people. This association was statistically significant for GCPS-B and PHQ-9. As for the working and unemployed categories, both positive and negative associations were found, but no statistically significant differences with regard to the reference category were obtained. The body mass index was negatively associated with GCPS-H, GCPS-B, IEQ, PHQ-4, and PHQ-Stress, and positively associated with the scores of the remaining questionnaires. Regarding the pain variable, typical pain intensity was positively associated with the scores of all questionnaires. This association reached significance for all questionnaires except DCQ, IEQ and PHQ-Stress, suggesting an association between pain and the psychometric scores. Finally, respiratory distress was positively associated with the scores of all questionnaires except DCQ. Suffering from respiratory distress resulted in significantly higher scores for GCPS-H, GAD-7, IEQ, and PHQ-4. Contrarily to the results of ANOVA, respiratory distress had no statistical significance on the GCPS-B model.
To assess which variables could accurately predict the score of each domain, multiple stepwise analyses (p ≤ 0.05 to enter, p ≥ 0.10 to remove) were performed (Table 7). Gender was positively associated with the score of GCPS-H. Age was negatively associated with the scores of PHQ-4, PHQ-9 and PHQ-Stress. Regarding the employment status, the disabled category was significantly positively associated with the scores of all questionnaires, with disabled people having higher scores than retired people. Trainees exhibited a statistically significant and negative coefficient for PHQ-9, showing that trainees had lower PHQ-9 scores than retired people. Finally, being unemployed resulted in higher IPQ scores than being retired. The body mass index was not significantly associated with any domain. Typical pain intensity was a predictor variable independently associated with the scores of all questionnaires except IEQ and PHQ-Stress. Respiratory distress was positively associated with the scores of GCPS-H, GAD-7, IEQ, and PHQ-4. As for DCQ, no variables were entered into the equation, meaning that none of the predictor variables was independently associated with its score.
Discussion
The study aimed to explore the relationship between SRBD (snoring and/or sleep apnea) and the level of psychosocial stress experienced by patients seeking care for persistent OFP and/or TMD. Hence, the relationship between the presence/absence of respiratory distress and psychometric measures as indicators of psychosocial stress and associated well-being were assessed. The effects of gender, age group, the employment status, BMI, and typical pain intensity on the psychometric scores were also analyzed.
Characterization of the study sample
We analyzed the impact of sleep-disordered breathing (SDB) in a large sample of 415 patients seeking care at an OFP unit, covering a broad age range. An initial comprehensive evaluation of all patients who completed WISE (Table 1). The gender proportion and age distribution of our study sample are similar to the ones reported in previous studies on patients seeking care for OFP.36 The majority of the patients were workers (n = 246; 59.3%) and a small percentage of them were disabled, either because of an illness or an accident (n = 32; 7.7%). In accordance with the trend observed in Switzerland during the last few years,37 more than half of the patients presented a normal weight (n = 255; 61.4%) and only 9.2% of the participants (n = 38) were obese. These results represent the wave of change observed in this country, which had the lowest prevalence of obesity in the years 2011–2016.37 Regarding the pain variable, on a 11-point numeric pain scale, the reported mean for typical pain intensity was moderate (4.82). Orofacial is one of the most common reasons for patients to seek treatment.38 Furthermore, patients with OFP or TMD frequently suffer from other comorbid pain symptoms.39 In line with this, most patients classified their typical pain intensity in a range between 4 and 6 (n = 161; 40.15%).
As WISE is a modular and flexible tool, several items can be added to it depending on the needs of a given clinic or research focus. Regarding this study, an item corresponding to snoring or apnea during sleep was already included, and allowed us to group the sample according to the presence or absence of these symptoms (Table 2). Even though both sleep apnea and snoring are generally more common in males,8, 22 our results showed that more than half of the patients suffering from these conditions were females (n = 57; 62.6%). This may be influenced by the fact that this clinical population refers to people who reported to a pain unit, therefore being mostly composed of women. However, when analyzing the percentage of SRBD among each gender, this was higher for males (n = 34; 27.2%) as compared to females (n = 57; 19.7%). As for the age range, most people reporting sleep-related respiratory distress were 40–59 years old. Considering that OSA is more dominant in middle-aged individuals22 and that the overall prevalence of snoring increases with age,8 our results highlight this age range as the most troubled. Additionally, the prevalence of snoring and OSA in adults is reported to reach a peak at the age of 40–60 years.3 The employment status was included as a relevant variable to characterize our sample, given the impact of SDB on work capability and its socioeconomic burden.31, 40 Most patients reporting snoring or sleep apnea were workers (n = 56; 61.5%), and retired people reported the second highest prevalence (n = 15; 16.5%), reflecting the underlying factor of age. The body mass index was also taken into consideration, as obesity is the most important reversible risk factor for OSA,41 and snoring has previously been associated with BMI.8 Approximately 60% of the group with respiratory distress reported a normal weight, and only 10% reported obesity. Moreover, Kerner and Roose reported in 2016 that the impact of BMI on OSA severity decreases with age.42 The fact that the percentage of people with SRBD was the highest among underweight patients (relative percentage: 28%) further reinforces a weak relationship between BMI and sleep-related respiratory distress in our study sample.
We further analyzed the group which suffered more from sleep-related respiratory distress according to gender and age range. This group encompassed women aged 50–59 years (n = 19; 4.6%), and for the same age range, the percentage for men was 1.7% (n = 7) (Figure 1). This age range is of particular interest for women, as menopause typically occurs between the age of 40 and 60 years, and the literature shows important differences in the prevalence and symptoms of SDB between pre- and post-menopausal women.43, 44
Psychometric assessment
In this study, we used a variety of features as measures of psychosocial stress, such as depression, anxiety, mental health, distress, and pain features, which are commonly associated with poor well-being.45 Among the numerous relatively brief self-report questionnaires that have been developed and validated to assess psychosocial stress, the ones presented herein were used in WISE, and serve as proxies for well-being.
The number of patients who completed at least one of the case-finding questionnaires ranged from 45 (DCQ) to 415 (PHQ-4) (Table 3). As PHQ-4 is part of the WISE checklist, all patients completed it, and approx. 20% of the study sample scored above the cut-off, indicating the need for further expert evaluation. The sample prevalence of clinically relevant psychometric scores was in descending order: 28.0% (GCPS-H); 21.2% (PHQ-9); 19.8% (PHQ-4); 17.8% (PCS); 15.2% (GAD-7); 13.7% (GCPS-B); 11.8% (IEQ); 4.3% (PHQ-Stress); and 3.4% (DCQ). No cut-off value has been reported for IPQ. About 36% of the study sample had clinically relevant scores for GAD-7 and PHQ-9, which means that approx. 1 in 3 patients had potential impairment associated with general anxiety and depression assessed by those 2 questionnaires, warranting further clinical assessment. Interestingly, only a relatively small percentage of the study sample reported a medium or severe burden by psychosocial stress, assessed by PHQ-Stress (4.3%). About 1 in 4 patients experienced moderate to severe limitation due to craniofacial pain, and about 14% due to pain in other body parts. Considering our specific clinical population, nearly 18% of patients reported pain catastrophizing scores above the cut-off value, which relates to the percentage reported in a similar previous study.36 To better understand these results, a further assessment of the psychometric scores was performed according to the presence or absence of sleep-related respiratory distress.
Table 4 indicates that for all domains, the percentage of patients reaching a clinically relevant score was higher for the group with respiratory distress, except for DCQ, where the percentages for the 2 groups were similar. Furthermore, the presence of respiratory distress was found to significantly influence the scores of GCPS-H, GCPS-B, GAD-7, IEQ, and PHQ-4. Our results are supported by current literature, which has shown that QoL is impaired in OSA patients as compared to non-OSA patients,46 and that the association between OSA and depression and anxiety is clinically relevant.15 Indeed, the QoL of OSA patients and their bed partners is shown to improve when sleep apnea is successfully treated.46 As for snoring, even though its clinical relevance is yet to be fully clarified,7 the risk of daytime anxiety and the risk of depression for both snorers and their sleeping partners are reported to be increased.8 It should be noted that these relationships have been found both in adult and pediatric populations.22 The influence of respiratory distress on the measures of persistent pain was not surprising, as SDB can be related to various types of pain, such as headache.47 In fact, GCPS-related disability scoring has been suggested as a simple screening instrument to identify TMD patients with different degrees of health burdens (e.g., sleep conditions), correlated with general well-being.48The IEQ is mainly related to the presence of an injury. However, considering that it contributes to prolonged emotional stress, we recognize it can be related to poor sleep quality, which may partly explain our results. Various lines of evidence also point to an increased prevalence of psychosis and dementia in patients with sleep apnea.49
Psychometric assessment according to
the sample characteristics
The performed analysis of variance allowed us to further understand the effect of respiratory distress, gender, age, the employment status, and BMI on the psychometric scores for the entire study population (Table 5).
Great efforts have been made to clarify sex differences in emotional processing, being now widely accepted that women experience emotions differently than men. Many studies focusing on the association between gender and depression in OSA patients, for instance, established that depression was more prevalent in females than in males, with the same tendency observed for anxiety symptoms.15 In our study, women suffered more general anxiety than men, which supports the abovementioned notion. No significant effects of age on the psychometric measures were observed, except that older patients (>70 years) had lower PHQ-Stress scores as compared to those aged 20‒59 years. This is in line with a recent paper which reported low PHQ scores in young adulthood, an increase during middle age, followed by a new decrease in the scores for older age.20 Regarding the effect of the employment status, several measures were higher for disabled patients as compared to workers (all questionnaires except DCQ and PHQ-9) and trainees (IPQ, GCPS-H, GCPS-B, PCS, and PHQ-4), while workers reported higher PHQ-Stress scores in comparison with retired people. Retired people also had significantly lower scores on IPQ, GCPS-H, GCPS-B, PCS, PHQ-4, and PHQ-Stress as compared to disabled persons, and higher on GCPS-B than trainees. Even though the relationship between these employment conditions and psychosocial stress is still to be refined, these results highlight the need for clarifying the impact of employment-related factors. The literature shows that low income, unemployment and professional requirements are often associated with sleep problems, ultimately affecting the individual’s QoL.19 A better recognized relation is described for the PHQ scores, with OSA workers reporting higher job-related stress.50 Nevertheless, considering that disabled patients suffered from an illness or accident in the past, which prevents them from working and affects their daily activities, it is not surprising that this status was associated with a higher psychosocial burden. What is surprising is that BMI had no significant effect on the psychometric scores, going against a recent study which found a strong positive correlation between snoring and BMI in both sexes.8 However, we should have in mind the characteristics of our study sample, which was relatively healthy as discussed above. The significant effect of typical pain intensity on the scores of most questionnaires met our expectations, and is supported by the relationship described in the literature between pain intensity, pain-related disability and QoL.38
As for respiratory distress, the analysis of variance supported the previous findings of the influence of respiratory distress on the GCPS-H, GCPS-B, GAD-7, IEQ, and PHQ-4 scores. The statistical significance of these relationships is further explored in the next section.
Associations between respiratory distress and the well-being scores
Relationships between the independent variables, including not only respiratory distress, but also gender, age, the employment status, BMI, and typical pain intensity, and the dependent variable (the psychometric scores), were examined by multiple regression analysis. The directionality of the effects of each variable is presented in Table 6, whereas the best combination of predictor variables for each questionnaire is displayed in Table 7.
The key finding of our analysis was that respiratory distress was positively associated with the scores of all domains except DCQ, being a statistically significant predictor for GCPS-H, GAD-7, IEQ, and PHQ-4. These observations are based on the respective p-values. The findings of these regression analyses further support the relation described in previous epidemiologic studies, which have consistently demonstrated that SDB is associated with depression and anxiety symptoms.15, 42 On the other hand, they confirm the existence of an association between pain and sleep disturbance, which has been a focus of research since the 1990s, when Affleck and colleagues reported a bidirectional link between pain perception and sleep quality.51 The fact that SDB may be a frequent cause of headaches, which was a checklist item included in WISE, may justify why respiratory distress was found to be predictive of pain-related disability due to pain in the head.44 Moreover, current literature provides evidence that SDB tends to exacerbate persistent pain, particularly craniofacial pain, which affects sleep quality.47, 52 Likewise, hypoxemic-related mechanisms seem to be involved in such a relationship, also impacting critical cardiometabolic aspects.53 Whether vitamin D, electrolytic balance and uric acid concentration could be related to that dynamics has also been a matter of discussion with potentially important clinical implications.54 Gender was found to have a statistically significant relation only with GCPS-H. Given the existence of gender differences in pain sensitivity and processing, with women seeking treatment more often than men, its impact is well-supported.54, 55 In fact, the female gender shows a higher prevalence for almost all pain problems affecting the head, neck and OFP regions.56 The positive coefficients of the disabled status for all domains highlight this condition as determinant for worsened psychosocial well-being as compared to retired people. Considering that the unemployed and training status also showed significant coefficients, our findings emphasize the need to screen for employment status information to optimize clinical management. Typical pain intensity was a significant predictor of the scores of all questionnaires except DCQ, IEQ and PHQ-Stress. Temporomandibular disorders and OFP share certain features and are associated with chronic pain conditions, such as tension headaches and fibromyalgia, being characterized by biopsychosocial stress and complaints, including fatigue, anxiety and depression.57 As for age, it was found to be a statistically significant predictor for PHQ-4, PHQ-9 and PHQ-Stress. The fact that some of these predictors were absent in certain models should not be a reason for discrediting the previous results. This may be explained by a small sample size or the need for a different model to observe those relations. Nonetheless, the models presented herein underscore the influence of the selected variables on the psychometric measures. Within this context, the negative psychosocial impact of abnormal respiratory patterns on the patient’s well-being should be considered in light of other confounding factors, such as age, gender and pain features.
Limitations
The present study has several limitations that must be considered when interpreting our results. As is common in cross-sectional studies, causality cannot be inferred from the observed relationship between psychosocial stress and sleep-related respiratory distress. Another limitation is our reliance on self-reported snoring and sleep apnea, which may have introduced reporting bias. Additionally, due to the structure of WISE, we did not distinguish between patients with simple snoring and those with sleep apnea, nor did we assess disease severity.
Although OSA is common and should be suspected in all sleepy snorers, it is well established that a proportion of individuals with OSA do not snore, and not all snorers have coexisting OSA. Furthermore, caution is warranted when generalizing our findings to a broader population, as our sample consisted of a clinical population presenting to an OFP/TMD unit. Moreover, children and adolescents were assessed using instruments primarily developed for adult populations. Therefore, future studies should aim to include broader and more representative samples, as well as age-appropriate, validated assessment tools for younger populations.
These limitations should be carefully considered in future research investigating SDB and psychosocial stress. Despite these constraints, the present findings have important practical implications, as they underscore the value of systematically assessing sleep-related variables in clinical evaluations.
Conclusions
In this study cross-sectional study, about 22% of the evaluated patients reported some form of SRRD. Moreover, SRBD were associated with higher psychometric scores, suggesting a close relationship between sleep related respiratory difficulties and psychosocial impairment.
Ethics approval and consent to participate
According to the Swiss law, the analysis of strictly anonymized data does not require the approval by an ethics committee. Only data from patients who had given consent to the use of their anonymized data for research was used.
Data availability
The datasets supporting the findings of the current study are available from the corresponding author on reasonable request.
Consent for publication
Not applicable.
Use of AI and AI-assisted technologies
Artificial intelligence (AI) was used as an adjunctive tool for English language editing and for the preparation of the graphical abstract. The authors reviewed and take full responsibility for the final content.