Abstract
Background. Insulin-independent type 2 diabetes mellitus (DM2) causes numerous organ complications, some of which involve the oral cavity. However, to date, the causes of reduced salivary secretion in patients with DM2 remain unclear.
Objectives. The present study is the first to evaluate the salivary inflammatory and anti-inflammatory profiles in the salivary glands of rats with DM2.
Material and methods. Twenty male Wistar Cmdb:WI rats were randomly divided into 2 groups: a control group and a DM2 group. Type 2 diabetes mellitus was induced by feeding the rats a high-fat diet and administering a single intraperitoneal injection of low-dose streptozotocin (35 mg/kg bw). Salivary gland function was evaluated using pilocarpine-stimulated salivary flow rate and α-amylase activity. The salivary inflammatory profile was assessed using a multiplex enzyme-linked immunosorbent assay (ELISA).
Results. Type 2 diabetes mellitus caused dysfunction of the parotid glands (PGs) and submandibular glands (SMGs), manifested by a reduction in the salivary flow rate and a decrease in salivary α-amylase activity. In DM2 rats, significantly higher levels of pro-inflammatory cytokines (interleukin (IL)-1α, tumor necrosis factor alpha (TNF-α), IL-6, IL-7, IL- 18), anti-inflammatory cytokines (IL-10), Th1 (IL-12) and Th17 (IL-17) cytokines, chemokines (monocyte chemoattractant protein (MCP)-1α/chemokine ligand 3 (CCL3), macrophage inflammatory protein (MIP)-1α/CCL3, regulated on activation, normal T-cell expressed and secreted chemokine (RANTES)/CCL5, MIP-3α/CCL20, growth-regulated oncogene (GRO)-1α/CCL1), and growth factors (macrophage colony-stimulating factor (M-CSF), granulocyte macrophage colony stimulating factor (GM-CSF) and vascular endothelial growth factor (VEGF)) were observed, as well as increased activity of salivary pro-inflammatory enzymes (myeloperoxidase (MPO), β-D-glucuronidase (GLU)). Evaluation of the inflammatory profile did not indicate the dominance of any branch of the immune system, with the PG being the main source of salivary cytokines, chemokines and growth factors. The activity of lysosomal exoglycosidases and extracellular matrix metalloproteinases (MMPs) involved in salivary gland remodeling was significantly higher in the PGs and SBGs of DM2 rats compared with controls.
Conclusions. Increased levels of salivary inflammatory biomarkers accompanied by decreased salivary secretory function may indicate the contribution of inflammation to salivary gland dysfunction. During the course of DM2, impairment predominantly affects PGs.
Keywords: inflammation, salivary glands, type 2 diabetes, glycoconjugates
Introduction
Diabetes mellitus (DM) constitutes a group of metabolic diseases characterized by elevated blood glucose levels. The discovery of the role of the pancreas and the hormone insulin has enabled a more accurate understanding of the causes of the disease and the development of more effective treatments.1, 2, 3 Unfortunately, epidemiological studies indicate a continuous increase in the incidence of DM. Insulin-independent type 2 diabetes mellitus (DM2) is the most common form of DM, accounting for approx. 90–95% of all cases, and primarily affecting elderly or middle-aged individuals.4 The disease is strongly influenced by lifestyle (e.g., dietary inadequacies, lack of exercise, low health awareness) and socioeconomic factors (e.g., limited access to medical care).5 According to current knowledge, the underlying causes of DM2 are obesity and insulin resistance, i.e., reduced sensitivity of target tissues (liver, adipose tissue, skeletal muscle, or brain) to insulin.6 Regardless of etiology, patients with DM2 are at risk of developing serious organ complications. These include specific diabetic complications such as retinopathy (eye damage), nephropathy (kidney damage) or neuropathy (damage to the nervous system), as well as non-specific cerebral, peripheral vascular and cardiac complications that also occur in individuals without DM.7 Although the exact pathogenesis of these complications is not fully understood, their common feature is an active inflammatory process.8
The oral cavity is also susceptible to DM2-related complications.9 Patients with DM2 are more likely to develop periodontitis, which may progress to alveolar bone loss and gingival attachment atrophy. Several studies have shown that periodontitis-induced bacteremia increases the production of pro-inflammatory cytokines and reactive oxygen species (ROS), which can exacerbate insulin resistance and impair metabolic control.9, 10 Therefore, DM negatively affects periodontal status, while periodontitis may contribute to disease progression.10 Impaired saliva secretion represents another clinical problem in patients with DM.11 In these individuals, the qualitative composition of saliva and the secretory activity of salivary glands are changed.12 Reduction in the secretion of unstimulated and stimulated saliva (hyposalivation) increases the incidence of caries and periodontal disease.10 In addition, dry oral mucous membranes (xerostomia) and hyposalivation significantly increase the risk of mechanical damage, aphthous ulcers and fungal infections, such as candidiasis.13 Burning mouth syndrome and oral-facial syndrome are also associated with xerostomia and hyposalivation and are frequently reported by patients with DM.14 Although antidiabetic medications may influence salivary secretion, the mechanisms underlying hyposalivation in patients with DM2 remain unclear.
Saliva constitutes the fluid environment of the oral cavity and consists of salivary gland secretions, gingival crevicular fluid, exfoliated epithelial cells, leukocytes, and microorganisms. The major salivary glands play a key role in saliva secretion.15 The parotid glands (PGs) produce approx. 20% of total salivary volume and secrete serous saliva with high water and enzyme content. The largest volume of saliva (70%) is excreted by the submandibular glands (SMGs). This secretion contains enzymes and mucus and, thus, has a medium density. In contrast, saliva secreted by the sublingual glands accounts for only 5% of total salivary secretion.15 In our previous study, we demonstrated that ceramide accumulation in the salivary glands of rats with obesity and insulin resistance induces oxidative stress, inflammation and apoptosis by affecting pro-oxidant enzymes and the mitochondrial respiratory chain.16, 17, 18 Importantly, ROS production, nitration of salivary proteins and peroxidation of membrane lipids were more pronounced in the PGs of rats with insulin resistance induced by high-fat or high-carbohydrate diets.18, 19 However, studies using DM2 models remain limited. Although insulin resistance is a major factor in the development of DM2, progressive deterioration of insulin sensitivity of target tissues ultimately leads to long-term hyperglycemia and inflammation, resulting in overt DM2 and numerous organ complications. Micro- and macroangiopathic complications are the main cause of reduced quality of life and increased mortality in patients with DM2.20, 21 Given the central role of inflammation in DM2 progression in target tissues, it is plausible that inflammatory mechanisms also contribute to salivary gland hypofunction, similar to other systemic inflammatory disorders, such as Sjögren’s syndrome,22 chronic circulatory insufficiency,23 Hashimoto’s thyroiditis,24 or psoriasis.25 Therefore, in the present study, we aimed to assess the inflammatory profile of the PGs and SMGs in rats with DM2, as well as the activity of lysosomal enzymes and extracellular matrix metalloproteinases (MMPs) involved in salivary gland tissue remodeling.26 Our findings may contribute to a better understanding of the causes of salivary gland hypofunction in DM2, which significantly impairs patients’ quality of life.
Material and methods
Study sample
The study was conducted in accordance with the “Guide for the Care and Use of Laboratory Animals” by the National Academy of Sciences, and was approved by the Local Ethical Committee for Animal Experiments of the University of Warmia and Mazury in Olsztyn, Poland (approval No. 62/2021).
The experiment was performed on 20 male Wistar Cmdb:WI rats from a non-breeding, genetically heterogeneous outbred herd, with an initial body weight of approx. 180–200 g (5–8 weeks old). Only male rats were included to eliminate potential confounding effects of sex hormones.27 The study was performed at the Experimental Medicine Centre of the Medical University of Bialystok, Poland. Cages for the animals were individually ventilated, ensuring the highest sanitary rigor. The rats were housed under standard laboratory conditions (21 ±2°C, 12 h light/12 h dark cycle, 60–80% humidity), with free access to water and food.
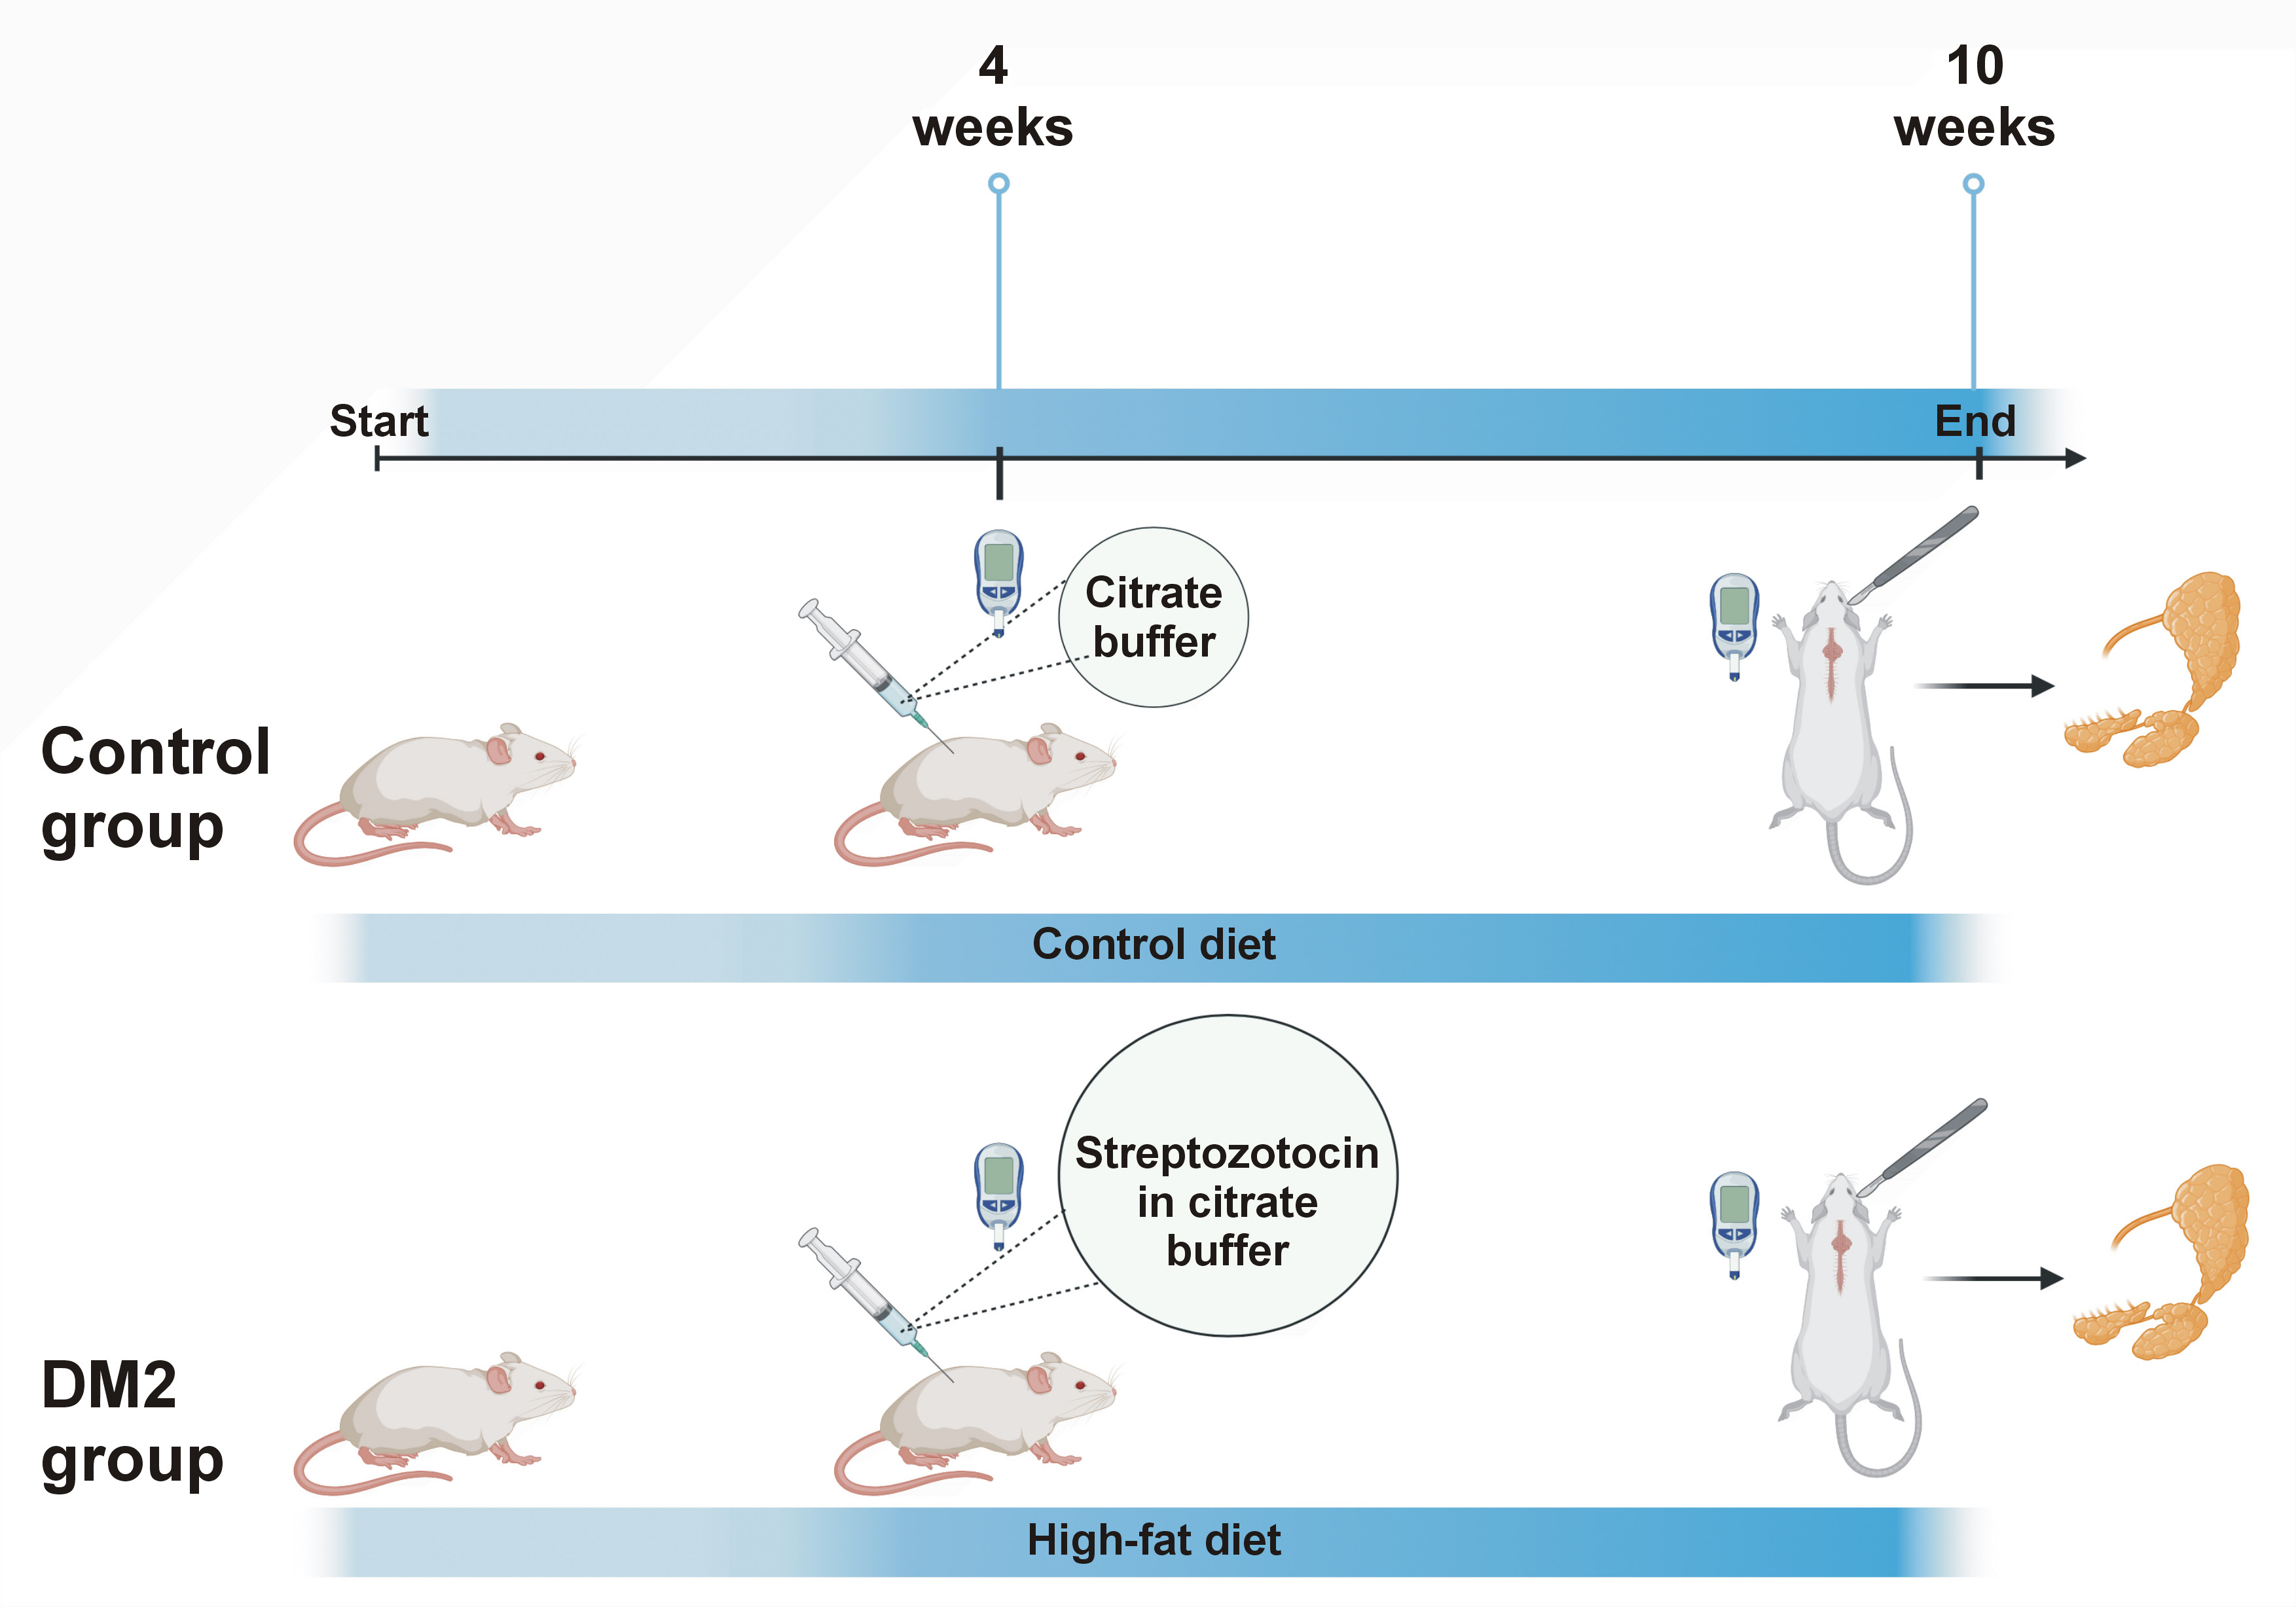
After a one-week acclimatization period, the rats were randomly divided into 2 equal groups (Figure 1):
– C (control group (n = 10)) – rats fed a standard diet (D12450J; Research Diets, New Brunswick, USA) containing 10 kcal% fat, 70 kcal% carbohydrates and 20 kcal% protein for 10 weeks and receiving a single intraperitoneal injection of citrate buffer (pH 4.5) at week 4;
– DM2 (type 2 diabetes group (n = 10)) – rats fed a high-fat diet (D12492; Research Diets) containing 60 kcal% fat, 20 kcal% carbohydrates and 20 kcal% protein for 10 weeks and receiving a single intraperitoneal injection of streptozotocin (35 mg/kg bw) in citrate buffer (pH 4.5) at week 4.
Induction of DM2 by a high-fat diet and a single intraperitoneal injection of low-dose streptozotocin constitutes a well-established experimental model.28, 29, 30 Type 2 diabetes mellitus was confirmed 72 h after the administration of streptozotocin by measuring fasting blood glucose levels.3, 31 The measurements were performed using a strip glucose meter (ACCU-CHEK® Active; Roche, Mannheim, Germany) in tail blood obtained by needle puncture or tail-tip incision, depending on the anatomical conditions of the animal. Caudal blood glucose levels were ≥200 mg/dL in all rats from the study group.3, 31
After 10 weeks, the rats were fasted for 6 h. The animals had their tail blood drawn to measure glucose concentration. Then, pentobarbital sodium (80 mg/kg bw) was administered intraperitoneally. To assess salivary secretion, rats were injected intraperitoneally with pilocarpine hydrochloride (5 mg/kg bw). After 5 min, a lignin swab was placed under the tongue.32, 33 Following another 5 min, the swab was removed, and the rate of saliva production was calculated based on the difference between final and initial swab weights, assuming that 1 g of saliva corresponds to 1 mL.
Animals under anesthesia had blood drawn from the abdominal aorta and left ventricle. Blood samples were centrifuged at 3,000 × g (4°C, 10 min) to obtain serum. The salivary glands (SMGs and PGs) were excised by experienced technicians, cleaned and weighed. After skin incision and muscle dissection, glands were carefully visualized, excised with surgical scissors and rinsed in phosphate buffered saline (PBS (pH 7.0)). Excess adipose tissue was removed if present.32, 33 The salivary gland index was calculated as the ratio of gland weight to total body weight and expressed as a percentage.32 Tissues were snap-frozen in liquid nitrogen and stored at −80°C for no longer than 6 months until analysis.
Biochemical determinations
Unless stated otherwise, all reagents were purchased from Sigma-Aldrich (Nümbrecht, Germany) or Sigma-Aldrich (St. Louis, USA). Total protein concentration was measured using the Pierce™ BCA Protein Assay Kit (Thermo Fisher Scientific, Rockford, USA), according to the manufacturer’s instructions. The absorbance/fluorescence was measured using a multimode microplate reader (Infinite® M200 PRO; Tecan Group Ltd., Männedorf, Switzerland).
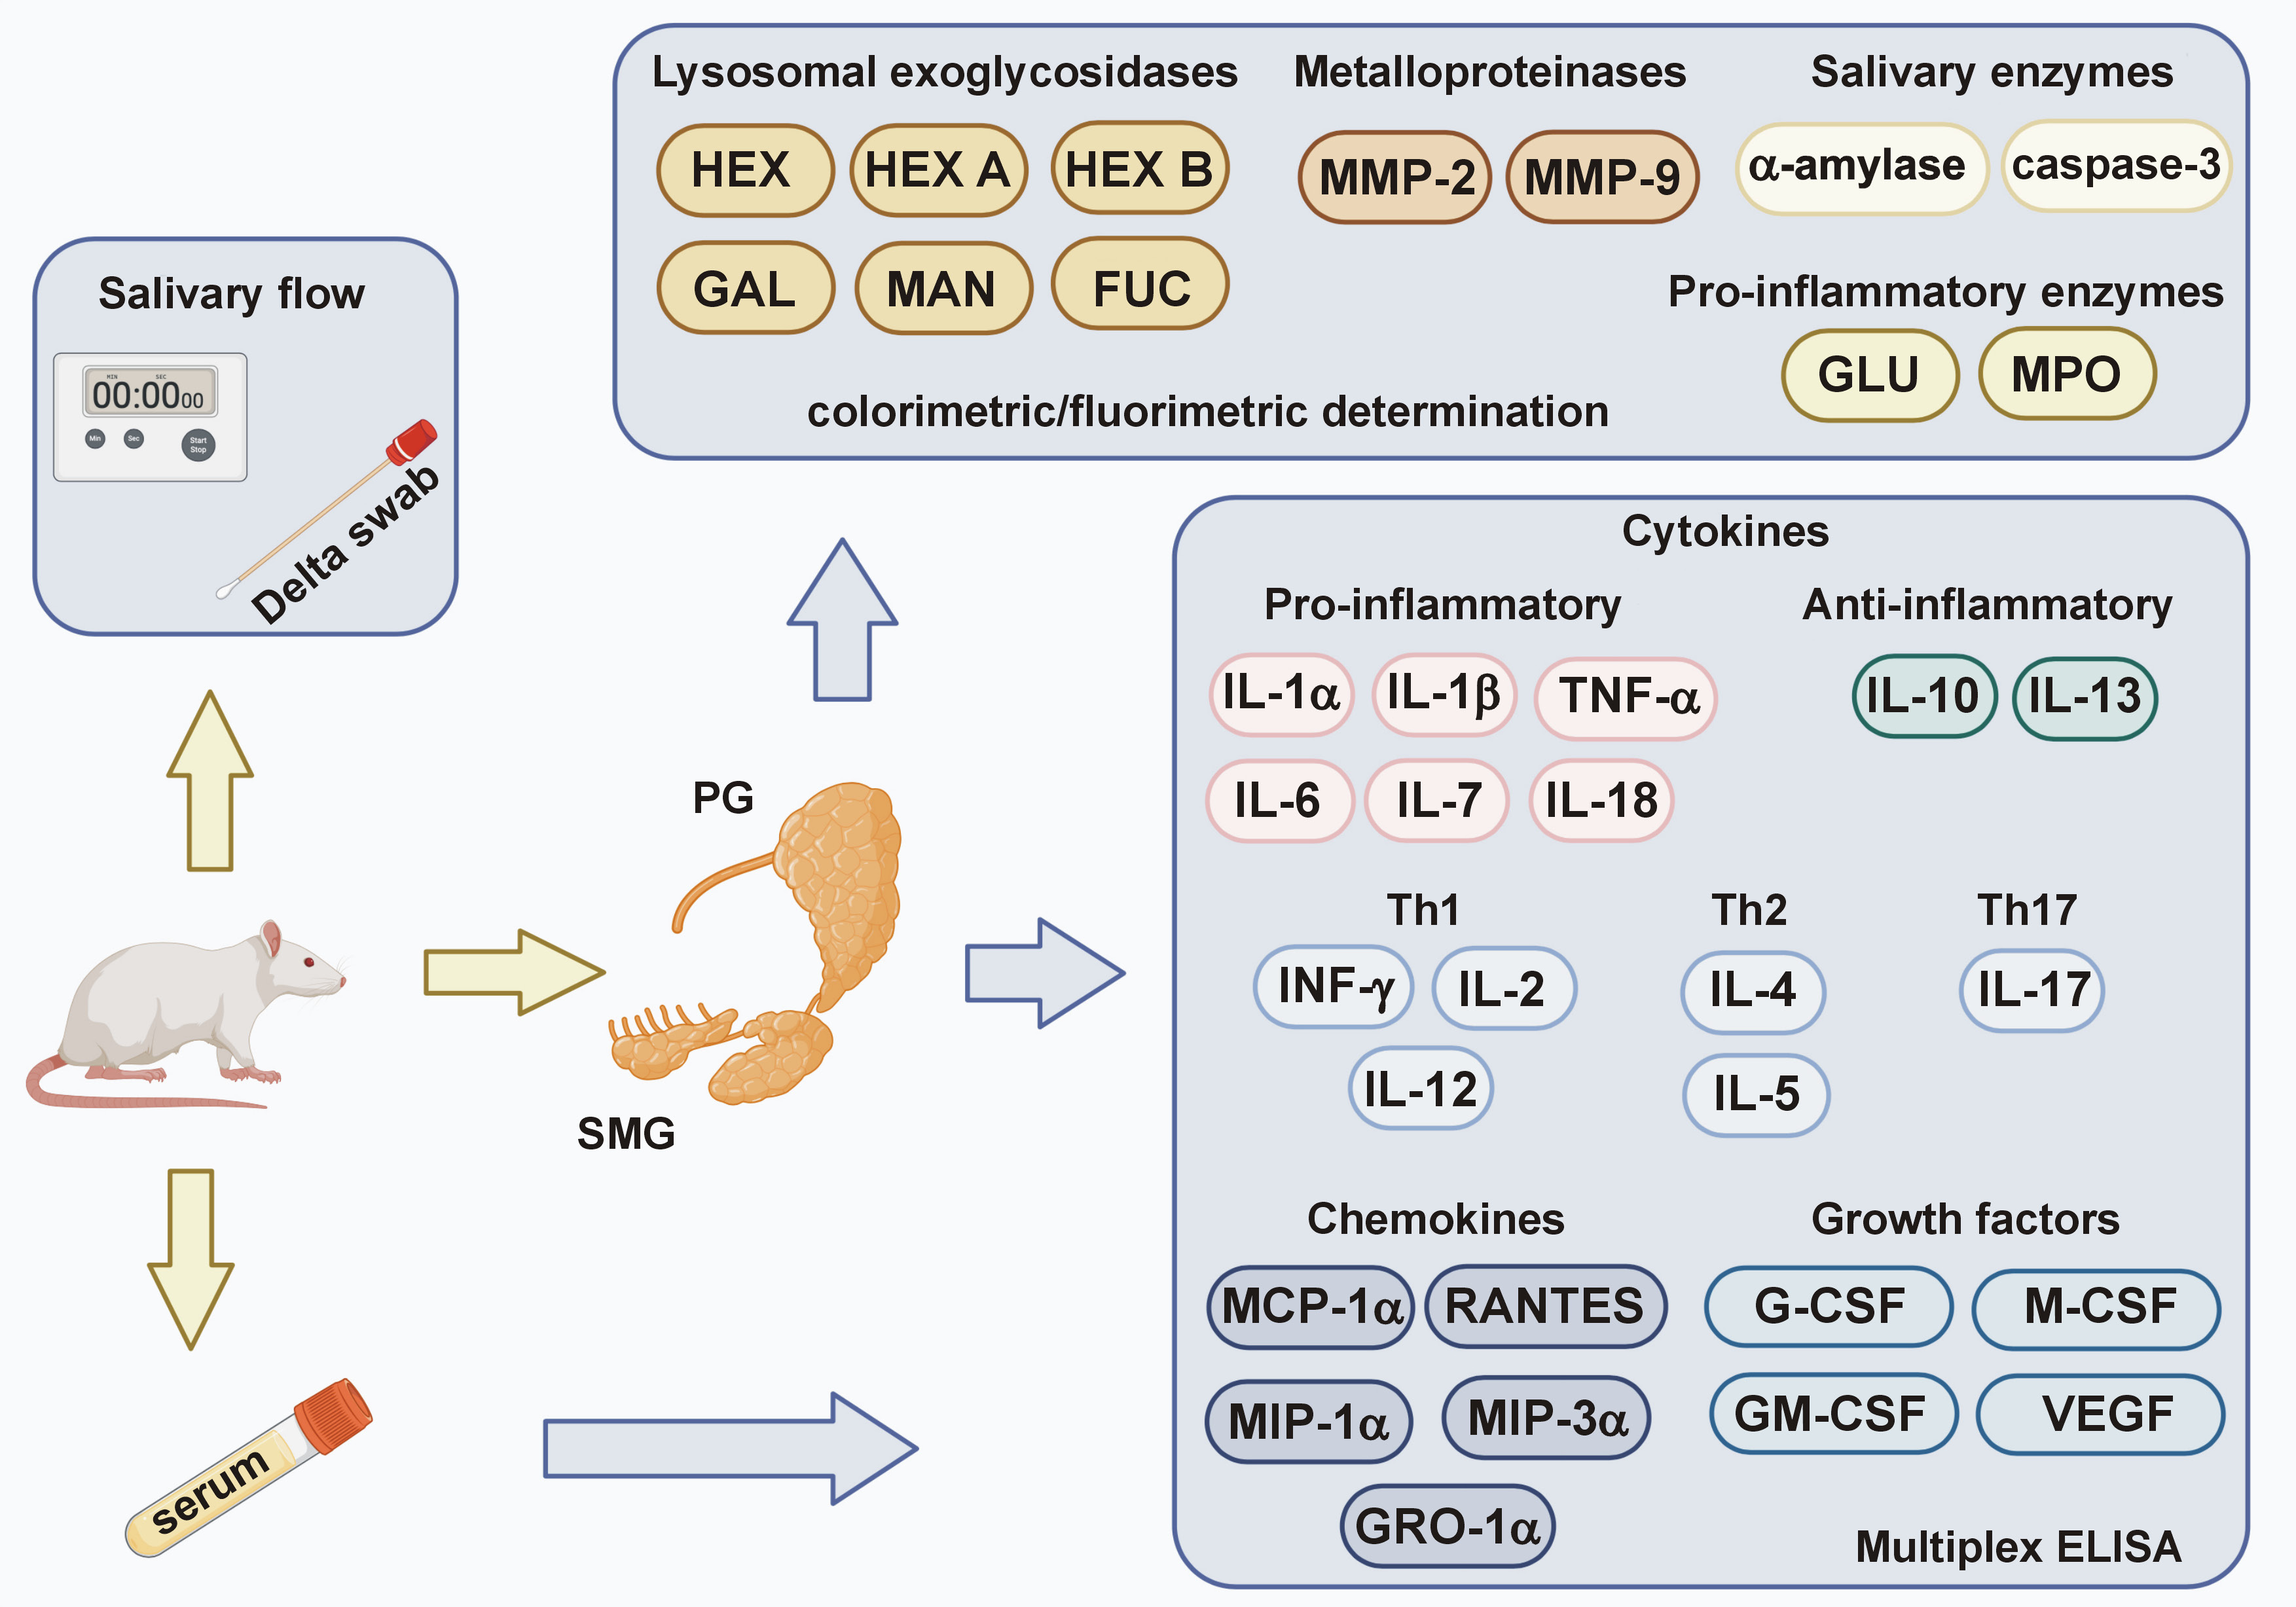
Salivary gland homogenates were analyzed for: (1) salivary α-amylase activity (Enzyme Commission (EC) number 3.2.1.1); (2) concentrations of pro-inflammatory cytokines (interleukin (IL)-1α, IL-1β, tumor necrosis factor alpha (TNF-α), IL-6, IL-7, IL-18), anti-inflammatory cytokines (IL-10, IL-13), Th1 cytokines (interferon gamma (INF-γ), IL-2, IL-12), Th2 cytokines (IL-4, IL-5), Th17 cytokines (IL-17), chemokines (monocyte chemoattractant protein (MCP)-1α/chemokine ligand (CCL)2, macrophage inflammatory protein (MIP)-1α/CCL3, regulated on activation, normal T-cell expressed and secreted chemokine (RANTES)/CCL5, MIP-3α/CCL20, growth-regulated oncogene (GRO)-lα/CXCL1), growth factors (granulocyte colony stimulating factor (G-CSF), macrophage colony stimulating factor (M-CSF), granulocyte macrophage colony stimulating factor (GM-CSF), vascular endothelial growth factor (VEGF)), and other DM2 biomarkers (ghrelin, glucagon, leptin, IL-12p40, MIP-2); (3) pro-inflammatory enzyme activity (β-D-glucuronidase (GLU, EC 3.2.1.31) and myeloperoxidase (MPO, EC 1.11.1.7)); (4) activity of enzymes involved in salivary gland remodeling (lysosomal exoglycosidases: N-acetyl-β-D-hexosaminidase (HEX, EC 3.2.1.52), its isoenzymes (HEX A and HEX B), β-D-galactosidase (GAL, EC 3.2.1.23), α-D-mannosidase (MAN, EC 3.2.1.24), α-D-fucosidase (FUC, EC 3.2.1.51), and extracellular MMPs: MMP-2 (EC 3.4.24.24), MMP-9 (EC 3.24.35)); (5) pro-apoptotic enzyme activity (caspase-3, EC 3.4.22.56) (Figure 2).
Left salivary glands were used for α-amylase, MPO and inflammatory profile analyses, while right glands were used for other assays. Tissue homogenization was performed on the day of analysis. Salivary glands were slowly thawed on ice, then divided into smaller pieces and diluted (1:10, w:v).16, 17 For the assessment of α-amylase activity, tissues were homogenized in 0.02 M of phosphate buffer (pH 6.9), containing 6.7 mM of NaCl,34, 35 for the assessment of MPO activity – in hexadecyltrimethylammonium bromide (HTAB) buffer (0.5% HTAB in 50 mM of phosphate buffer (pH 6.0)),36 for the evaluation of acid lysosomal glycosidases – in 0.15 M of KCl containing 0.2% Triton X-100,35 for the analysis of MMPs activity – in TNC buffer (pH 7.5) consisting of 50 mM of tris(hydroxymethyl)aminomethane (Tris), 0.15 M of NaCl, 10 mM of CaCl2, and 0.02% NaN3,37 and for the assessment of caspase-3 activity, tissues were homogenized in caspase extraction buffer (pH 7.5) containing 25 mM of 4-(2-hydroxyethyl)piperazine-1-ethanesulfonic acid (HEPES), 5 mM of MgCl2, 1 mM of ethylenediaminetetraacetic acid (EDTA), 0.1% 3-[(3-cholamidopropyl)dimethylammonio]-1-propanesulfonate (CHAPS), and 10 μg/mL of aprotinin.38 Protease inhibitor (cOmplete™ Mini; Roche) (1 tablet/10 mL of homogenization buffer) and antioxidant (100 μL of 0.5 M butylated hydroxytoluene in acetonitrile/10 mL of homogenization buffer) were added to the samples. Samples were homogenized on ice using a glass homogenizer (Omni TH; Omni International, Kennesaw, USA). The resulting suspension was subjected to ultrasound using a cell sonifier (UP 400S; Hielscher Ultrasonics, Teltow, Germany) (1,800 J/sample, 20 s × 3). After disruption of the cell membranes, the homogenate was incubated on ice for 30 min and centrifuged at 5,000 × g (4°C, 30 min).16, 17 Supernatants were collected for analysis. To assess the inflammatory profile, tissues were homogenized using the ready-to-use Bio-Plex® Cell Lysis Kit (Bio-Rad Laboratories, Inc., Hercules, USA), according to the manufacturer’s instructions.
To assess salivary secretory function, in addition to measuring the salivary flow rate, α-amylase activity was assessed spectrophotometrically using 3,5-dinitrosalicylic acid (POCH, Gliwice, Poland) as a substrate.34, 35 The results were standardized per mg of total protein and presented in mg/mg protein.
Cytokine, chemokine and growth factor concentrations in salivary glands and blood serum were determined using the Bio-Plex™ Rat Cytokine, Chemokine and Growth Factor Assay kit (Bio-Rad Laboratories, Inc.). The principle of the assay is similar to the sandwich enzyme-linked immunosorbent assay (ELISA) method, in which antibodies against a specific biomarker are covalently bound to magnetic beads. The conjugated beads react with a sample containing the selected biomarker. A series of washes are performed to remove the unbound protein. A biotinylated detection antibody is then added to form a sandwich complex. The final complex is formed by the addition of a streptavidin–phycoerythrin conjugate, and the readout is performed using a specialized plate reader (Bio-Plex 200; Bio-Rad Laboratories, Inc.). The results were standardized per mg of total protein and present in ng/mg protein.
The activity of GLU in salivary glands was measured spectrophotometrically at 405 nm using 4-nitrophenyl-β-D-glucuronide as a substrate.35 The results were standardized per mg of total protein and presented in pKat/mg protein.
The activity of MPO was measured at 450 nm using sulfanilamide, ortho-dianisidine dihydrochloride, hexadecyltrimethylammonium, and H2O2.36 The results were standardized per mg of total protein and presented in mU/mg protein.
Lysosomal exoglycosidase activities were determined at 405 nm using 4-nitrophenyl-N-acetyl-β-D-glucosaminide (for HEX, HEX A and HEX B), 4-nitrophenyl-N-acetyl-β-D-galactopyranoside (for GAL), 4-nitrophenyl-N-acetyl-α-D-mannopyranoside (for MAN), and 4-nitrophenyl-N-acetyl-α-D-fucopyranoside (for FUC35). The HEX isoenzymes were determined after the heat denaturation of the isoform A. The results were standardized per mg of total protein and presented in pKat/mg protein.
The activity of MMP-2 and MMP-9 in salivary glands was measured spectrofluorimetrically using the MCA-Pro-Leu-Gly~Leu-Dpa(Dnp)-Ala-Arg-NH2 substrate, where MCA is the fluorophore (7-methoxycoumarin-4-yl)acetate, Dnp is the quencher dinitrophenyl, and the tilde (~) represents the peptide-bond target of hydrolysis.37 The results were standardized per mg of total protein and presented in AFU/mg protein.
The activity of caspase-3 was measured at 405 nm using Ac-Asp-Glu-Val-Asp-p-nitroanilide as a substrate.38 The results were standardized per mg of total protein and expressed in mU/mg protein.
Statistical analysis
The GraphPad Prism 9.5.1 software (GraphPad Software Inc., La Jolla, USA) was used to process the statistical data. The normality of the distribution was checked using the Shapiro–Wilk test, while the homogeneity of variance was evaluated using the Levene’s test. A two-way ANOVA with factors including salivary gland type and presence of DM2, followed by Tukey’s honest significant difference (HSD) post hoc test, was used for comparisons. The results are presented as mean (M) ± standard error of the mean (SEM). The level of statistical significance was set at p < 0.05. Multiplicity-adjusted p-value was also calculated. Student’s t-test was used to compare the 2 groups. Since the data showed a normal distribution, the obtained results were correlated using Pearson’s test. Multivariate regression analysis was used to assess the relationship between salivary secretory function and the biomarkers assessed, using the salivary secretion rate and salivary α-amylase activity as independent variables. Confidence intervals of 95% were reported along with regression parameters.
The sample size was calculated a priori based on our previous experiments. Type I error (α) of 0.05 and statistical power (type II error) of 0.8 were considered. The minimum number of rats in one group was 8, and the analysis was performed on 10 subjects.
Results
Impaired salivary function in diabetic rats
Fasting blood glucose levels were significantly elevated in the DM2 group compared to the control group. All rats in the DM2 group had fasting glucose levels above 200 mg/dL, confirming the onset of diabetes.
Body weight was significantly higher in the study group than in the control group. Although salivary gland mass did not differ between the groups, the PG index was significantly lower in rats with DM2 compared with controls. The salivary secretion rate was also significantly reduced in the DM2 group. Furthermore, α-amylase activity, used as an indicator of salivary secretory function, was significantly lower in both PGs and SMGs of diabetic rats compared with controls (Table 1).
Salivary pro-inflammatory cytokines
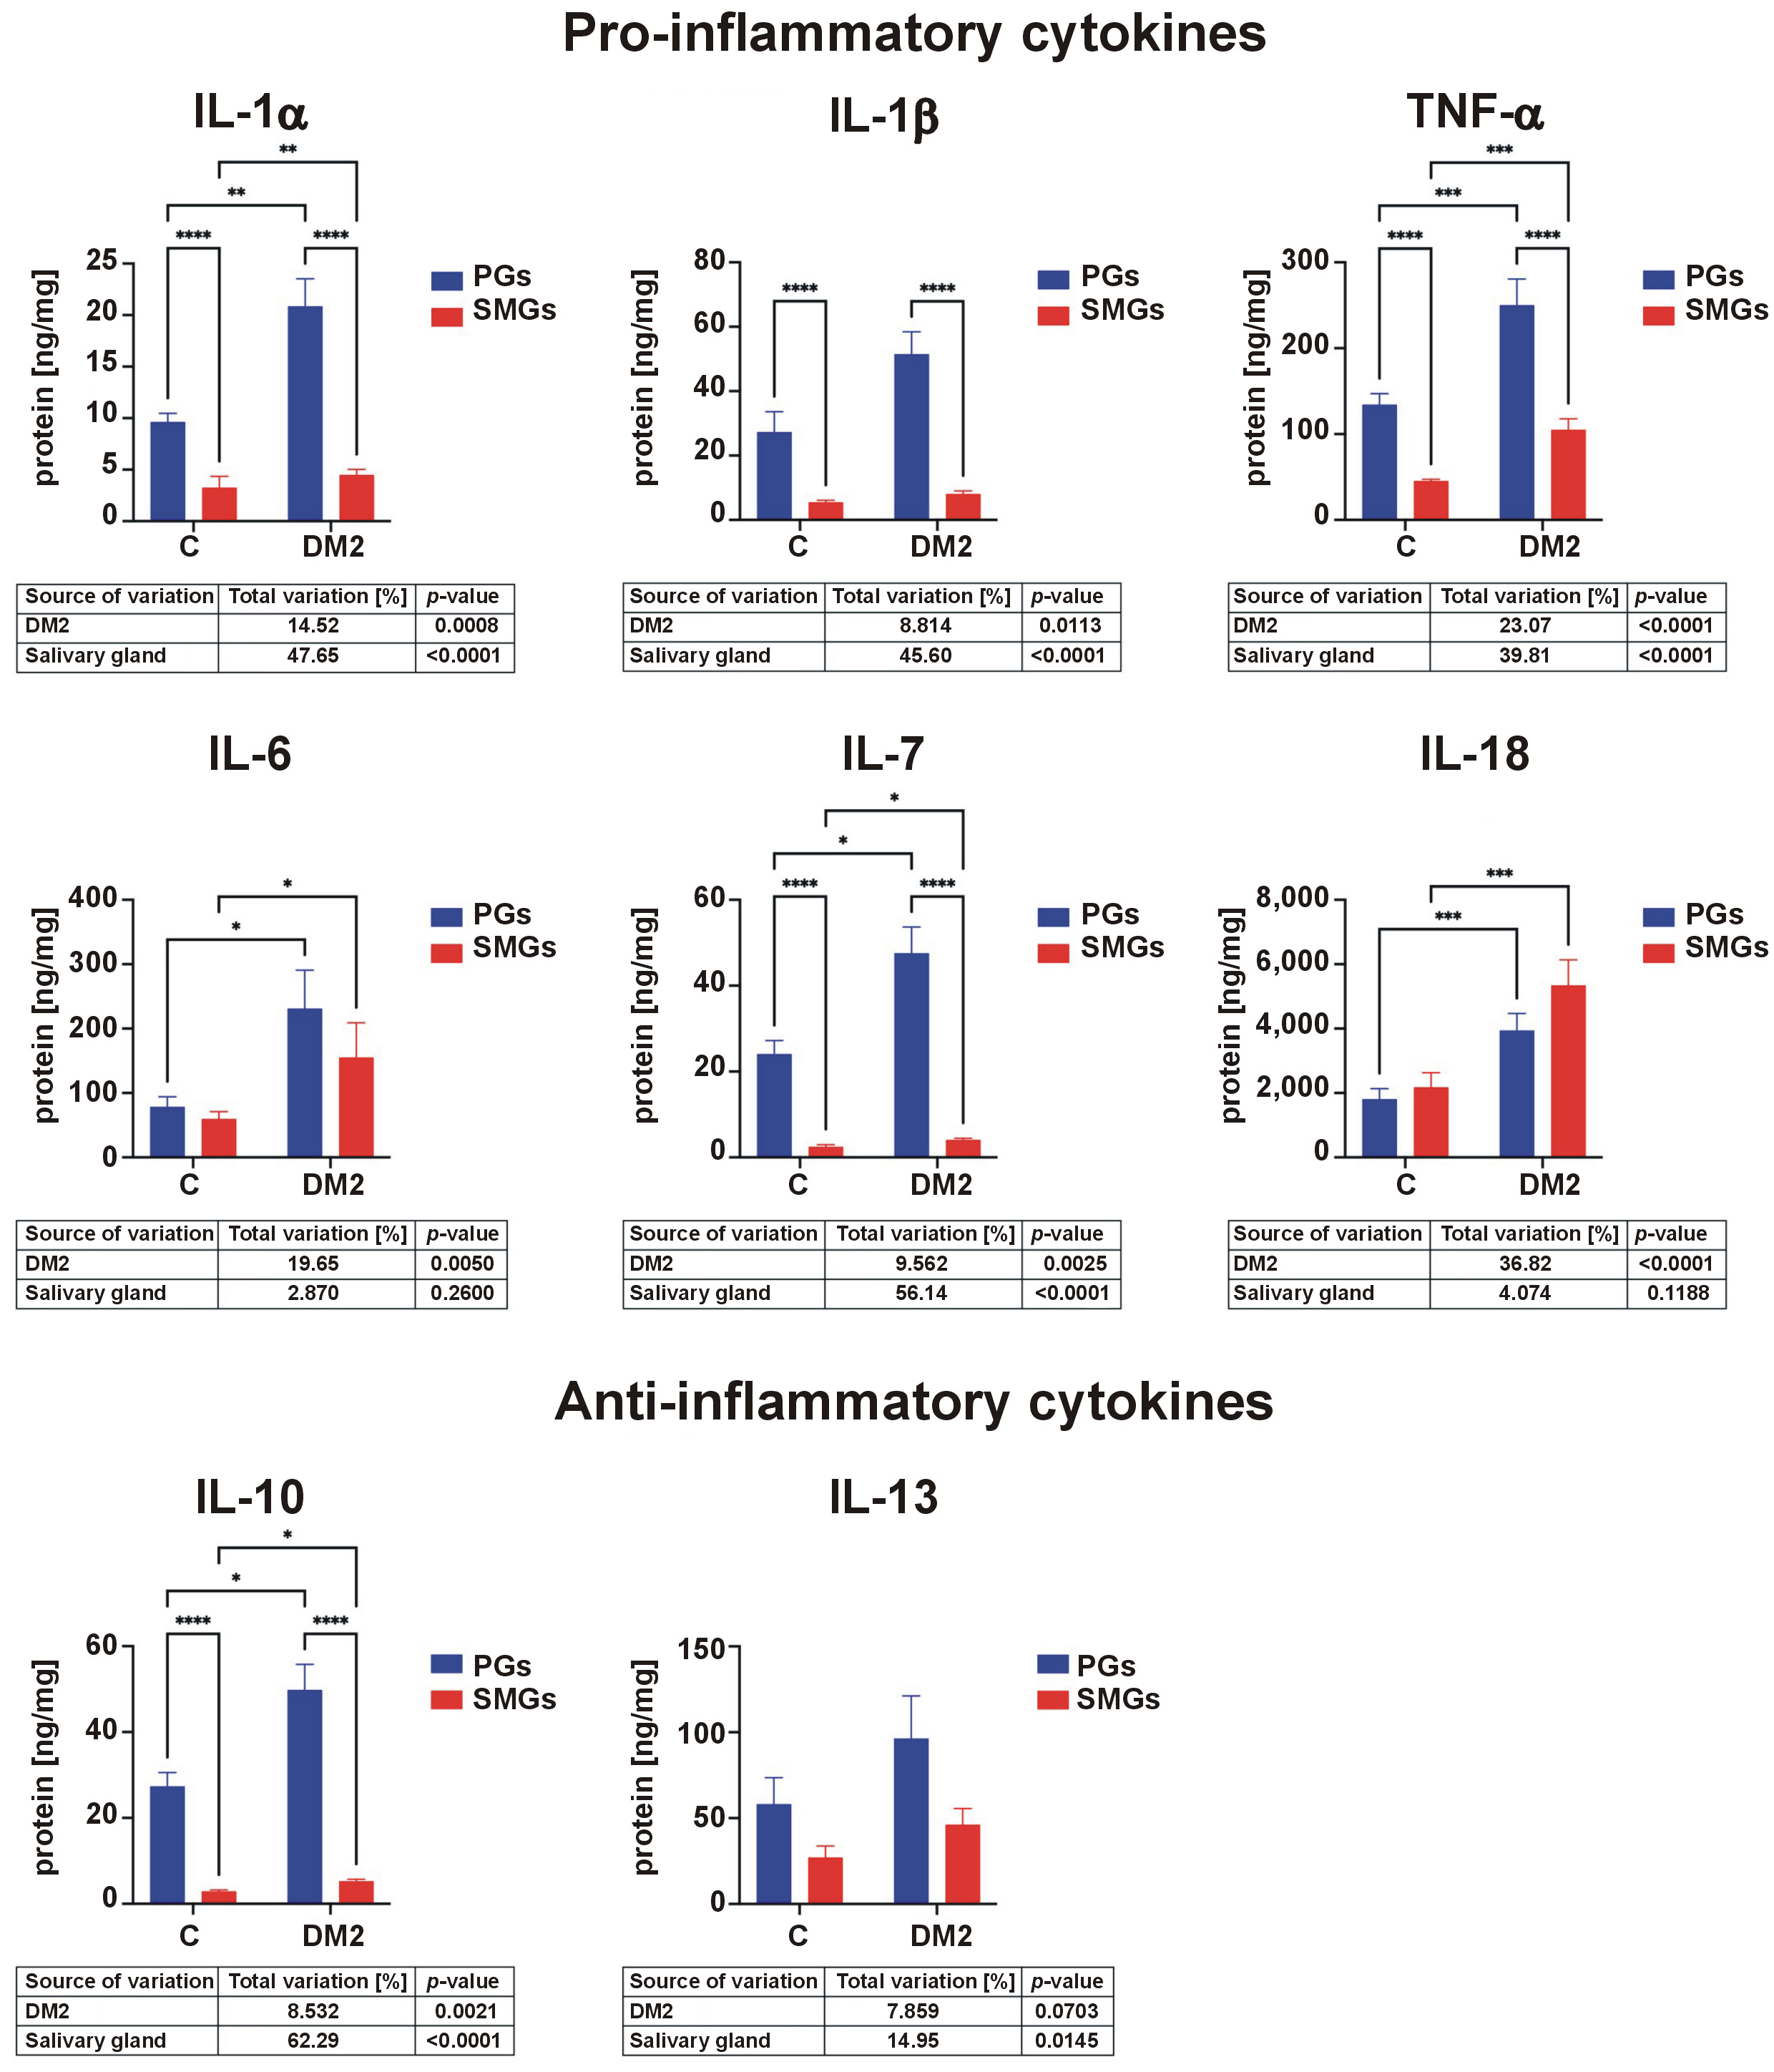
Concentrations of IL-1α standardized to total protein were significantly higher in the PGs than in the SMGs in both control and DM2 groups. IL-1α levels were significantly elevated in both glands in rats with DM2 compared with controls. IL-1β content was also significantly higher in the PGs than in the SMGs in both groups. TNF-α concentrations were higher in the PGs than in the SMGs in both groups and were significantly increased in DM2 rats compared with controls. The IL-6 content in both the PGs and SMGs was significantly elevated in the DM2 group. IL-7 concentrations were higher in the PGs than in the SMGs in both groups and were further increased in diabetic rats. In contrast, IL-18 levels were higher in the SMGs than in the PGs in both groups. In both glands, IL-18 concentrations were significantly higher in rats with DM2 than in the control group (Figure 3).
Salivary anti-inflammatory cytokines
IL-10 concentrations were significantly higher in the PGs than in the SMGs and were increased in both salivary glands in the DM2 group compared with controls (Figure 3).
Salivary Th1 cytokines
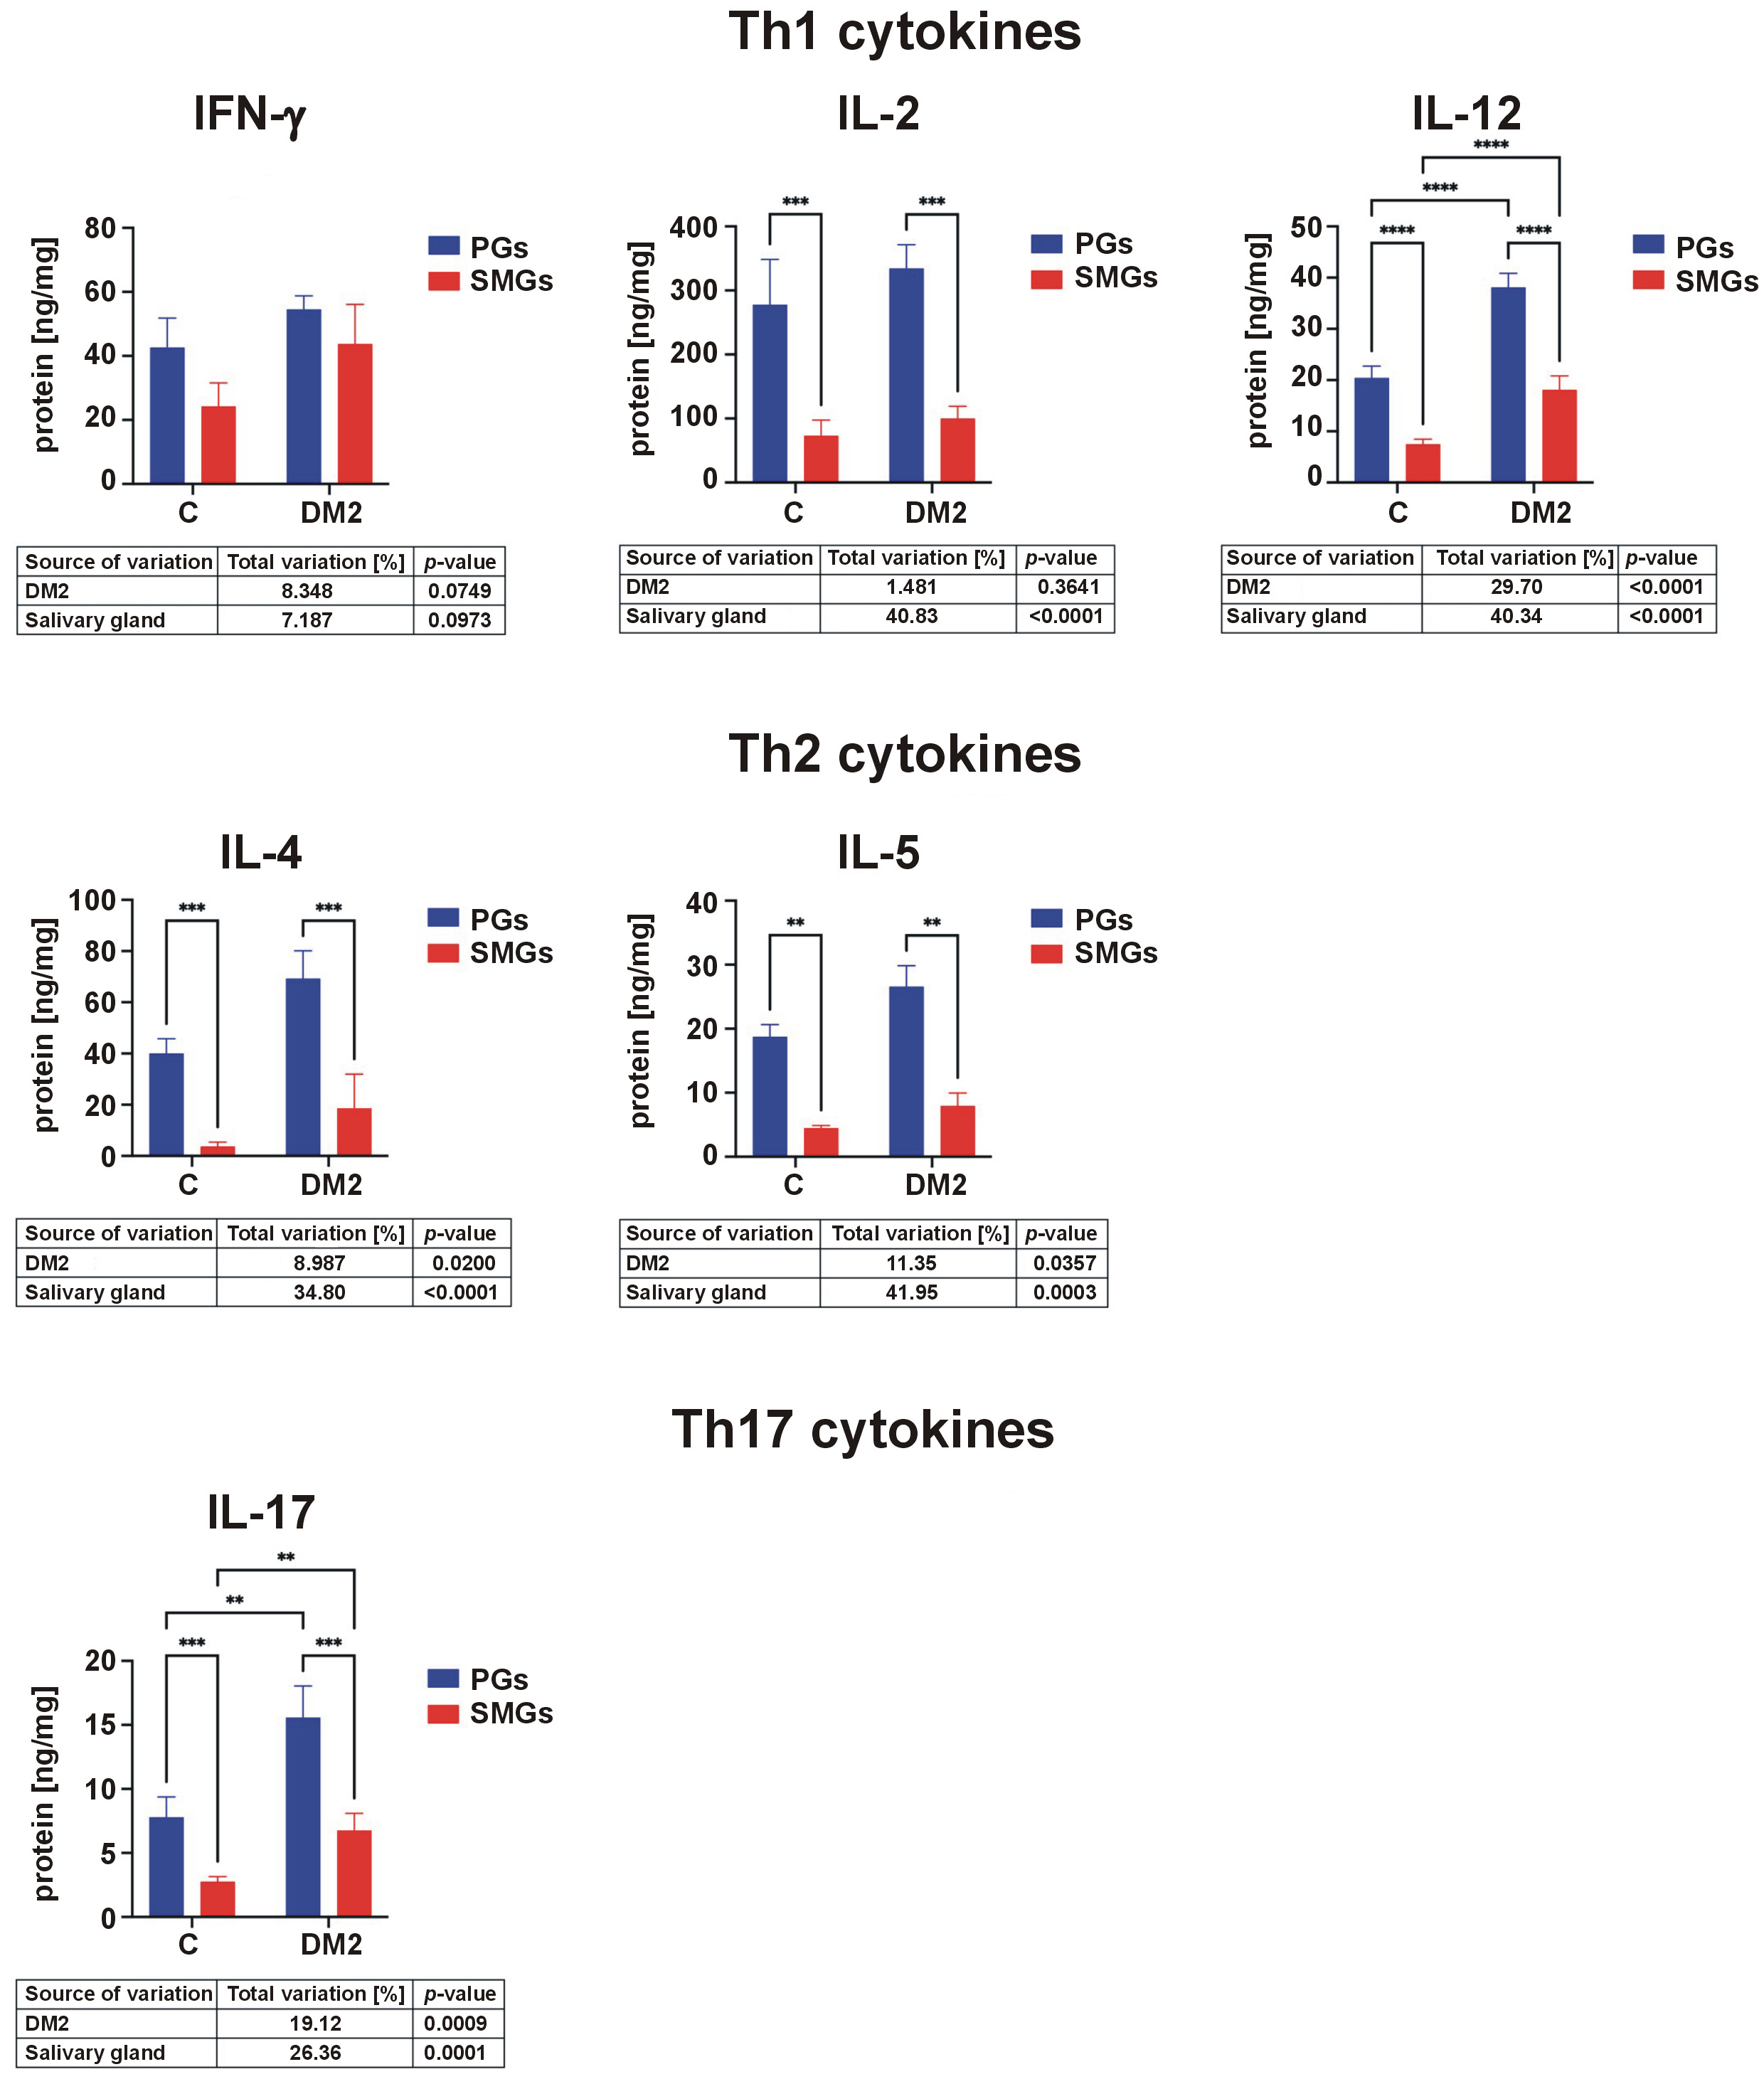
Concentrations of IL-12 were significantly higher in the PGs than in the SMGs and were elevated in both glands in rats with DM2 compared with controls. IL-2 levels were higher in the PGs than in the SMGs in both groups (Figure 4).
Salivary Th2 cytokines
IL-4 and IL-5 concentrations were elevated in the PGs compared to the SMGs in both control and DM2 groups (Figure 4).
Salivary Th17 cytokines
Levels of IL-17 were significantly higher in the PGs than in the SMGs in both groups. In addition, IL-17 concentrations in both glands were significantly elevated in rats with DM2 compared with controls (Figure 4).
Salivary chemokines
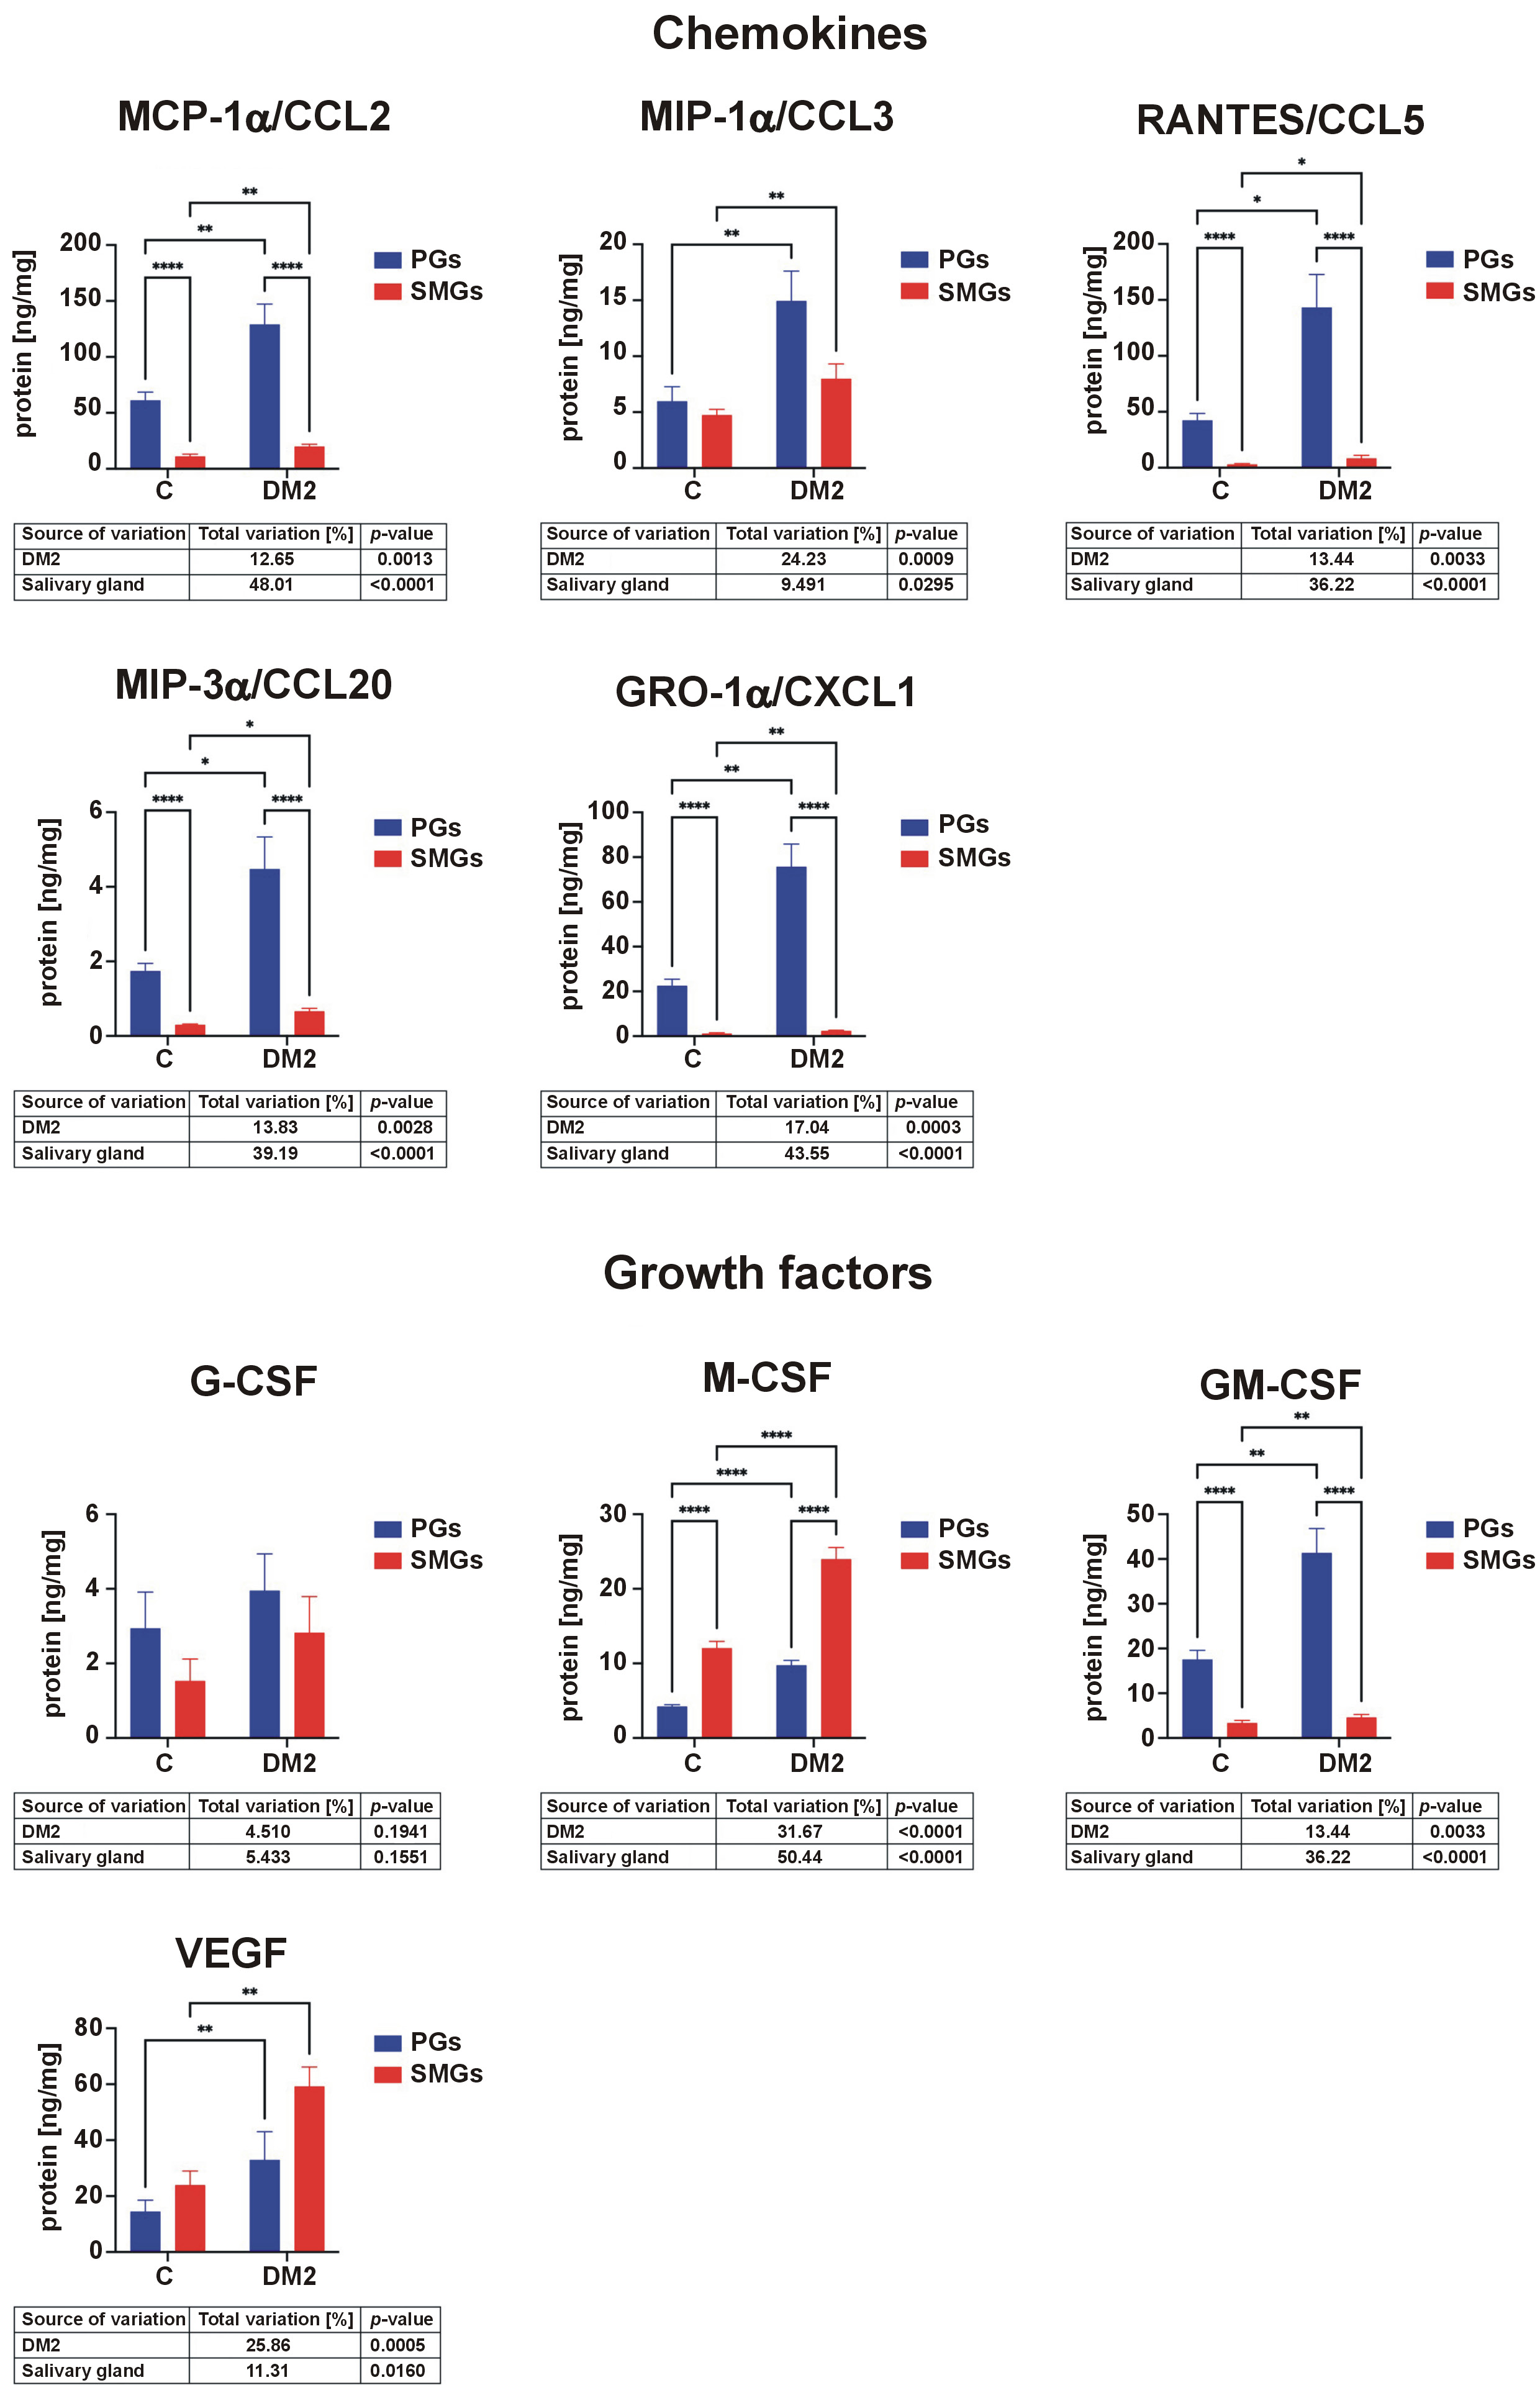
MCP-1α/CCL2 levels were significantly higher in the PGs than in the SMGs in both groups and were significantly increased in DM2 rats. Levels of MIP-1α/CCL3 were elevated in both glands in the DM2 group. RANTES/CCL5 concentrations were higher in the PGs than in the SMGs in both groups and were significantly increased in diabetic rats. Levels of MIP-3α/CCL20 were higher in the PGs than in the SMGs for both groups and were elevated in rats with DM2. GRO-1α/CXCL1 concentrations were higher in the PGs than in the SMGs in both groups and were significantly increased in both glands in the DM2 group (Figure 5).
Salivary growth factors
M-CSF concentrations were significantly higher in the SMGs than in the PGs in both groups and were elevated in diabetic rats. GM-CSF levels were higher in the PGs than in the SMGs in both groups and were significantly increased in rats with DM2. The concentration of VEGF was higher in both PGs and SMGs in the DM2 group compared with controls (Figure 5).
Other biomarkers
Concentrations of ghrelin, glucagon, leptin, IL-12p40, and MIP-2 were below the detection level in both salivary glands of control and DM2 rats.
Blood inflammatory and anti-inflammatory profiles
Serum concentrations of pro-inflammatory cytokines (IL-lα, IL-1β, TNF-α) were significantly higher in the DM2 group than in controls. In contrast, IL-10 levels were significantly lower in diabetic rats. Th1 cytokines (IFN-γ, IL-2, IL-12) were significantly elevated in the serum of rats with DM2. Concentrations of Th2 cytokine (IL-6) were higher in the DM2 group, whereas Th17 cytokine (IL-17) levels were significantly reduced in the study group. RANTES/CCL5 and VEGF concentrations were also significantly increased in diabetic rats. Other parameters did not differ significantly between the groups (Table S1 (available on request from the corresponding author)).
Pearson’s correlation analysis revealed no consistent relationship between salivary and serum cytokine levels. Only IL-6 concentrations in the SMGs correlated positively with their plasma content in the control rats, while IL-7, MCP-1α and GRO-1α concentrations correlated positively between the PGs and serum in diabetic rats (Table S2).
Salivary pro-inflammatory enzymes
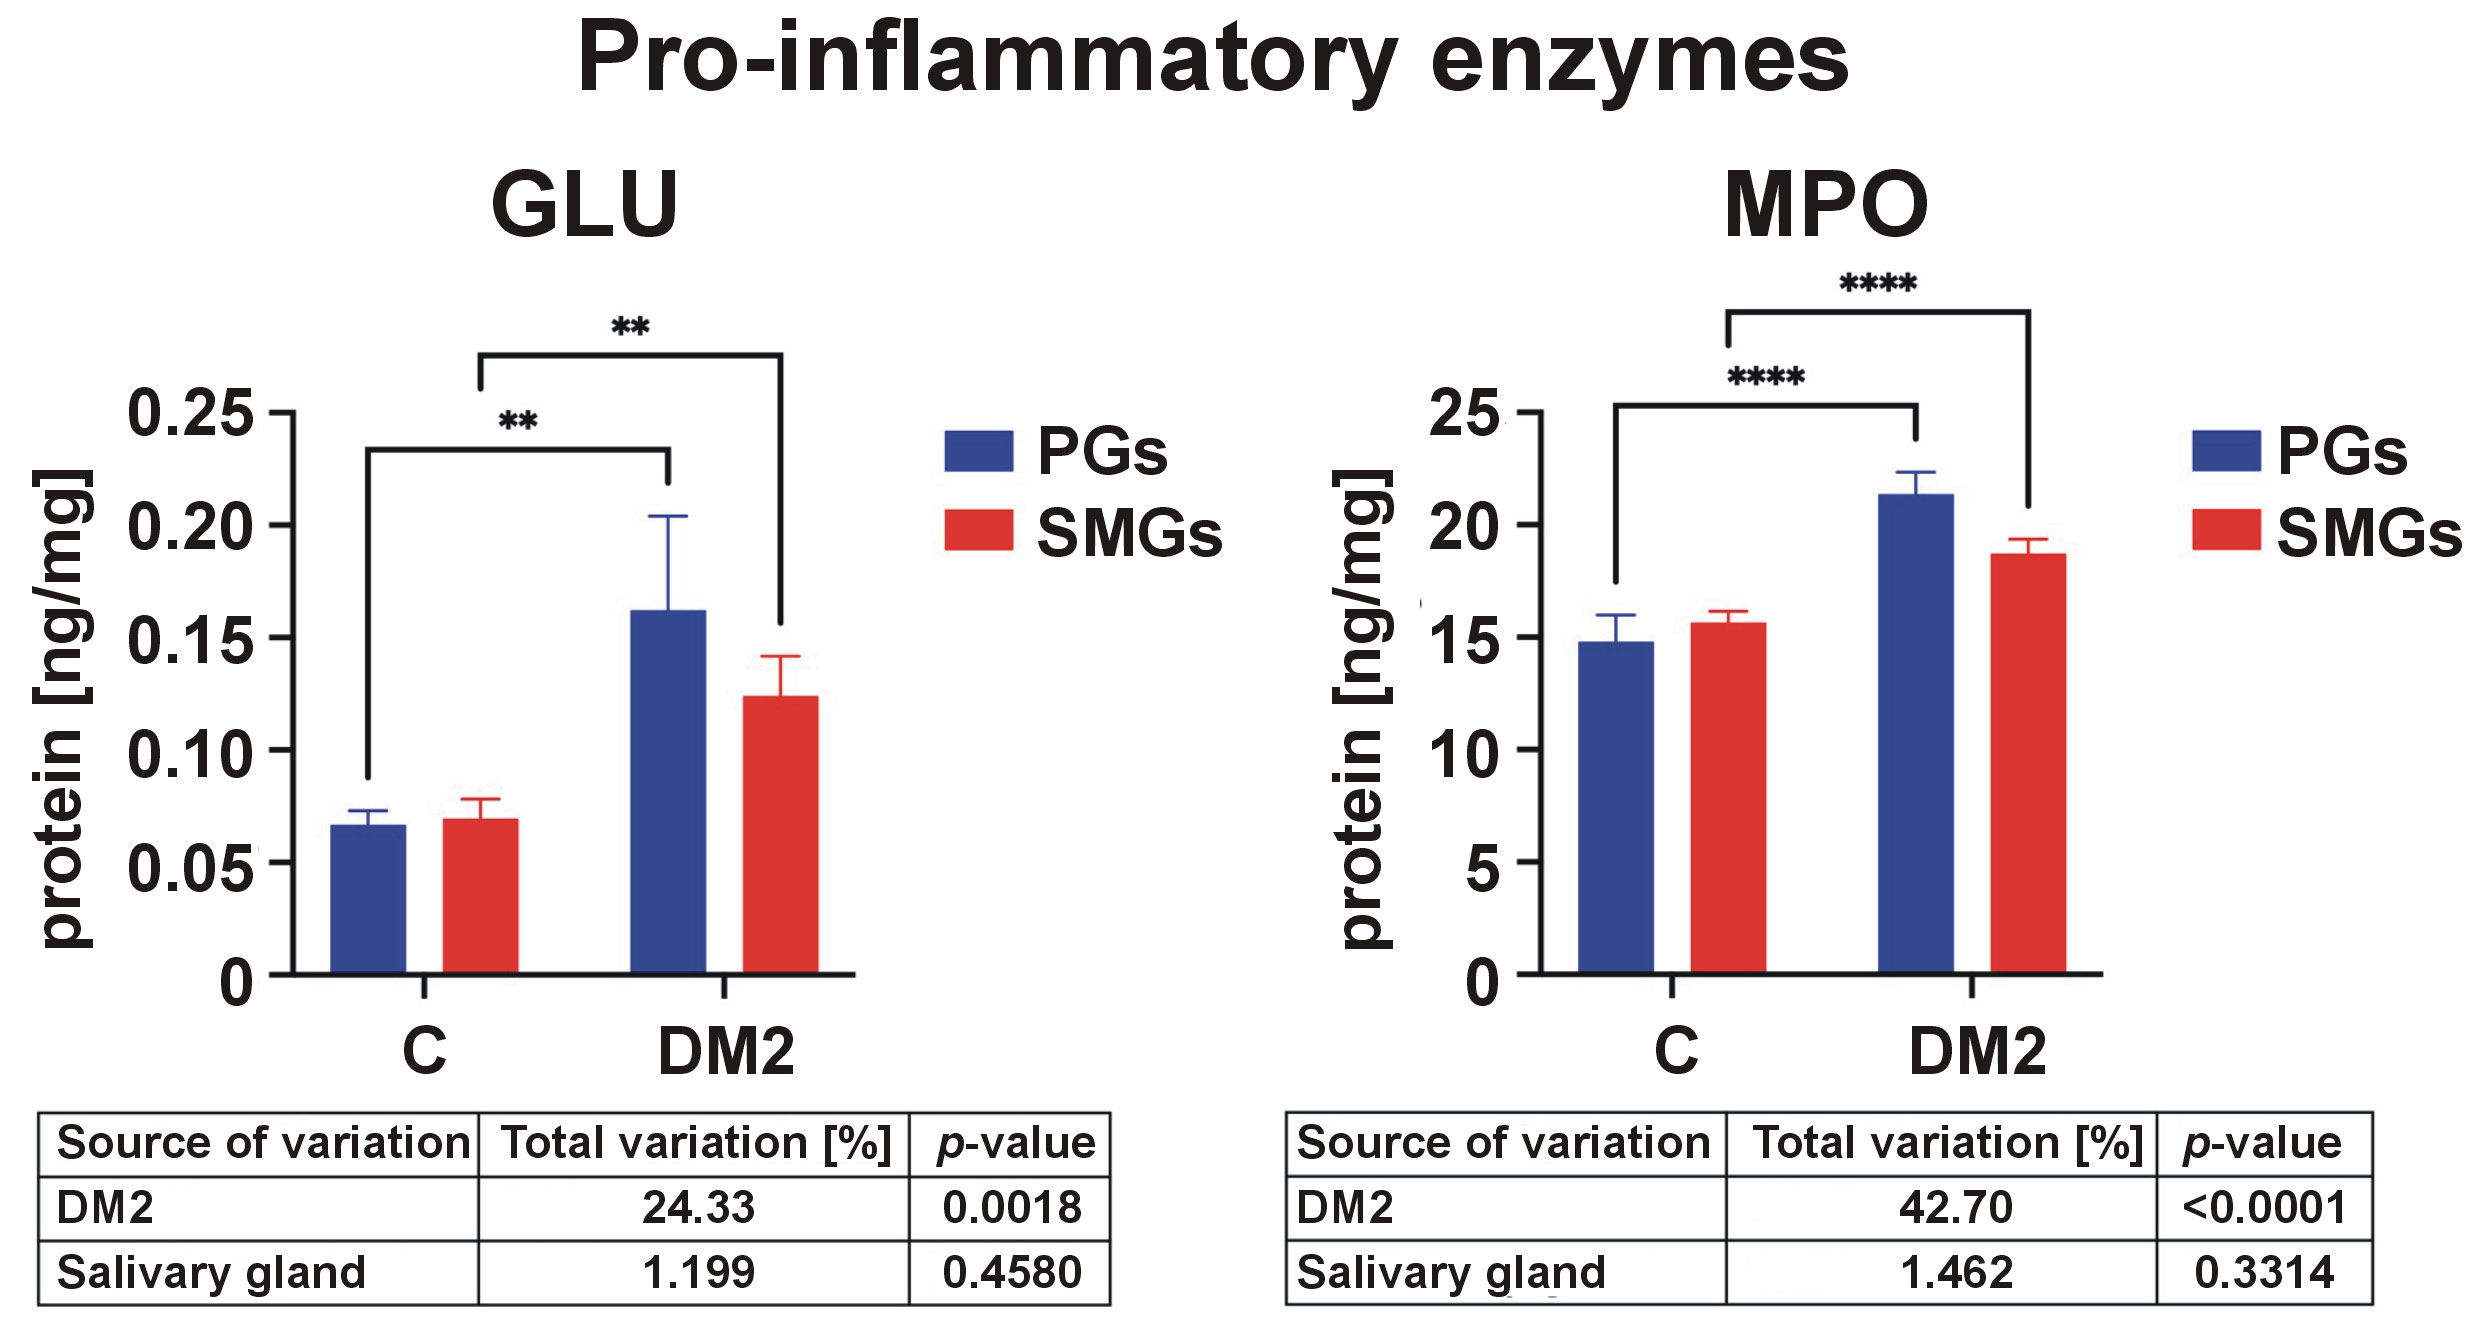
The activity of GLU was significantly higher in the DM2 group than in controls in both salivary glands. The activity of MPO was also elevated in PGs and SMGs of diabetic rats (Figure 6).
Salivary exoglycosidases
Inflammation disrupts salivary extracellular matrix (ECM) remodeling. Glycoconjugates, i.e., molecules made out of one or more oligosaccharide or polysaccharide chains which are linked by covalent bonds to a protein or lipid by a N- or O-glycosidic bond, are key components of the salivary ECM. These include glycoproteins, proteoglycans or sphingolipids.39, 40 The enzymes responsible for the metabolic turnover of salivary glycoconjugates are lysosomal exoglycosidases. Salivary exoglycosidases hydrolyze single monosaccharides from the non-reducing ends of oligosaccharides. In this group of enzymes, we distinguish HEX and its isoforms (HEX A and HEX B), as well as the less active GAL, MAN and FUC.35
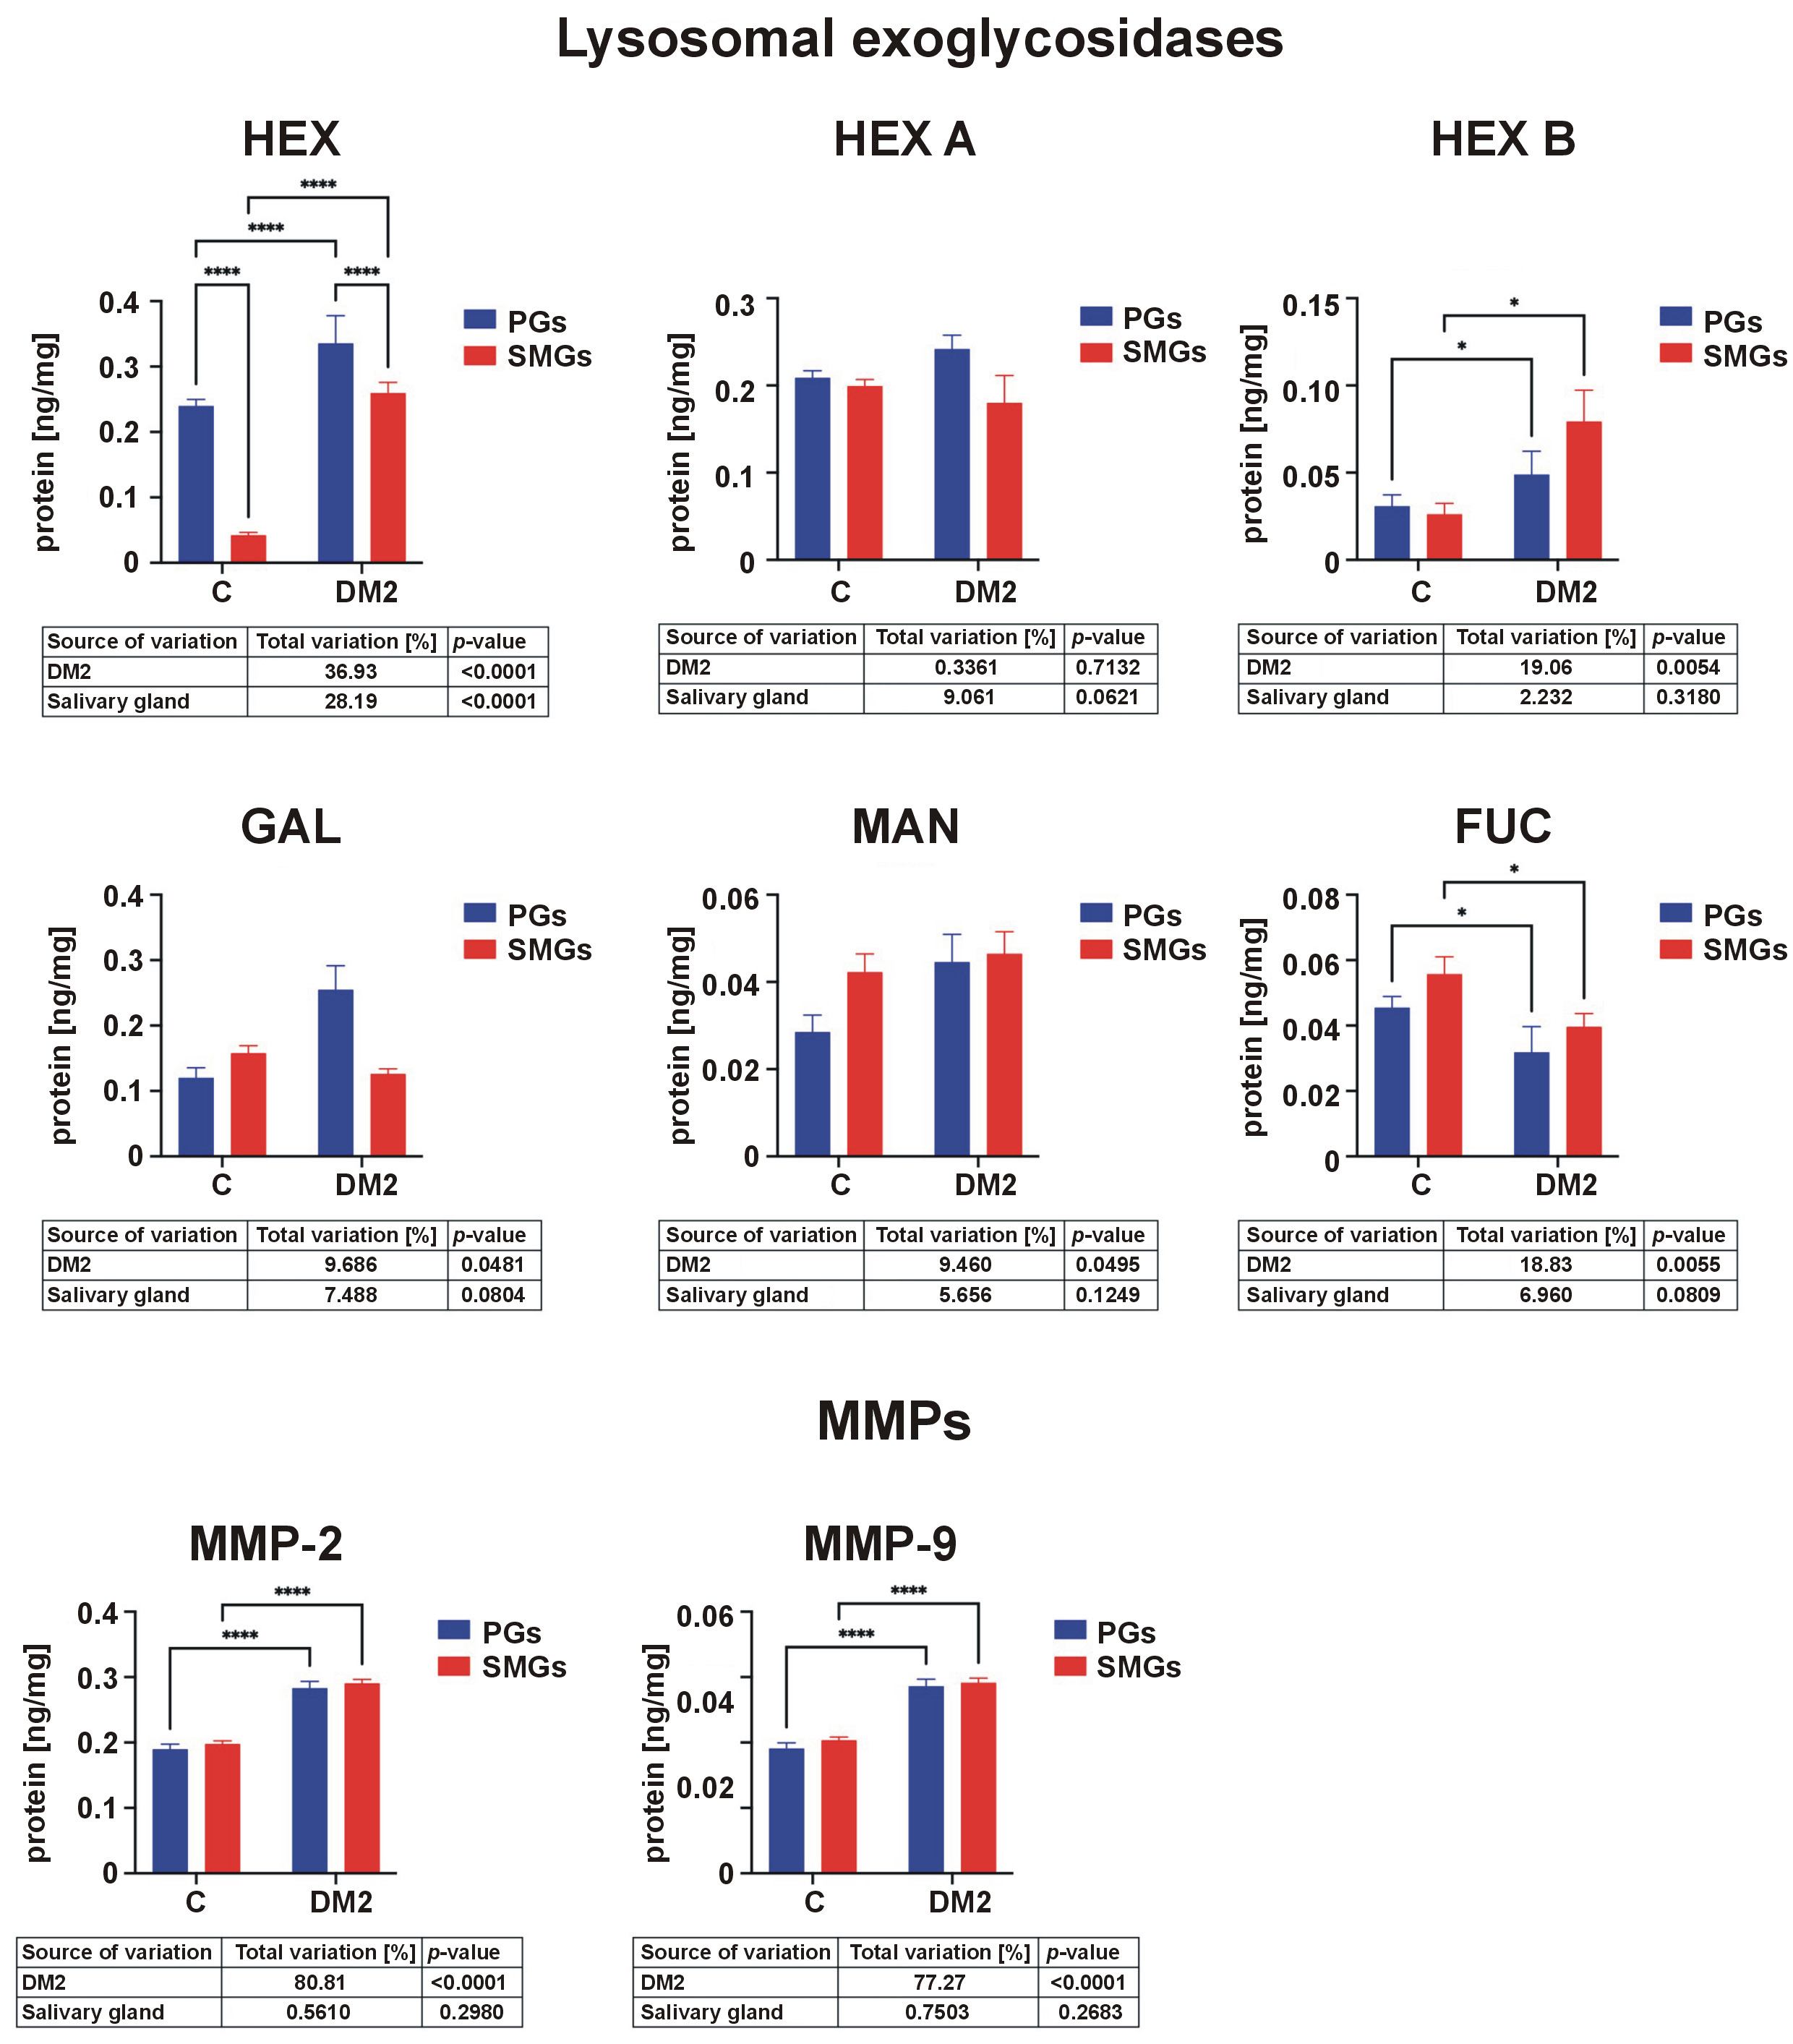
The activity of HEX and HEX B was significantly higher in DM2 rats than in controls in both glands. In contrast, FUC activity was reduced in diabetic rats (Figure 7).
Salivary extracellular matrix metalloproteinases
In addition to lysosomal exoglycosidases, salivary gland remodeling is also contingent upon enzymes from the MMP group. Matrix metalloproteinases belong to proteolytic enzymes that digest ECM components and basement membranes. Among these enzymes, MMP-2 and MMP-9 are most commonly associated with metabolic diseases.41 Due to their structural similarity and ability to degrade gelatin, MMP-2 and MMP-9 belong to the gelatinase group. Compared to other MMPs, they exhibit a high activity within the salivary glands.26
Both MMP-2 and MMP-9 activities were significantly higher in rats with DM2 than in controls in both salivary glands (Figure 7).
Salivary caspase-3
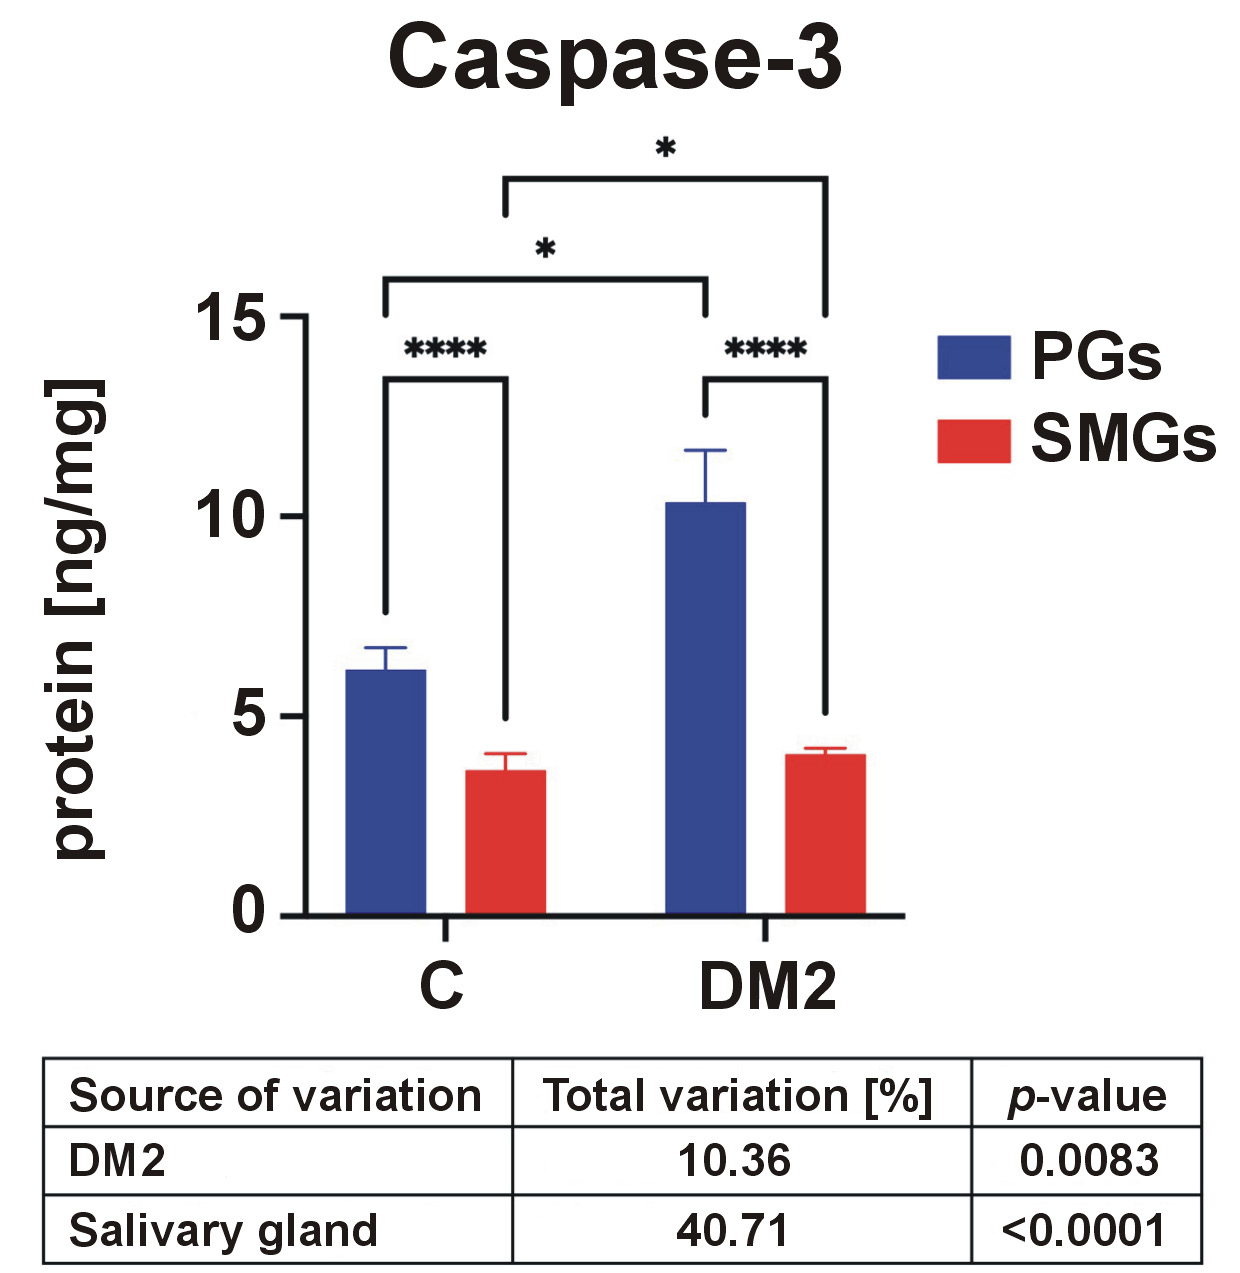
Inflammation and impaired ECM remodeling may promote apoptosis in salivary gland cells. Therefore, caspase-3 activity, the key enzyme responsible for the execution of apoptosis, was assessed.42 Caspase-3 activity was significantly higher in the PGs than in the SMGs in both control and DM2 groups and was significantly increased in diabetic rats (Figure 8).
Correlation analysis
Pearson’s correlation analysis was used to measure the strength and direction of linear relationships between inflammatory biomarkers and salivary gland secretory function. The results are presented in Tables S3 and S4.
In the control group, only a limited number of correlations was observed between the salivary inflammatory profile and secretory function. In the PGs in the control group, salivary α-amylase activity correlated positively with IL-1β (r = 0.72, p = 0.02), MCP-1α/CCL3 (r = 0.73, p = 0.016) and RANTES/CCL5 (r = 0.65, p = 0.043) (Table S3). In the SMGs, the salivary secretion rate correlated positively with HEX (r = 0.74, p = 0.014) and MAN (r = 0.31, p = 0.014). Furthermore, salivary α-amylase activity was negatively correlated with MPO activity (r = −0.68, p = 0.031) and positively correlated with caspase-3 activity (r = 0.94, p = 0.025) (Tables S3 and S4).
Although the study is observational in nature, the presence of a potential association between inflammation and salivary gland dysfunction in rats with DM2 may be confirmed by the negative correlations between salivary cytokines, the salivary secretion rate and salivary α-amylase activity. In the PGs of rats with DM2, the salivary secretion rate correlated negatively with IL-1α (r = −0.74, p = 0.015), IL-7 (r = −0.68, p = 0.031), IL-10 (r = −0.69, p = 0.026), IL-2 (r = −0.87, p = 0.005), IL-12 (r = −0.77, p = 0.01), IL-4 (r = −0.69, p = 0.027), IL-5 (r = −0.86, p = 0.002), MCP-1α/CCL2 (r = −0.67, p = 0.035), and VEGF (r = −0.67, p = 0.035). Salivary α-amylase activity in the PGs correlated negatively with IL-1β (r = −0.74, p = 0.022), TNF-α (r = −0.79, p = 0.011), IL-6 (r = −0.78, p = 0.013), IL-7 (r = −0.86, p = 0.003), IL-10 (r = −0.82, p = 0.007), IL-12 (r = −0.69, p = 0.041), IL-4 (r = −0.79, p = 0.012), IL-5 (r = −0.72, p = 0.03), MCP-1α/CCL2 (r = −0.85, p = 0.004), and GM-CSF (r = −0.84, p = 0.004) (Tables S3 and S4).
In the SMGs of DM2 rats, the salivary secretion rate correlated negatively with M-CSF concentration (r = −0.66, p = 0.037). Salivary α-amylase activity was negatively correlated with TNF-α (r = −0.71, p = 0.034), GLU activity (r = −0.72, p = 0.028) and HEX B activity (r = −0.65, p = 0.04). In contrast, α-amylase activity correlated positively with G-CSF concentration (r = 0.67, p = 0.034), HEX activity (r = 0.65, p = 0.042) and HEX A activity (r = 0.72, p = 0.019) (Tables S3 and S4).
Regression analysis
Multiple regression analysis was performed to evaluate the relationship between multiple independent (explanatory) variables and the dependent (response) variable. The salivary production rate and α-amylase activity were used as predictors. The results are presented in Table S5.
Multivariate linear regression analysis revealed that the content of pro-inflammatory cytokines (IL-lα) in the PGs was negatively correlated with the saliva secretion rate, as was the concentration of TNF-α in the SMGs. The content of anti-inflammatory cytokines (IL-10) in the SMGs was also negatively associated with the rate of saliva production, similarly to the concentration of Th1 cytokines (IL-12). The content of Th2 cytokines (IL-6) in the PGs was negatively associated with α-amylase activity. Chemokine levels, including MIP-1α/CCL3 and MIP-3α/CCL20 in the SMGs, were negatively correlated with the salivary secretion rate, while RANTES/CCL5 and GRO-1α/CXCL1 in the PGs were negatively associated with the salivary secretion rate. The content of growth factors (M-CSF) in both SMGs and PGs was negatively associated with salivary secretion. The concentration of VEGF in the SMGs exhibited a negative correlation with the salivary secretion rate. Pro-inflammatory enzyme (GLU) activity in the SMGs was negatively associated with the rate of saliva production, whereas MPO activity was negatively associated with α-amylase activity. The activity of salivary exoglycosidases in the SMGs was negatively correlated with α-amylase activity. Furthermore, the activity of salivary MMPs (MMP-2, MMP-9) in the SMGs was negatively associated with the salivary secretion rate (Table S5).
Discussion
Diabetes mellitus constitutes a group of metabolic diseases resulting from defects in insulin secretion and/or insulin action. Chronic hyperglycemia impairs the function of many systems and organs, including the oral cavity, leading to salivary secretory dysfunction.43 Xerostomia is observed in up to 80% of patients with DM and is associated with reduced resting and stimulated salivary secretion.44 This condition significantly reduces patients’ quality of life by causing speech and digestive disorders and by promoting the development of oral diseases.45 However, the causes of salivary hypofunction in patients with DM2 are not fully understood.46, 47 It is presumed that autonomic nerve dysfunction and microcirculatory disturbances may reduce the responsiveness of salivary secretory cells to neural or hormonal stimulation.48, 49 Undoubtedly, oxidative stress and carbonyl stress contribute to salivary hypofunction through glycoxidative modifications of salivary glands.50, 51, 52
Large salivary glands, namely the PGs and SMGs, produce more than 90% of total salivary volume.15 The salivary gland epithelium has a highly branched tubular structure composed of terminal units/acini that secrete saliva, a network of interlobular, granular (in rodents), striated, and excretory ducts that serve to modify and transport saliva, and a myoepithelium that supports the excretion of saliva from the acini through the ducts.53 The activation of muscarinic or α-adrenergic receptors initiates salivary secretion, while the stimulation of β-adrenergic receptors induces protein exocytosis.54 In patients with DM2, degenerative and hypertrophic changes in salivary glands resulting from diabetic microangiopathy have been reported. A reduction in tubular structures, their concomitant hypertrophy, and decreased density of α- and β-adrenergic receptors have been observed, leading to hyposalivation and impaired protein secretion.55, 56, 57 In the present study, reduced pilocarpine-stimulated salivary secretion and decreased salivary α-amylase activity were observed in rats with DM2. However, the exact cause of diabetic microangiopathy in the salivary glands remains unclear.
The present study is the first to comprehensively assess salivary inflammatory and anti-inflammatory profiles in the salivary glands of rats with DM2. Significantly increased concentrations of pro-inflammatory cytokines (IL-1α, TNF-α, IL-6, IL-7, IL-18), anti-inflammatory cytokines (IL-10), Th1 (IL-12), Th17 (IL-17), chemokines (MCP-lα/CCL2, MIP-1α/CCL3, RANTES/CCL5, MIP-3α/CCL20, GRO-1α/CXCL1), growth factors (M-CSF, GM-CSF, VEGF), and pro-inflammatory enzymes (MPO, GLU) were observed in rats with DM2. The inflammatory profile of the salivary glands did not indicate dominance of a specific branch of the immune system. However, elevated concentrations of all pro-inflammatory cytokines were detected, with the exception of IL-1β. Moreover, the activity of lysosomal exoglycosidases and MMPs involved in salivary gland remodeling (HEX, HEX B, MMP-2, and MMP-9; with the exception of FUC) was significantly higher in the PGs and SMGs of DM2 rats compared to controls. Two-factor analysis of variance (ANOVA) demonstrated that inflammation and catabolism of salivary glycoconjugates were more pronounced in the PGs of rats with DM2. Increasing levels of inflammatory biomarkers were associated with declining salivary secretory function, suggesting a direct contribution of inflammation to salivary dysfunction.
Salivary cytokines, chemokines and growth factors
Systemic inflammation associated with chronic hyperglycemia appears to be a major source of oral inflammation in patients with DM2.58 Neutrophil granulocytes (PMNs) activated under these conditions adhere to the vascular endothelium (adhesion) and/or each other (aggregation), initiating an inflammatory response.59, 60 Additionally, the endocrine activity in adipose tissue interferes with the expression of insulin receptors and contributes to complications in distant organs.59 In DM2, activation of the κB kinase/NF-κB (IKK/NF-κB and c-Jun N-terminal kinase (JNK1)) pathways reduces the sensitivity of target tissues to insulin and stimulates excessive cytokine and chemokine production.61, 62 Increased oxidative stress and carbonyl stress also promote oral inflammation.63 Glucose autoxidation, increased metabolism of the polyol and sorbitol pathways and, above all, non-enzymatic protein glycation are responsible for the overproduction of ROS, which, by positive feedback, increase the production of cytokines, chemokines and growth factors.64, 65 Advanced glycation end products (AGEs) formed by non-enzymatic coupling of glucose to the amino groups of proteins appear to play a crucial role in promoting oral inflammation.66 Our previous study demonstrated AGE aggregation and accumulation in salivary glands of obese rats under hyperglycemic conditions, resulting in reduced unstimulated and stimulated salivary secretion.32 Binding of AGEs to the receptor for advanced glycation end products (RAGE) activates the NF-κB pro-inflammatory pathway and increases the sensitivity of PMNs and monocytes to stimuli that induce the production of inflammatory mediators.67 The activation of RAGE also increases NADPH oxidase (NOX) activity, the most important pro-oxidant enzyme of the oral cavity, which further enhances inflammation.68, 69
Neutrophil granulocyte-produced cytokines increase the expression of receptors for intercellular adhesion molecules mediated by neutrophil adhesion to the vascular endothelium and PMN passage into tissues.70 Migration of inflammatory cells toward the chemotactic stimulus requires cooperation with MMPs, particularly type IV collagenases. These are capable of degrading the ECM and basement membranes of blood vessels.71, 72, 73 Therefore, increased activity of MMP-2 and MMP-9 in the salivary glands of rats with DM2 is expected. Under these conditions, bioavailability of cytotoxic nitric oxide (NO) increases alongside endothelin I and angiotensin II production. Released cytokines and chemokines further enhance vascular permeability, impair fibrinolysis and promote leukocyte adhesion to endothelial cells by enhancing the expression of adhesin.74, 75 Vascular wall remodeling that occurs in the target tissues leads to a loss of elasticity and flexibility, impairs microcirculatory blood flow and induces hypoxia in the surrounding tissues.76, 77, 78 Notably, VEGF levels were markedly increased in the PGs and SMGs of DM2 rats. As a major angiogenic factor, VEGF enhances vascular permeability.79, 80 These findings are supported by elevated salivary HEX activity, a sensitive and early indicator of diabetic microangiopathy, endothelial dysfunction and organ damage in the vascular area.81, 82
Greater inflammatory changes in the PGs may be related to the physiological absence of adipocytes in the SMGs and their exclusive presence in the PGs.83, 84 Indeed, metabolic disturbances in DM2 promote adipocyte hyperplasia and hypertrophy not only in the adipose tissue, but also in distant organs.85 Chronic hyperglycemia stimulates adipocytes to release MCP-1α, which increases the influx of monocytes into the site of inflammation and promotes their transformation into macrophages.85, 86 Macrophages, through the release of pro-inflammatory cytokines (↑IL-1α, ↑IL-1β, ↑TNF-α, and ↑IL-6), enhance inflammation, which explains the increase in GLU and MPO activities. β-D-glucuronidase is a recognized marker of chronic oral inflammation.39 Increased levels of GLU are indicative of enhanced neutrophil influx and activity at the site of inflammation, while elevated MPO levels serve as a confirmation of inflammation in the salivary glands. This enzyme is released by neutrophils and monocytes during the activation of inflammatory cells. Myeloperoxidase also exacerbates oxidative stress, leading to tissue damage, as well as initiates and sustains the inflammatory process. Therefore, MPO has been identified as a marker linking inflammation and oxidative stress.87
Salivary vs. serum inflammatory profiles
Statistically significant changes in the serum contents of pro-inflammatory cytokines (↑IL-1α, ↑IL-1β, ↑TNF-α, ↑IL-6), anti-inflammatory cytokines (↓IL-10), Th1 (↑INF-γ, ↑IL-2, ↑IL-12), Th-17 (↓IL-17), chemokines (↑RANTES/CCL5), and growth factors (↑VEGF) were noted in DM2 rats compared to controls. Since salivary and serum biomarker levels were generally not correlated, local inflammatory changes appear to differ from systemic inflammation. Indeed, most cytokines act in a paracrine and autocrine manner, and salivary cytokines are mainly derived from inflammatory cells infiltrating salivary glands.23, 88 This hypothesis is supported by the negative correlations between salivary secretion, α-amylase activity and the content of cytokines, chemokines and growth factors exclusively in the salivary glands of rats with DM2. Also, multivariate linear regression analysis further confirmed that salivary inflammatory biomarkers increase with a decrease in salivary secretory function. Although our experiment is observational in nature, salivary gland dysfunction in DM2 may increase with the progression of inflammation. Previous studies have shown that IL-1α, IL-1β and TNF-α inhibit acetylcholine release from parasympathetic endings of salivary glands,89 weakening the glandular cell response and reducing saliva production in patients with Sjögren’s syndrome.90, 91
In contrast to salivary glands, reduced contents of anti-inflammatory cytokines (IL-10) and Th17 (IL-17) were observed in serum of DM2 rats. The decrease in IL-17 levels in diabetic rats is particularly puzzling. Although IL-17 is mainly known for its pro-inflammatory properties, this molecule also exhibits potent anti-inflammatory effects.92 Indeed, IL-17 plays an important role in protection against extracellular pathogens and may stimulate an inflammatory/anti-inflammatory response in autoimmune diseases.93 Further research is necessary to elucidate the role of IL-17 in autoimmune diseases, including DM2.
Salivary exoglycosidases, matrix metalloproteinases and apoptosis
Extracellular matrix proteins play a key role in salivary gland function by providing a reservoir of water and electrolytes and by participating in the differentiation of salivary cells and the exchange of nutrients and ions between them.94 The main components of the oral ECM are glycoconjugates (i.e., glycoproteins, proteoglycans and sphingolipids), which undergo continuous remodeling. Lysosomal exoglycosidases are responsible for replacing old ECM components with newly synthesized structures.39 In the present study, a significant increase in the activity of salivary exoglycosidases (HEX and HEX B) was observed in both PGs and SMGs of diabetic rats. HEX is the most active enzyme among salivary exoglycosidases.39, 40 Elevated activity of HEX and HEX B indicates increased degradation of oral-forming glycoconjugates and acquired membrane glycoproteins, which leads to disruption of oral homeostasis. The sugar chains of glycoconjugates are involved in the majority of oral processes, including interactions between glycoproteins and bacteria present in saliva.39, 40 These compounds contribute to pH regulation, mucosal hydration, immune defense, and maintenance of ecological balance in the oral cavity.95 Increased activity of lysosomal exoglycosidases (HEX, HEX B) and MMPs (MMP-2, MMP-9) in the salivary glands of rats with DM2 promotes increased degradation of ECM components. This process may disturb communication between salivary cells and nerve endings, inhibit neural transmission and signal generation, and ultimately reduce protein and water secretion.35, 40, 96, 97 Additionally, the increased activity of salivary exoglycosidases/MMPs may have accelerated the degradation of salivary gland glycoconjugates, which was not followed by the renewal of ECM components (↓FUC in the PGs and SMGs in diabetic rats). This imbalance may reduce the secretory active area of the glands and limit protein synthesis. Similar changes have been reported in type 1 diabetes mellitus.35 Chronic inflammation is likely the cause of increased salivary gland remodeling in DM2. Previous studies have shown that IL-1α, IL-1β, TNF-α, and IL-6 increase the activity of MMPs and activate intracellular apoptosis pathways, thereby contributing to salivary hypofunction.98, 99, 100 Consistent with these observations, we found significantly increased MMP-2, MMP-9 and caspase-3 activities in the PGs and SMGs of DM2 rats.
Limitations
Due to limited study material, we were unable to perform histological and histochemical analyses, which represents an important limitation. However, numerous reports describing degenerative and hypertrophic changes in salivary glands of diabetic subjects are available in the literature.56, 101, 102 It would also have been valuable to assess systemic inflammatory markers 72 h after DM2 induction. However, owing to ethical restrictions, only minimal blood sampling was permitted to confirm disease development. Further studies on the role of inflammation in the pathogenesis of salivary gland dysfunction in DM2 are required, in particular, molecular analyses determining the role of specific signaling pathways in the induction and promotion of inflammation. A detailed analysis of salivary ECM remodeling, including the activity and expression of other MMPs and tissue inhibitors of metalloproteinases (TIMPs), is also warranted. Finally, this study was conducted using a standard animal model of DM2 involving male Wistar rats. Future research should address salivary gland inflammation in both men and women with diabetes.
Conclusions
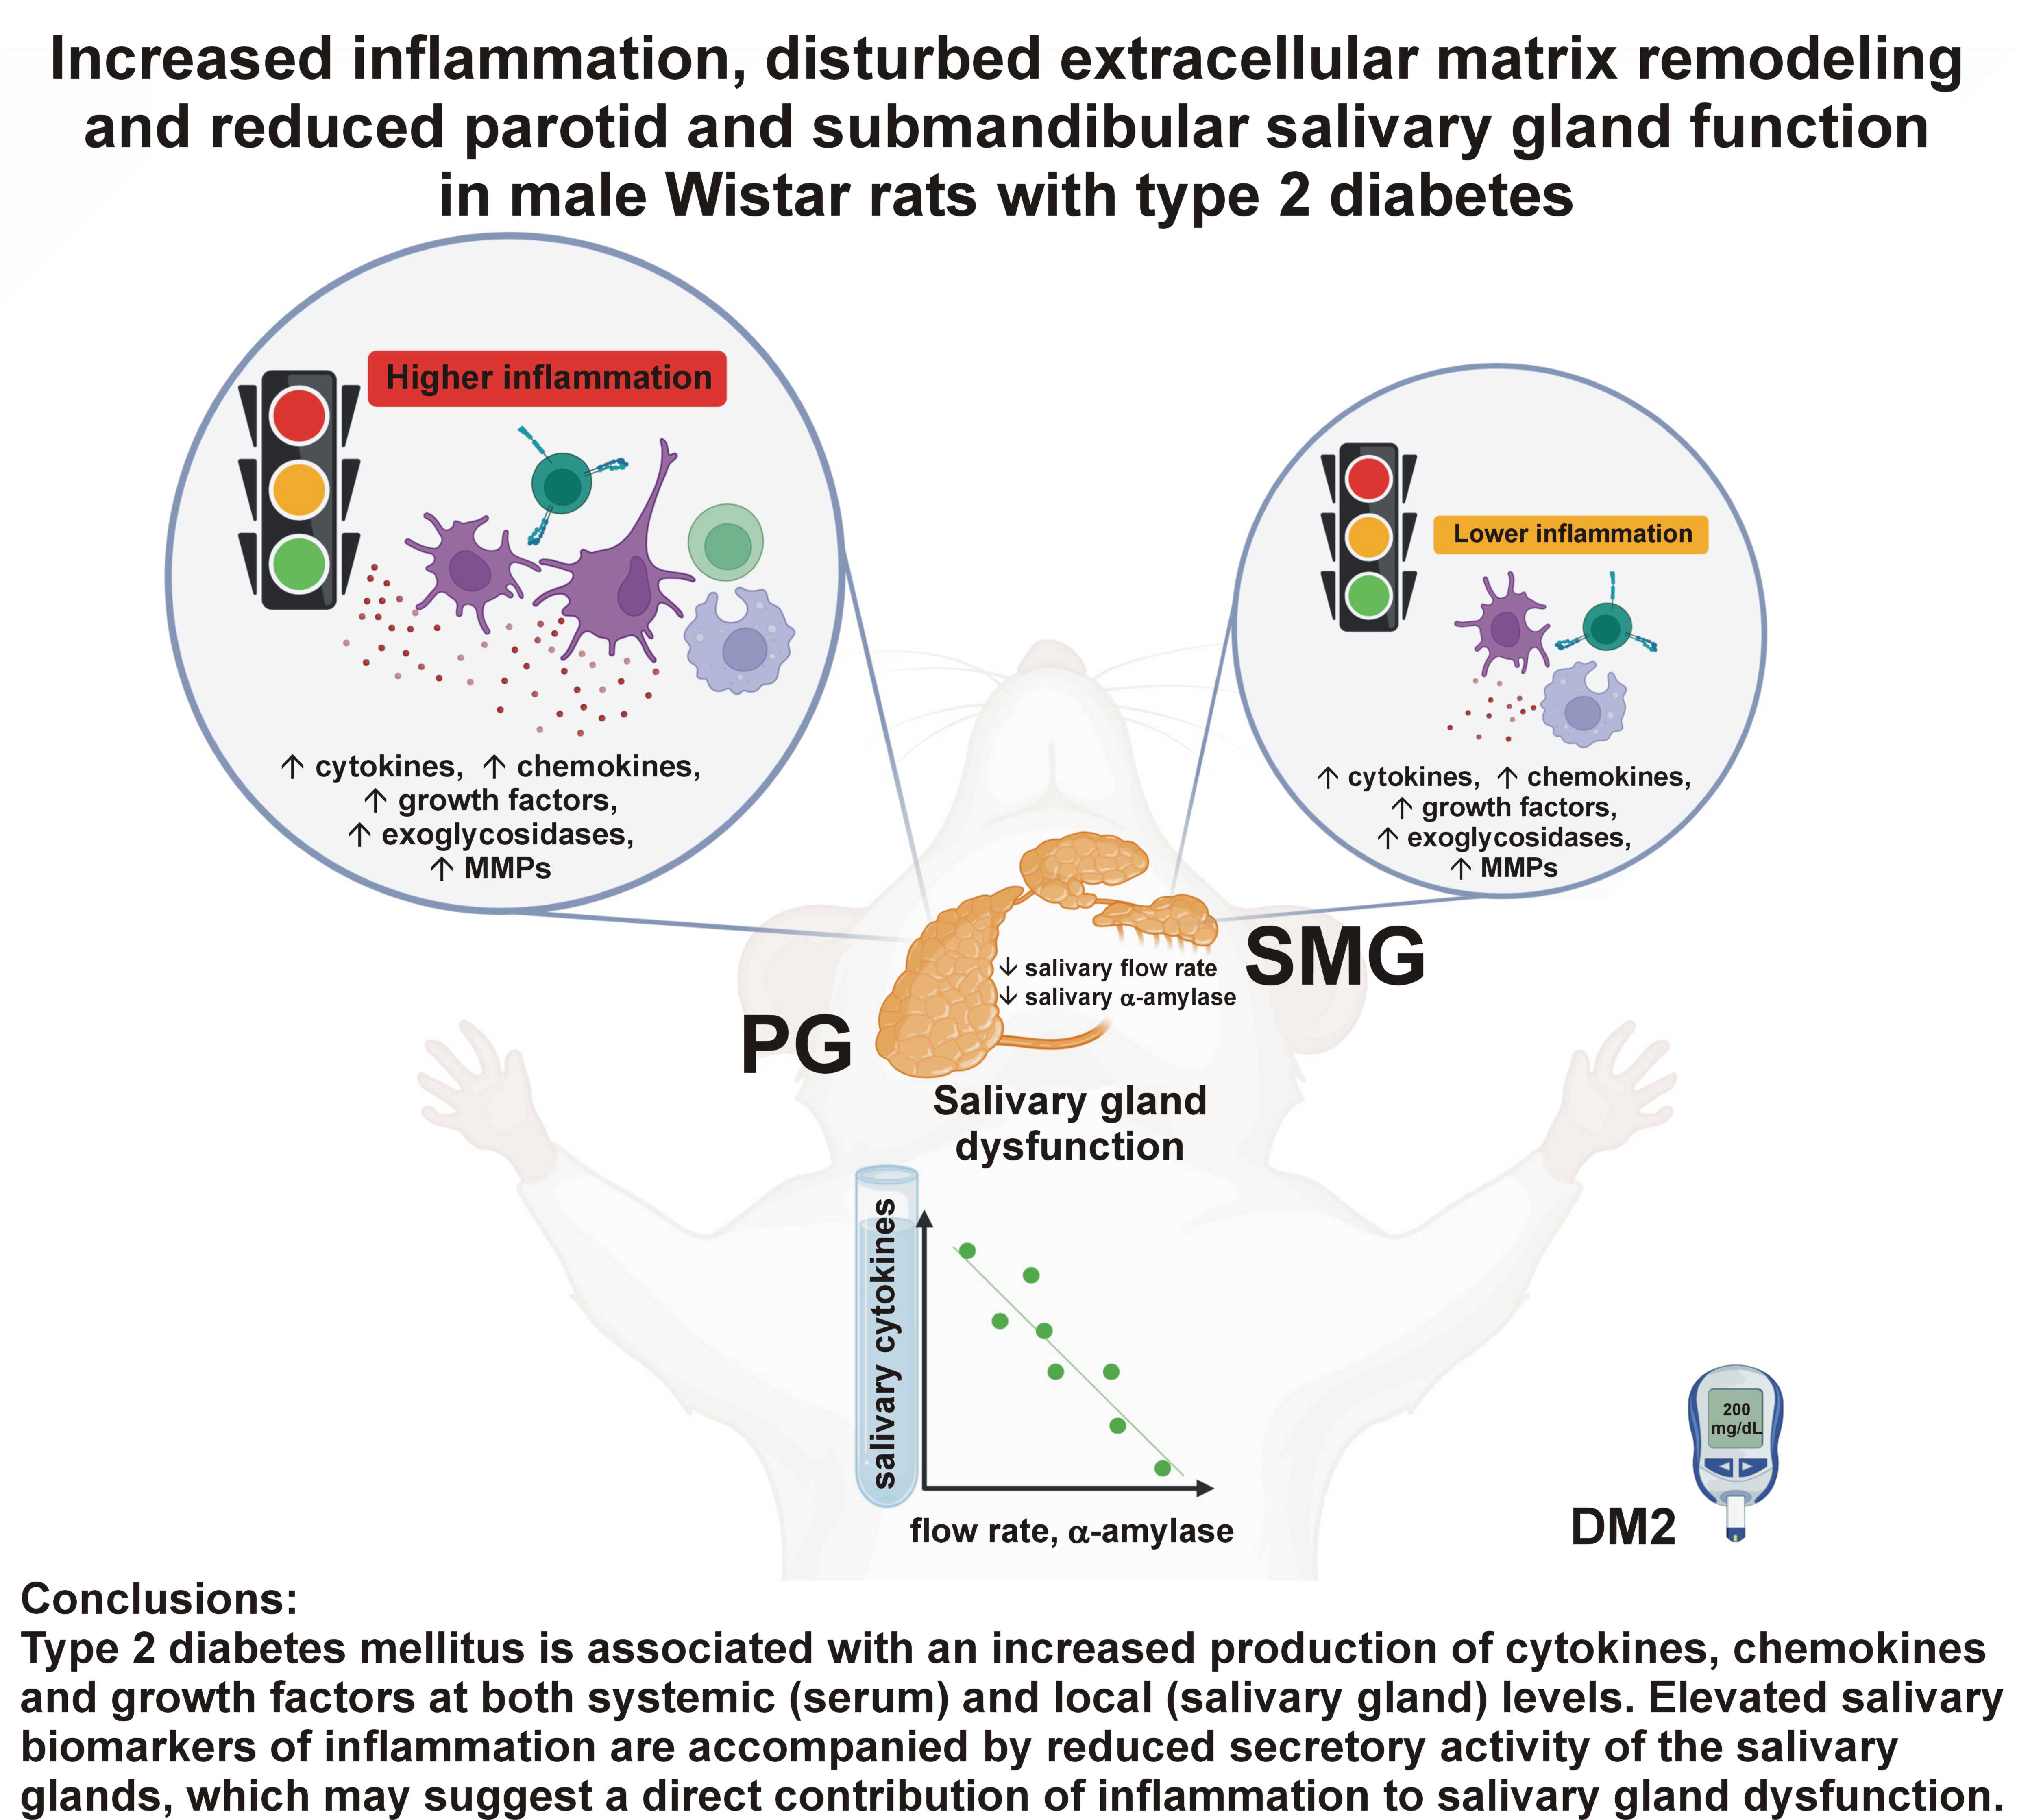
Type 2 diabetes mellitus is associated with an increased production of cytokines, chemokines and growth factors at both systemic (serum) and local (salivary gland) levels. The parotid gland appears to be the main source of salivary cytokines, chemokines and growth factors. Elevated salivary biomarkers of inflammation are accompanied by reduced secretory activity of the salivary glands, which may suggest a direct contribution of inflammation to salivary gland dysfunction. In DM2, increased ECM remodeling and increased apoptosis of glandular tissue are observed, with more pronounced impairment in the PGs. Further in vitro and in vivo studies are required to fully assess the role of inflammation in diabetic salivary gland hypofunction.
Ethics approval and consent to participate
The study was approved by the Local Ethical Committee for Animal Experiments in Olsztyn, Poland (approval No. 62/2021).
Data availability
The datasets generated and/or analyzed during the current study are available from the corresponding author on reasonable request.
Consent for publication
Not applicable.
Use of AI and AI-assisted technologies
Not applicable.