Abstract
Background. Oral cancer (OC) is a major public health problem in the Indian subcontinent. As many as 90% of all OC cases are oral squamous cell carcinomas (OSCCs), often developing from oral potentially malignant disorders (OPMDs). Although the oral cavity is freely accessible, visual identification is often challenging. Biopsy and a microscopic examination is the only confirmatory diagnostic test. Recently, the analysis of volatile organic compounds (VOCs) has emerged as a new, non-invasive, rapid, and inexpensive strategy with promising potential in clinical diagnostics. The human VOCs produced in metabolic pathways, present in body fluids and the exhaled air, can be used for monitoring several oral diseases, including OC.
Objectives. The aim of the present study was to determine the potential diagnostic capabilities of salivary VOCs in OC through identifying and comparing the salivary volatilomic profiles among OSCC and OPMD subjects, as well as healthy controls, using the gas chromatography–mass spectrometry (GC–MS) analysis.
Material and methods. Unstimulated saliva samples were collected from 35 OSCC subjects, 35 OPMD subjects and 40 healthy controls. The VOCs extracted from the ZSM-5/PDMS film were condensed with 100 µL of methanol, of which 1.0 µL was subjected to the GC–MS analysis.
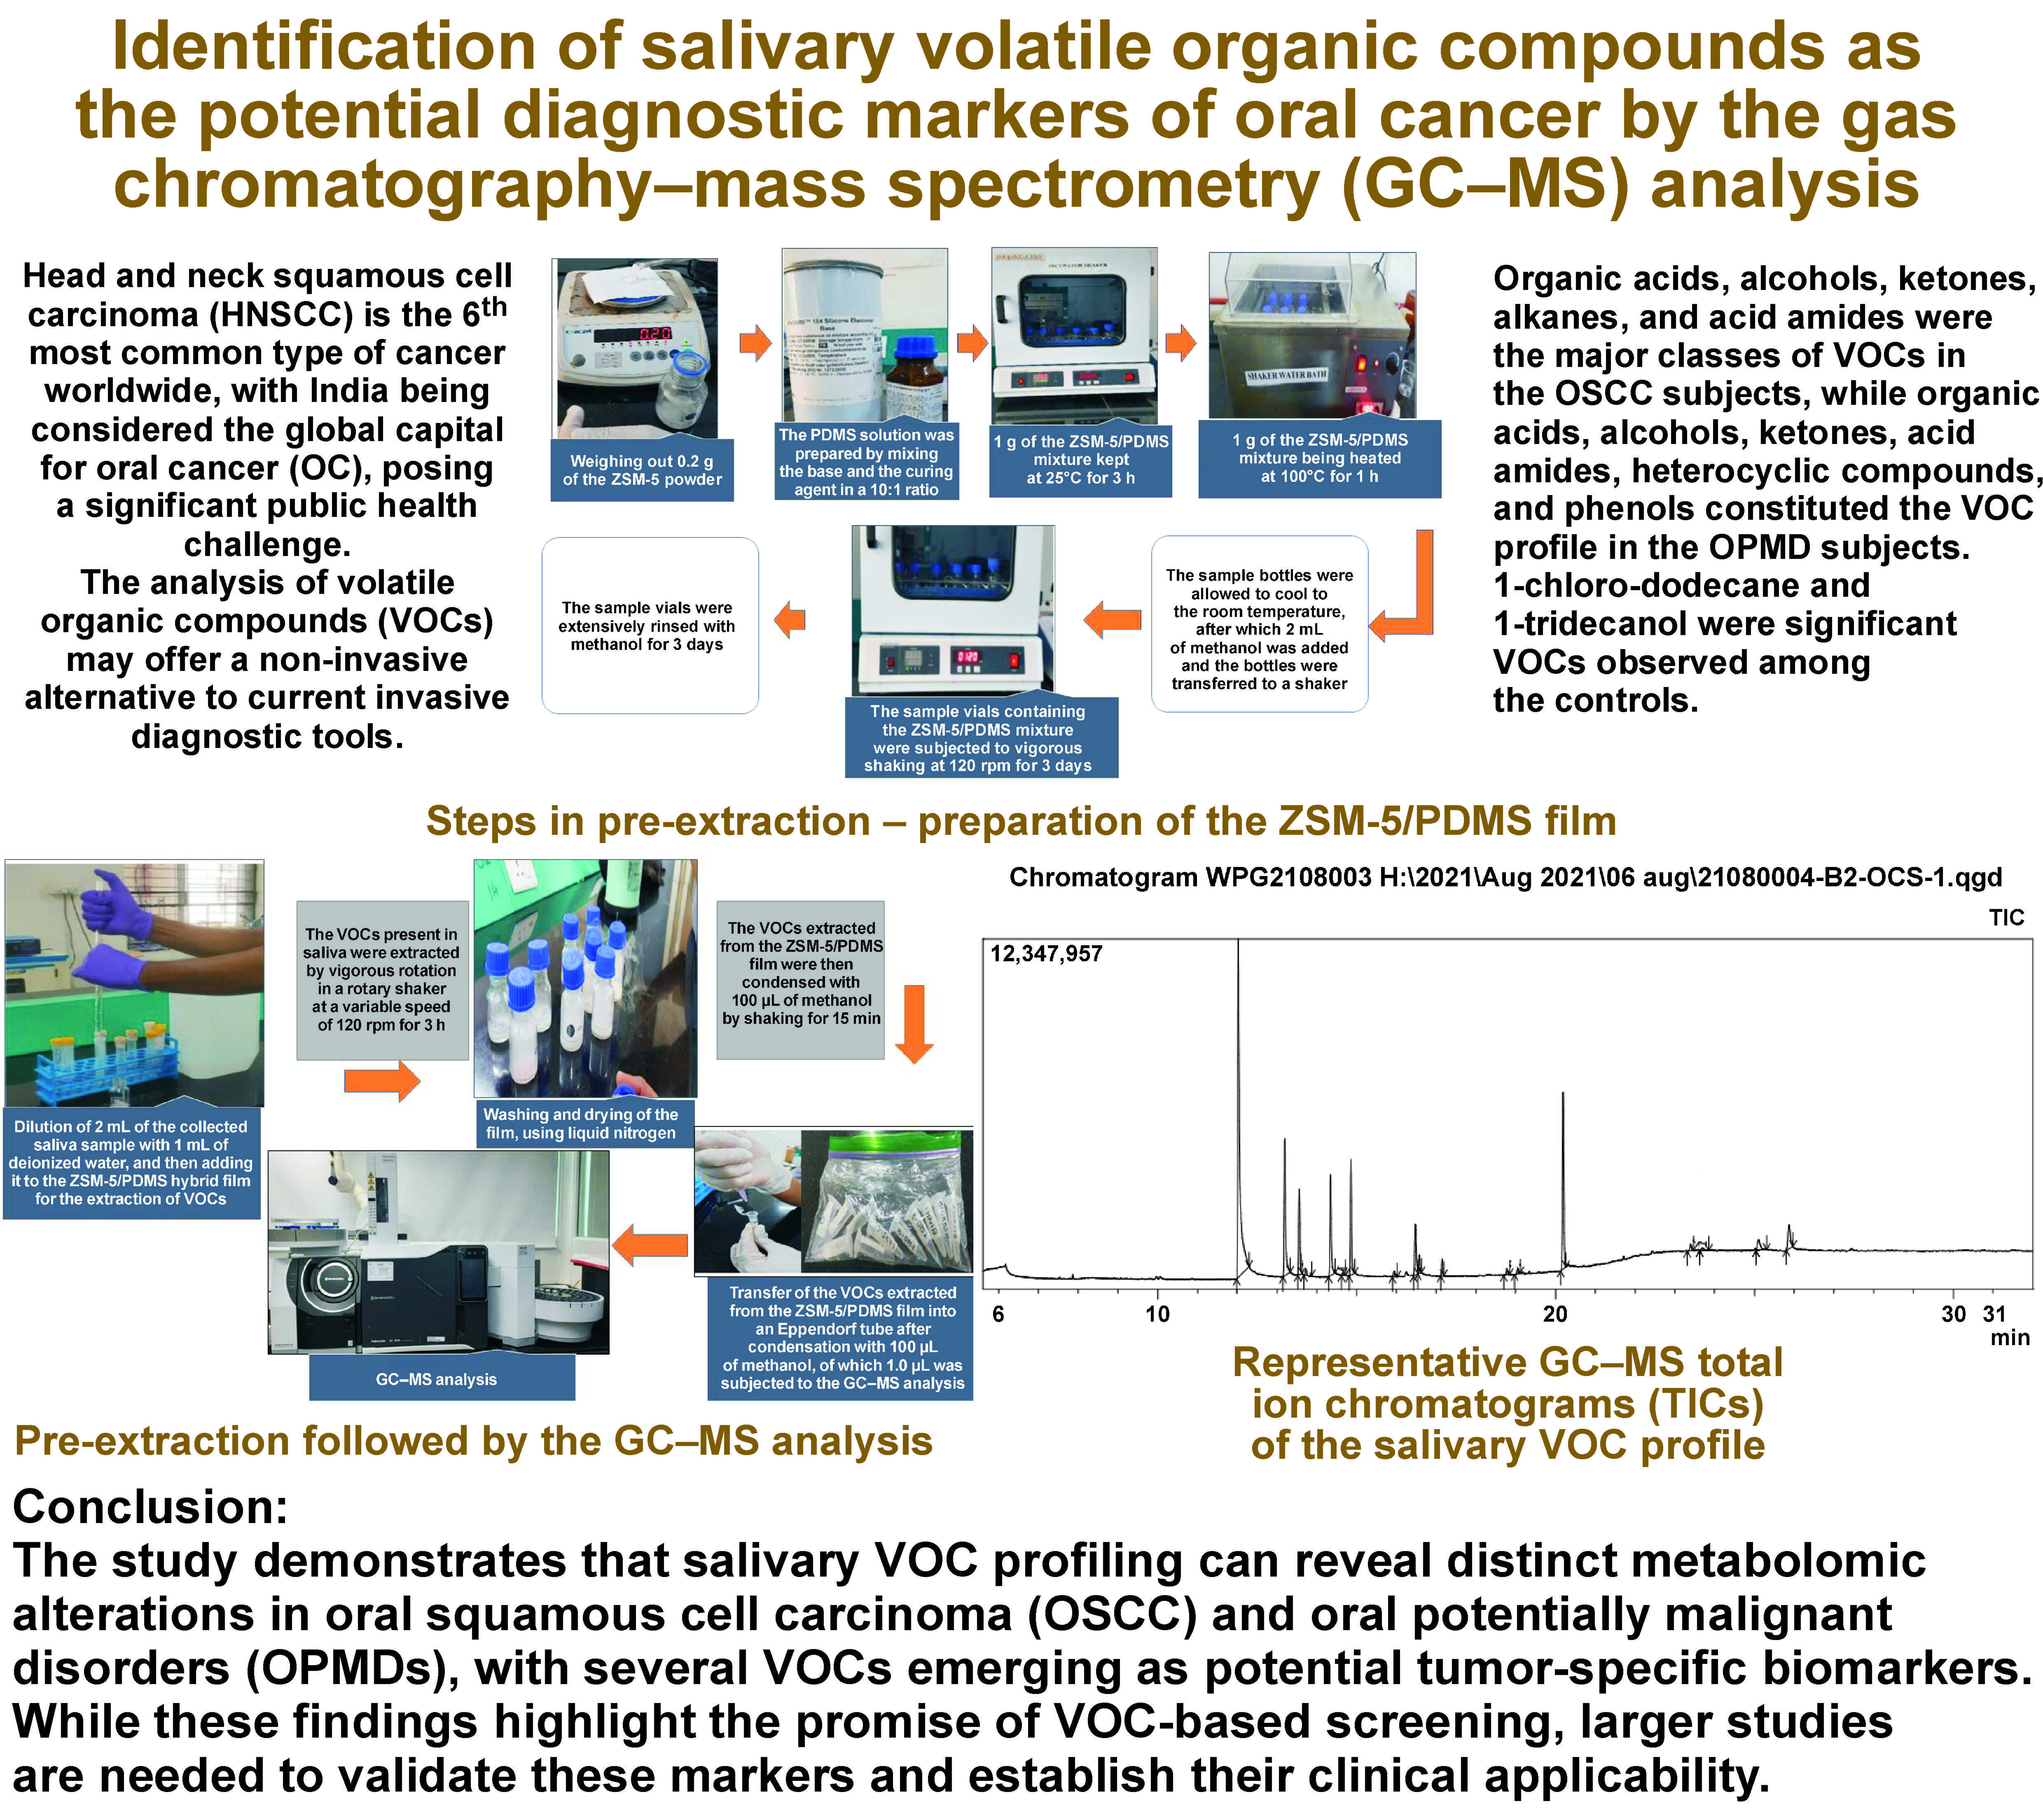
Results. A total of 128 salivary VOCs were detected and identified among the OSCC and OPMD subjects and the healthy controls. Twenty-five metabolites were determined to be statistically significant in differentiating among the 3 groups. Organic acids, alcohols, ketones, alkanes, and acid amides were the major classes of VOCs in the OSCC subjects, while organic acids, alcohols, ketones, acid amides, heterocyclic compounds, and phenols constituted the VOC profile in the OPMD subjects. 1-chloro-dodecane and 1-tridecanol were significant VOCs observed among the controls.
Conclusions. The study demonstrates that salivary VOC profiling can reveal distinct metabolomic alterations in OSCC and OPMDs, with several VOCs emerging as potential tumor-specific biomarkers. While these findings highlight the promise of VOC-based screening, larger studies are needed to validate these markers and establish their clinical applicability.
Keywords: GC–MS, OPMDs, oral cancer, salivary volatile organic compounds (VOCs), metabolomics
Introduction
Head and neck squamous cell carcinoma (HNSCC) represents the 6th most common type of cancer worldwide, with India being considered the global capital for oral cancer (OC), posing a serious health challenge.1, 2, 3 Among HNSCCs, oral squamous cell carcinoma (OSCC) arising from the mucosal surfaces of the oral cavity is the most common type, often preceded by oral potentially malignant disorders (OPMDs), such as oral leukoplakia (OL), oral submucous fibrosis (OSF), oral lichen planus (OLP), etc. Tobacco consumption, including smoked and smokeless tobacco (SLT) products, betel-quid chewing, excessive alcohol consumption, poor oral hygiene, nutrient-deficient diet, and sustained viral infections, e.g., human papillomavirus (HPV), are some of the risk factors associated with the development of OSCC. As compared to the West, the concern with regard to OSCC is significantly higher in India, where about 70% of cases are detected in the advanced stages of the disease, contributing to an increased mortality rate,4 with the 5-year survival rates around 40%, despite advances in therapy. Hence, early diagnosis and treatment remain the key to improved patient survival.
Most of the research efforts today are focused on the prevention and early detection of the tumor. The visual and screening tests widely used for diagnosis include clinical methods, a cytopathology examination and visualization adjuncts, like tissue autofluorescence. However, the efficacy of these modalities is limited by gaps in the clinician’s knowledge and experience, as well as the anatomical site being examined.5 Although the histopathological examination has remained the gold standard for diagnosing oral dysplastic changes, it is invasive and often tedious to patients; moreover, early lesions of OSCC, including premalignant lesions, are subtle and rarely exhibit the clinical features observed in the established lesions. Hence, there is a high demand for simple, non-invasive and low-cost alternatives, along with a strong unmet need for novel diagnostic tools and prognostic determinants. This underscores the importance of developing new methods for cancer detection.
Some of the approaches include genomics, proteomics and metabolomics. Amongst these, one of the most promising metabolomic approaches is that of volatile organic compounds (VOCs), a family of carbon-containing compounds. Volatile organic compounds cover a range of chemical classes, including aliphatic, aromatic and chlorinated hydrocarbons, aldehydes, ketones, esters, ethers, acids, and alcohols. They are supposed to serve as a potential and specific tool in early cancer detection in breath and body fluids, through the use of various analytical techniques, like gas chromatography–mass spectrometry (GC–MS). Such metabolic profiles act as chemical signatures, capable of characterizing specific processes in the organism, thereby potentially indicating pathologies like OSCC, OPMDs, and other biochemical disorders. During carcinogenesis, there is altered metabolism and upregulated aerobic glycolysis known as the Warburg effect, which induces oxidative stress.6, 7 This liberates highly reactive oxygen species (ROS) that induce the lipid peroxidation of (poly)unsaturated omega-3 and omega-6 fatty acids (PUFAs) in the cellular membranes, mostly generating alkanes and aldehydes as end-products. Considering the high number of hydrocarbons and aldehydes detected in several matrices, this plays a major role in HNSCC and, therefore, the compounds are biomarkers of interest.
Volatile organic compounds are considered potential biomarkers in non-invasive early cancer detection, as screening tools, especially for high-risk patients, e.g., smokers and heavy drinkers, and are also used for post-therapeutic monitoring for recurrence. They have already shown potential as biomarkers for lung, gastric, breast, and prostate cancer, and mesothelioma. Since carcinogenesis is related to inflammation and metabolic changes, VOCs may provide additional diagnostic value as biomarkers for OSCC. However, VOC expression in OSCC has been meagerly reported in the literature, and a major proportion of these studies have analyzed VOC biomarkers in breath. Hence, a substantial gap exists in the use of salivary VOCs as the potential biomarkers of OSCC in clinical practices.
Saliva contains a wide range of analytes – hydrocarbons, proteins, peptides, hormones, gingival exudates, microbiota, and various small organic metabolites – that exhibit high responsiveness to physiological changes, making it a valuable biofluid for obtaining systemic information. Volatile organic compounds are transferred from blood to saliva, mainly via passive diffusion. Hence, salivary VOCs can reflect metabolic changes in response to degeneration, inflammation, necrosis, cancer, microbiota alteration, or external factors, such as environmental pollution, medication use and diet.8 In addition, the use of saliva as a diagnostic tool for OSCC offers several advantages, including the ease of collection, non-invasiveness and cost-effective applicability for screening large populations. Moreover, dysplastic cells from the oral mucosa are continuously shed into saliva due to its close proximity to the epithelial surface. This facilitates the sampling of cells from occult sites, such as the tonsillar crypts, which are otherwise difficult to assess during a routine oral examination.
This study was undertaken to investigate OSCC- and OPMD-associated metabolic adaptations in cells, and to comparatively analyze salivary VOC profiles among OSCC patients, individuals with OPMD and healthy controls by identifying VOC alterations with the use of GC–MS.
Materials and methods
This is a cross-sectional study with 3 groups of participants: OSCC subjects (group 1); OPMD subjects (group 2); and healthy controls (group 3).
Study setting and ethical considerations
The study included OSCC, OPMD and healthy subjects reporting between January 2020 and October 2021 to the Department of Oral Medicine and Radiology and the Department of Surgical Oncology, M.S. Ramaiah Teaching Hospital, Bengaluru, India.
Ethical clearance was obtained from the Ethics Committee for Human Trials of M.S. Ramaiah University of Applied Sciences, Bengaluru, India (No. EC-2020/PG/36). Informed written consent was obtained from patients and controls after explaining the nature of the study. A total of 110 subjects were included in the study: 35 in group 1; 35 in group 2; and 40 in group 3.
Study participants
The inclusion criteria: patients aged >18 years; the histopathological confirmation of OSCC or OPMD; the absence of any treatment at the time of the study, including surgery, chemotherapy or radiation; and good oral hygiene. Age and gender-matched control subjects: without a history of hypertension, diabetes or thyroid disorders, and the use of related medications; without any deleterious habits. The exclusion criteria: subjects with conditions affecting the quantity and quality of saliva (dry mouth, inflammatory and autoimmune salivary gland diseases, etc.).
Sample collection
Unstimulated saliva samples were collected between 8.00 a.m. and 11.00 a.m. (due to the circadian rhythm affecting the salivary flow). The subjects were asked to refrain from using alcohol, tobacco, food, and any oral hygiene products, such as toothpaste and mouthwash, 2 h prior to sample collection. Each subject was asked to thoroughly rinse their mouth with water. Unstimulated saliva (2 mL) was collected in a sterile 10-milliliter glass vial with a screw cap, immediately placed on dry ice in a cold storage box, and stored at −20°C until the pre-extraction process was performed. The collected samples were transported using the cold storage box to Wipro Food and Drug Laboratory, Bengaluru, India, for further processing and analysis. The process was repeated until a sample size of 100 was achieved.
Preparation of the ZSM 5/PDMS hybrid film
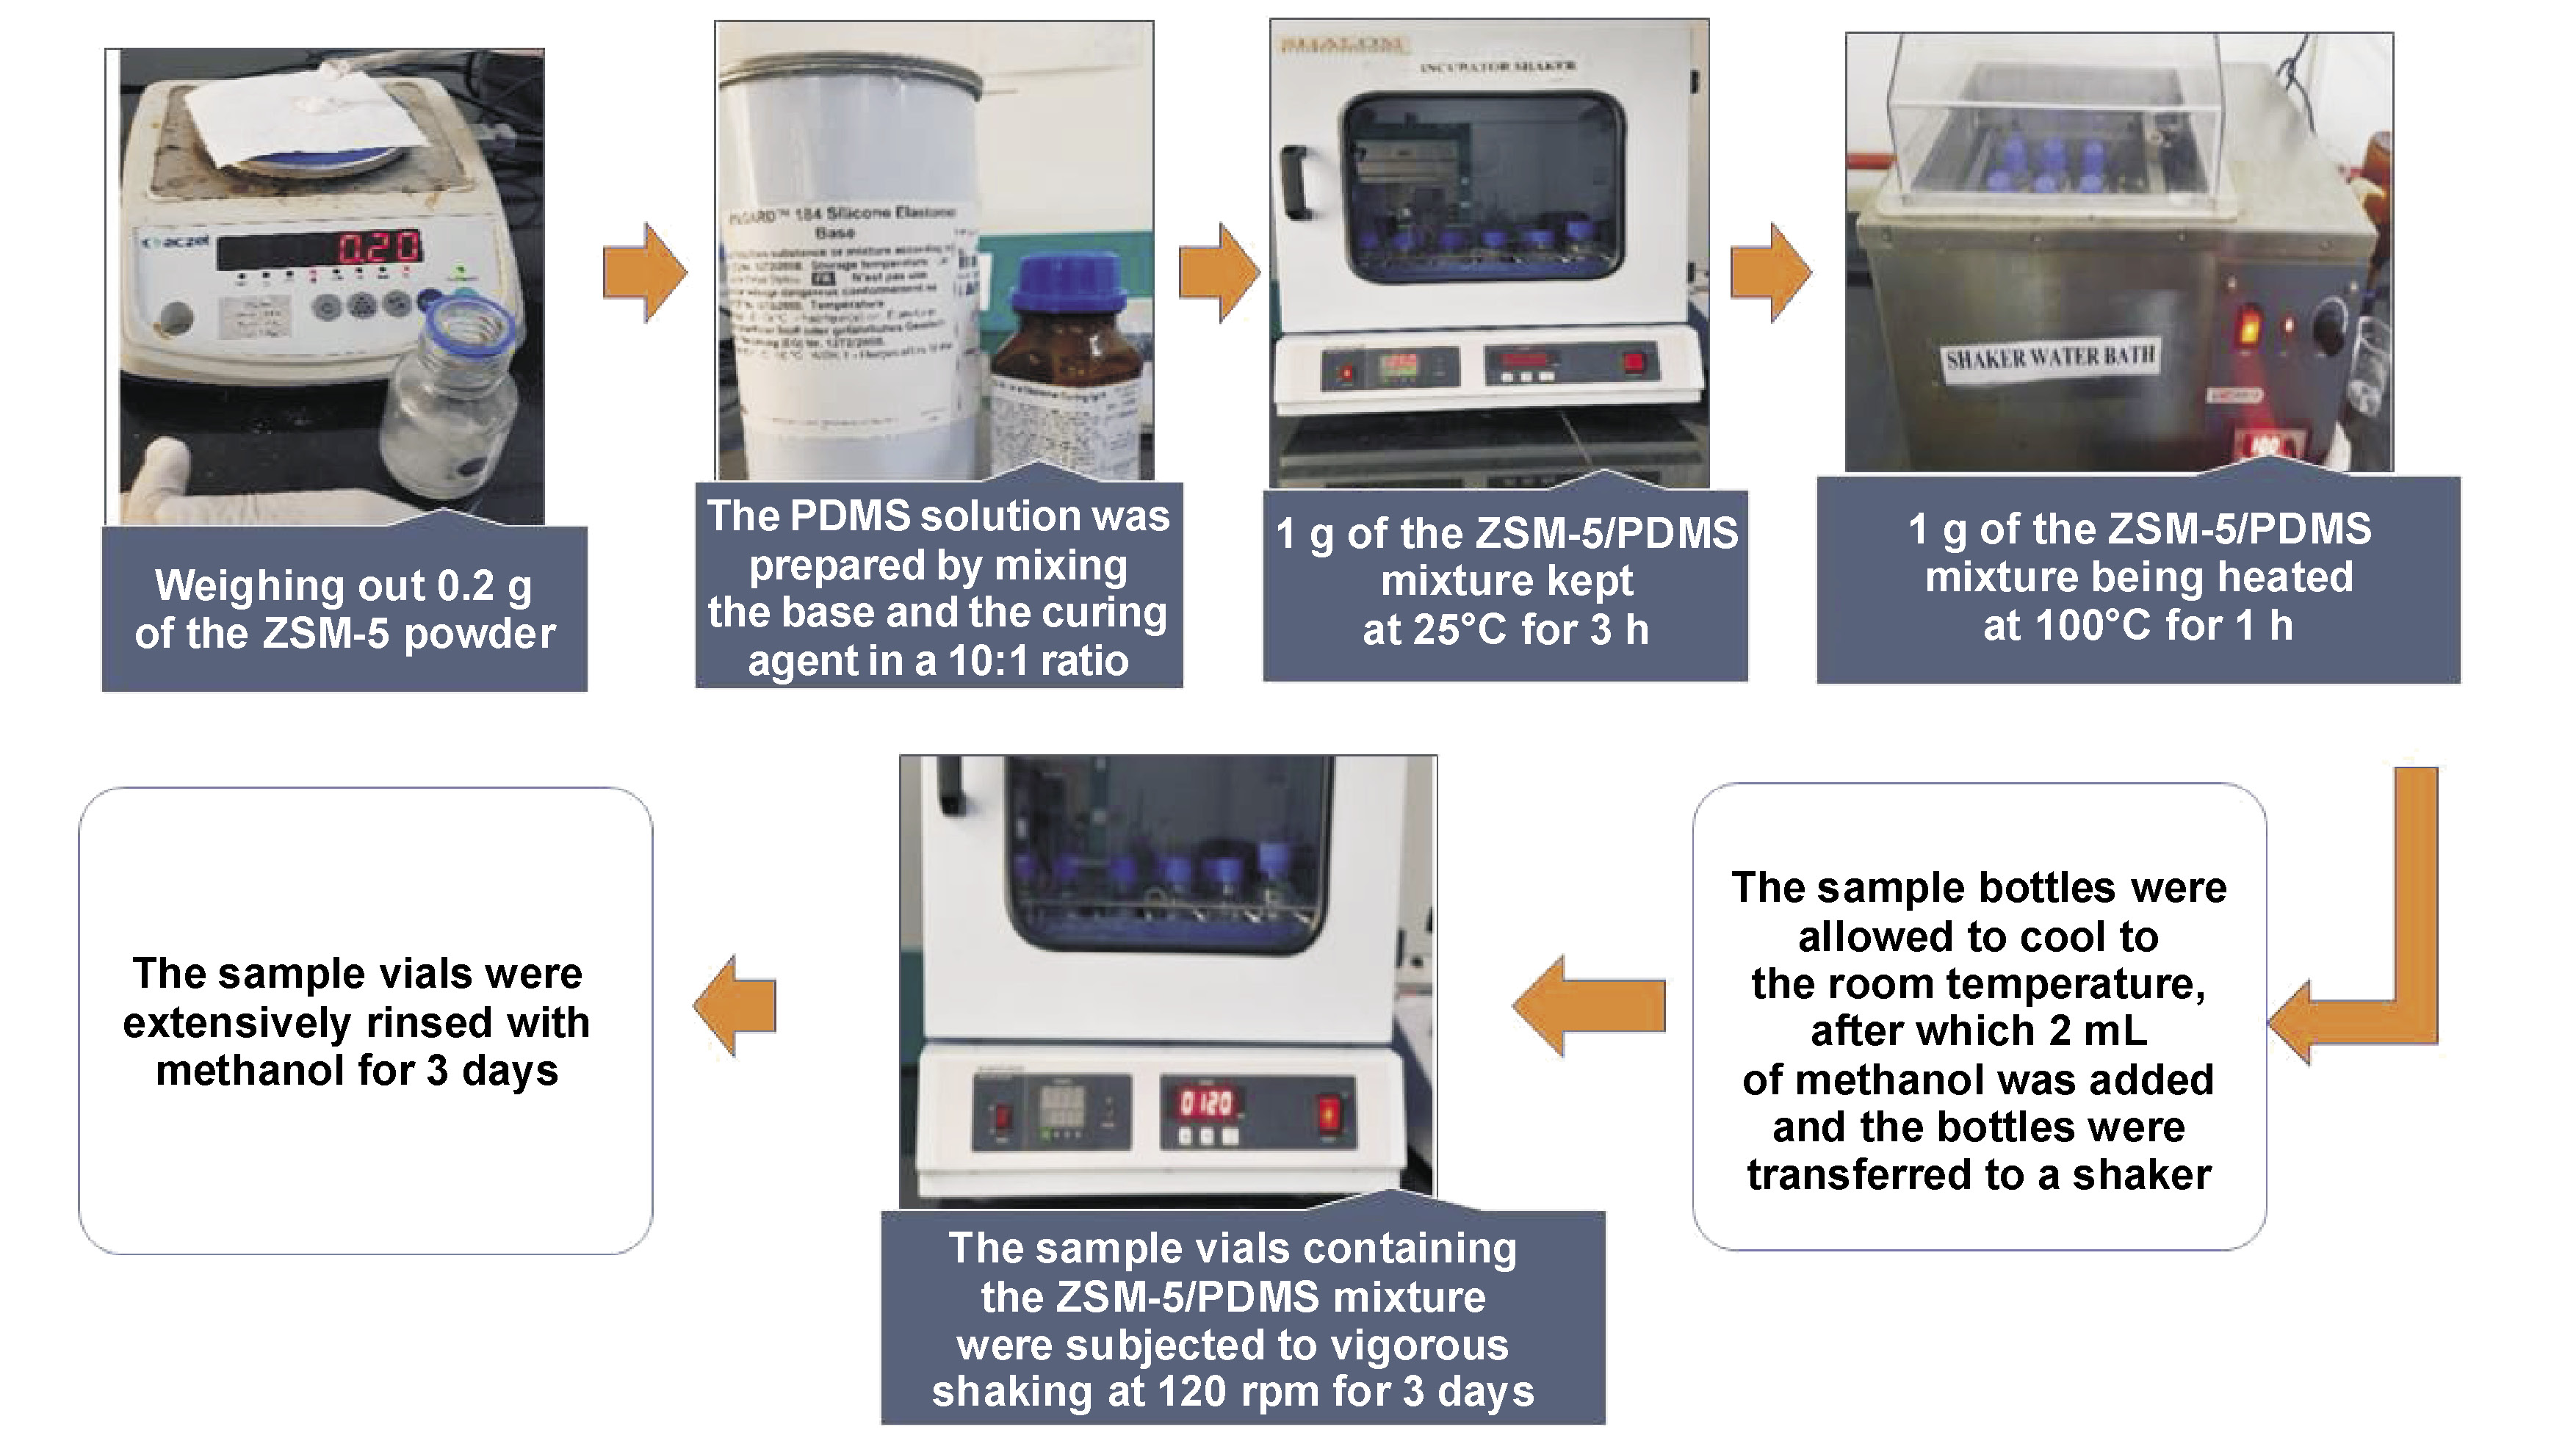
For the fabrication of the ZSM-5/PDMS hybrid film, a 50-milliliter glass bottle was used as the supporting substrate. The PDMS solution was prepared by mixing the base and the curing agent in a 10:1 ratio, and then blending it with ZSM-5 to obtain a 20 wt.% ZSM-5 mixture within the PDMS matrix prior to solidification. One gram of this mixture was placed in the glass bottle and kept at 25°C for 3 h, followed by heating at 100°C for 1 h. The resulting sample vials containing the ZSM-5/PDMS film were thoroughly rinsed with methanol and shaken at 120 rpm for 3 days to remove any unreacted PDMS monomers (Figure 1).
Sample analysis
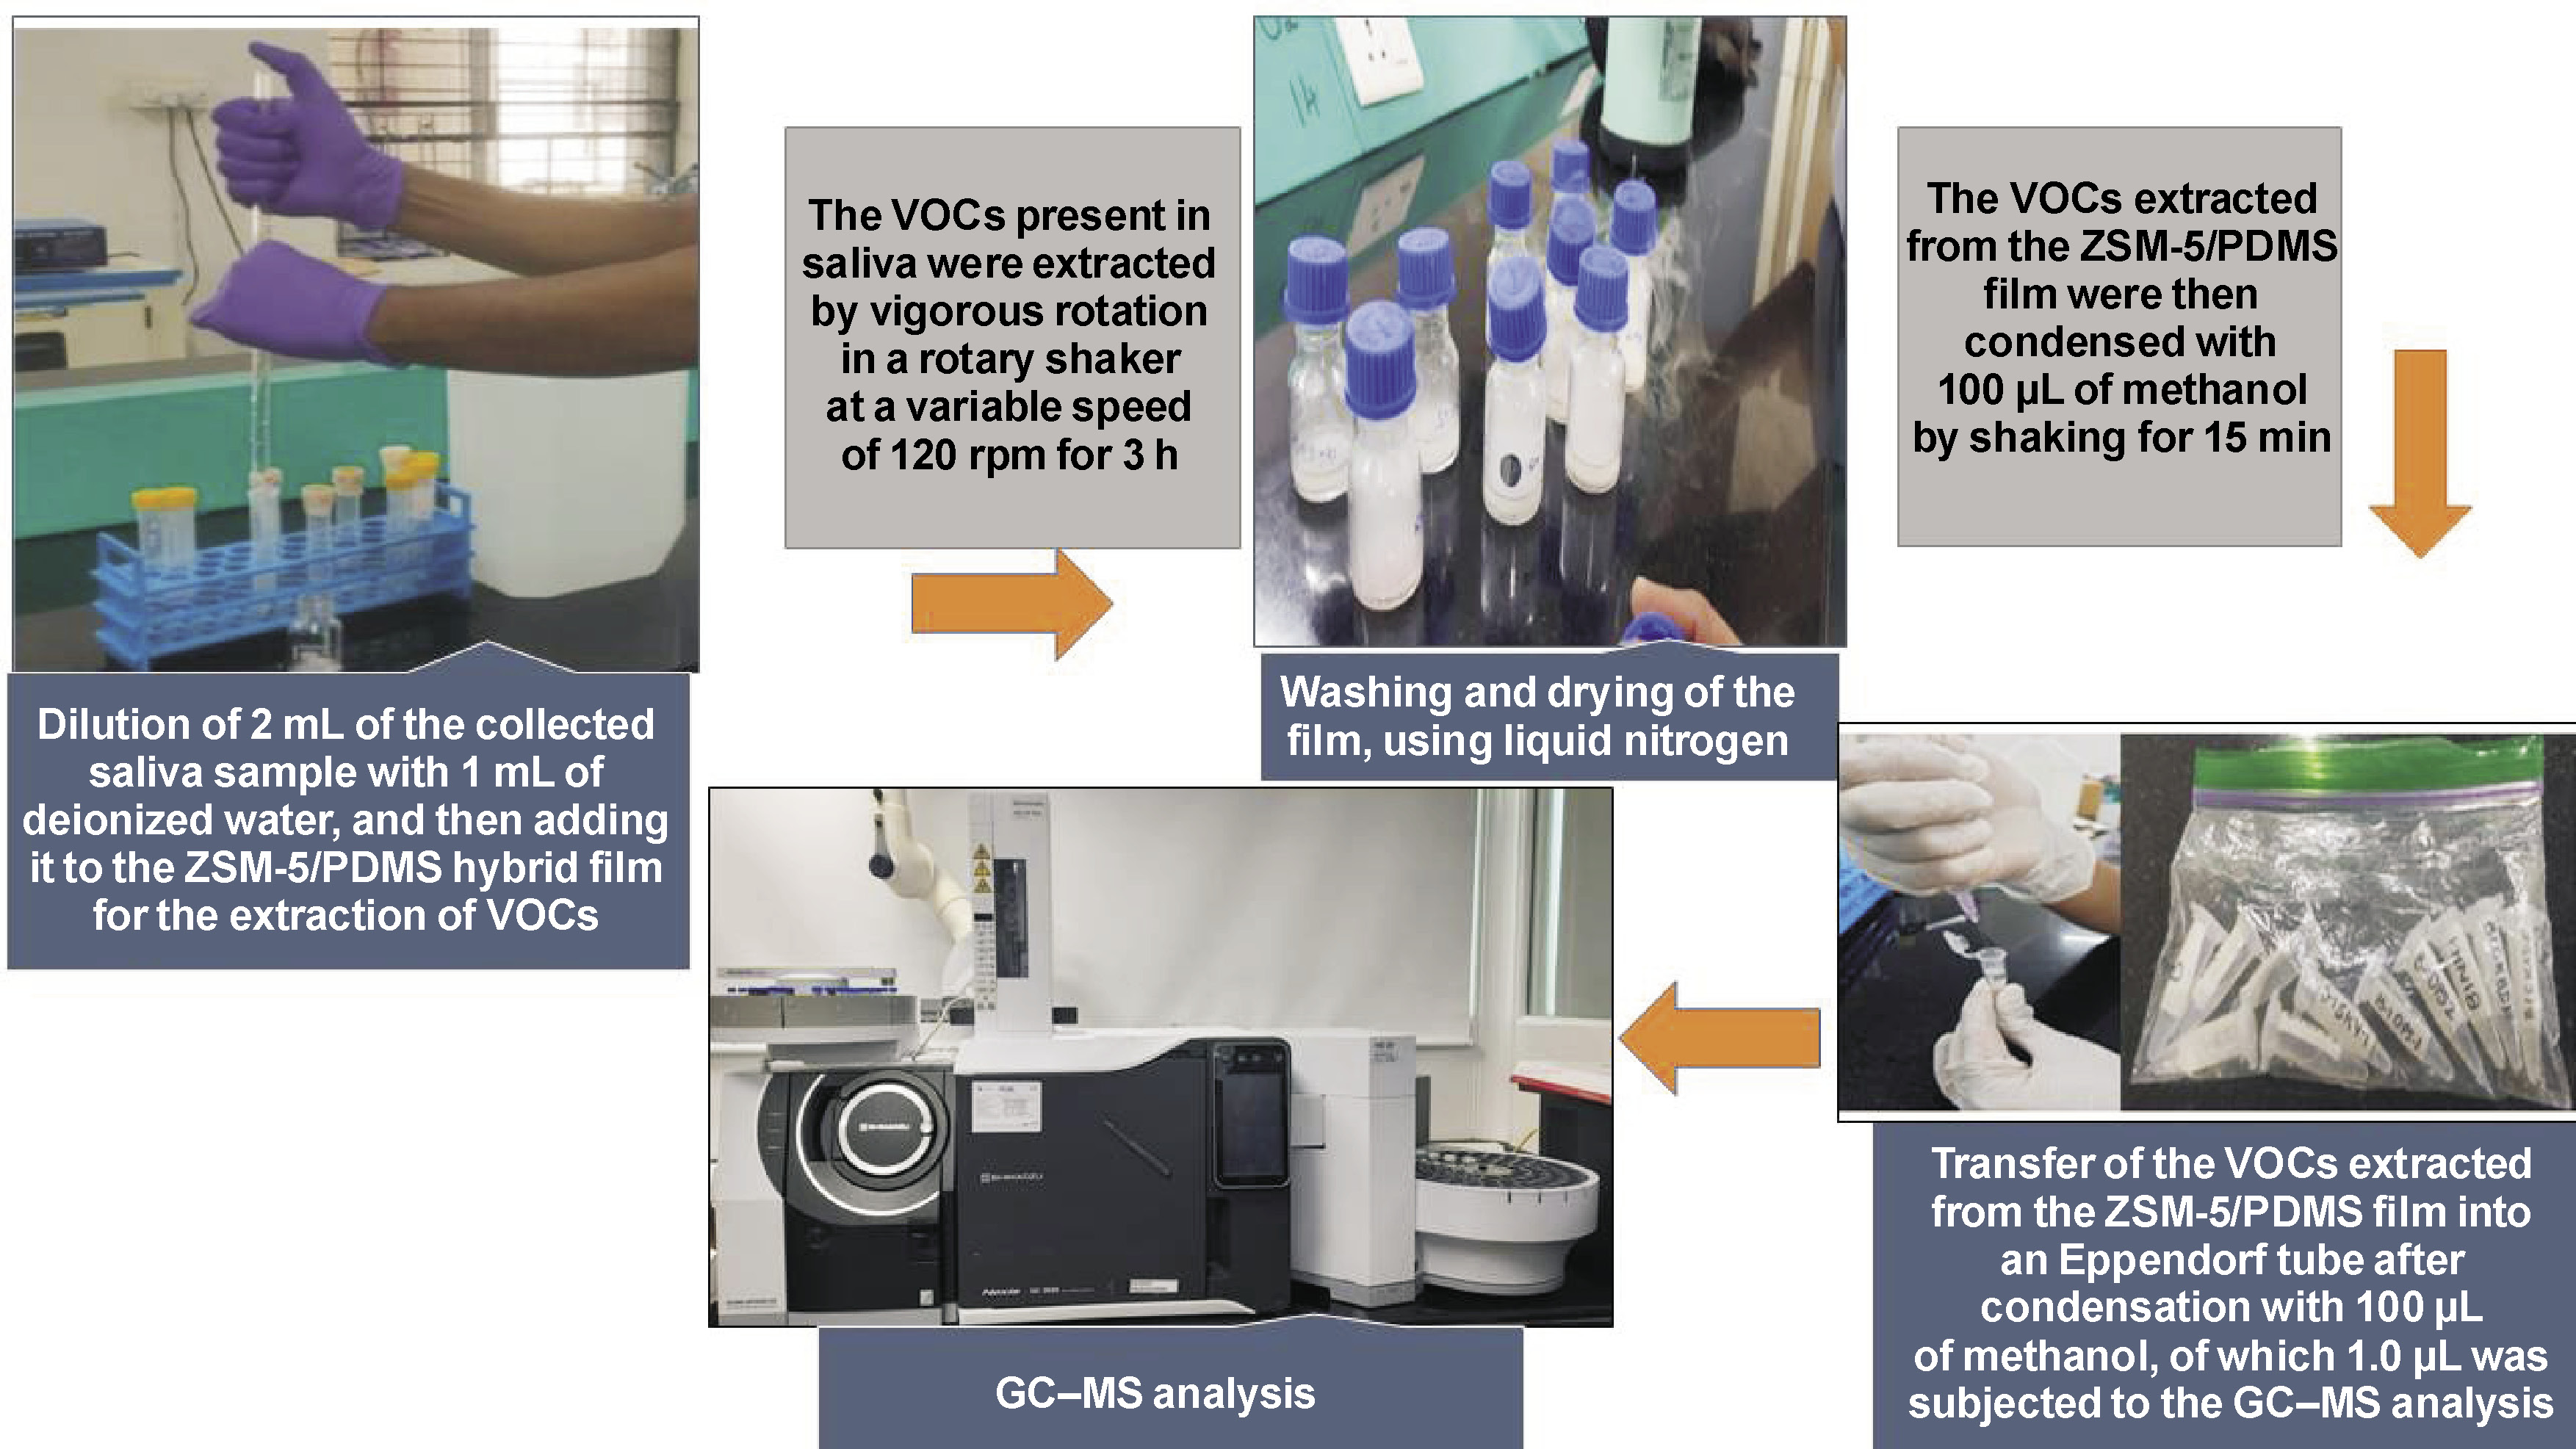
The 2 mL of the collected saliva sample was diluted with 1 mL of deionized water and added to the ZSM 5/PDMS hybrid film. The VOCs present in saliva were then extracted using a rotary shaker with a variable speed of 120 rpm by vigorously shaking the glass extraction bottle. The extraction container was carefully cleaned with pure water before being dried with liquid nitrogen. Finally, the VOCs extracted from the ZSM-5/PDMS film were condensed with 100 µL of methanol, of which 1.0 µL was subjected to the GC–MS analysis using a GC–MS machine (GCMS-QP2020 NX; Shimadzu, Kyoto, Japan) (Figure 2).
GC–MS conditions
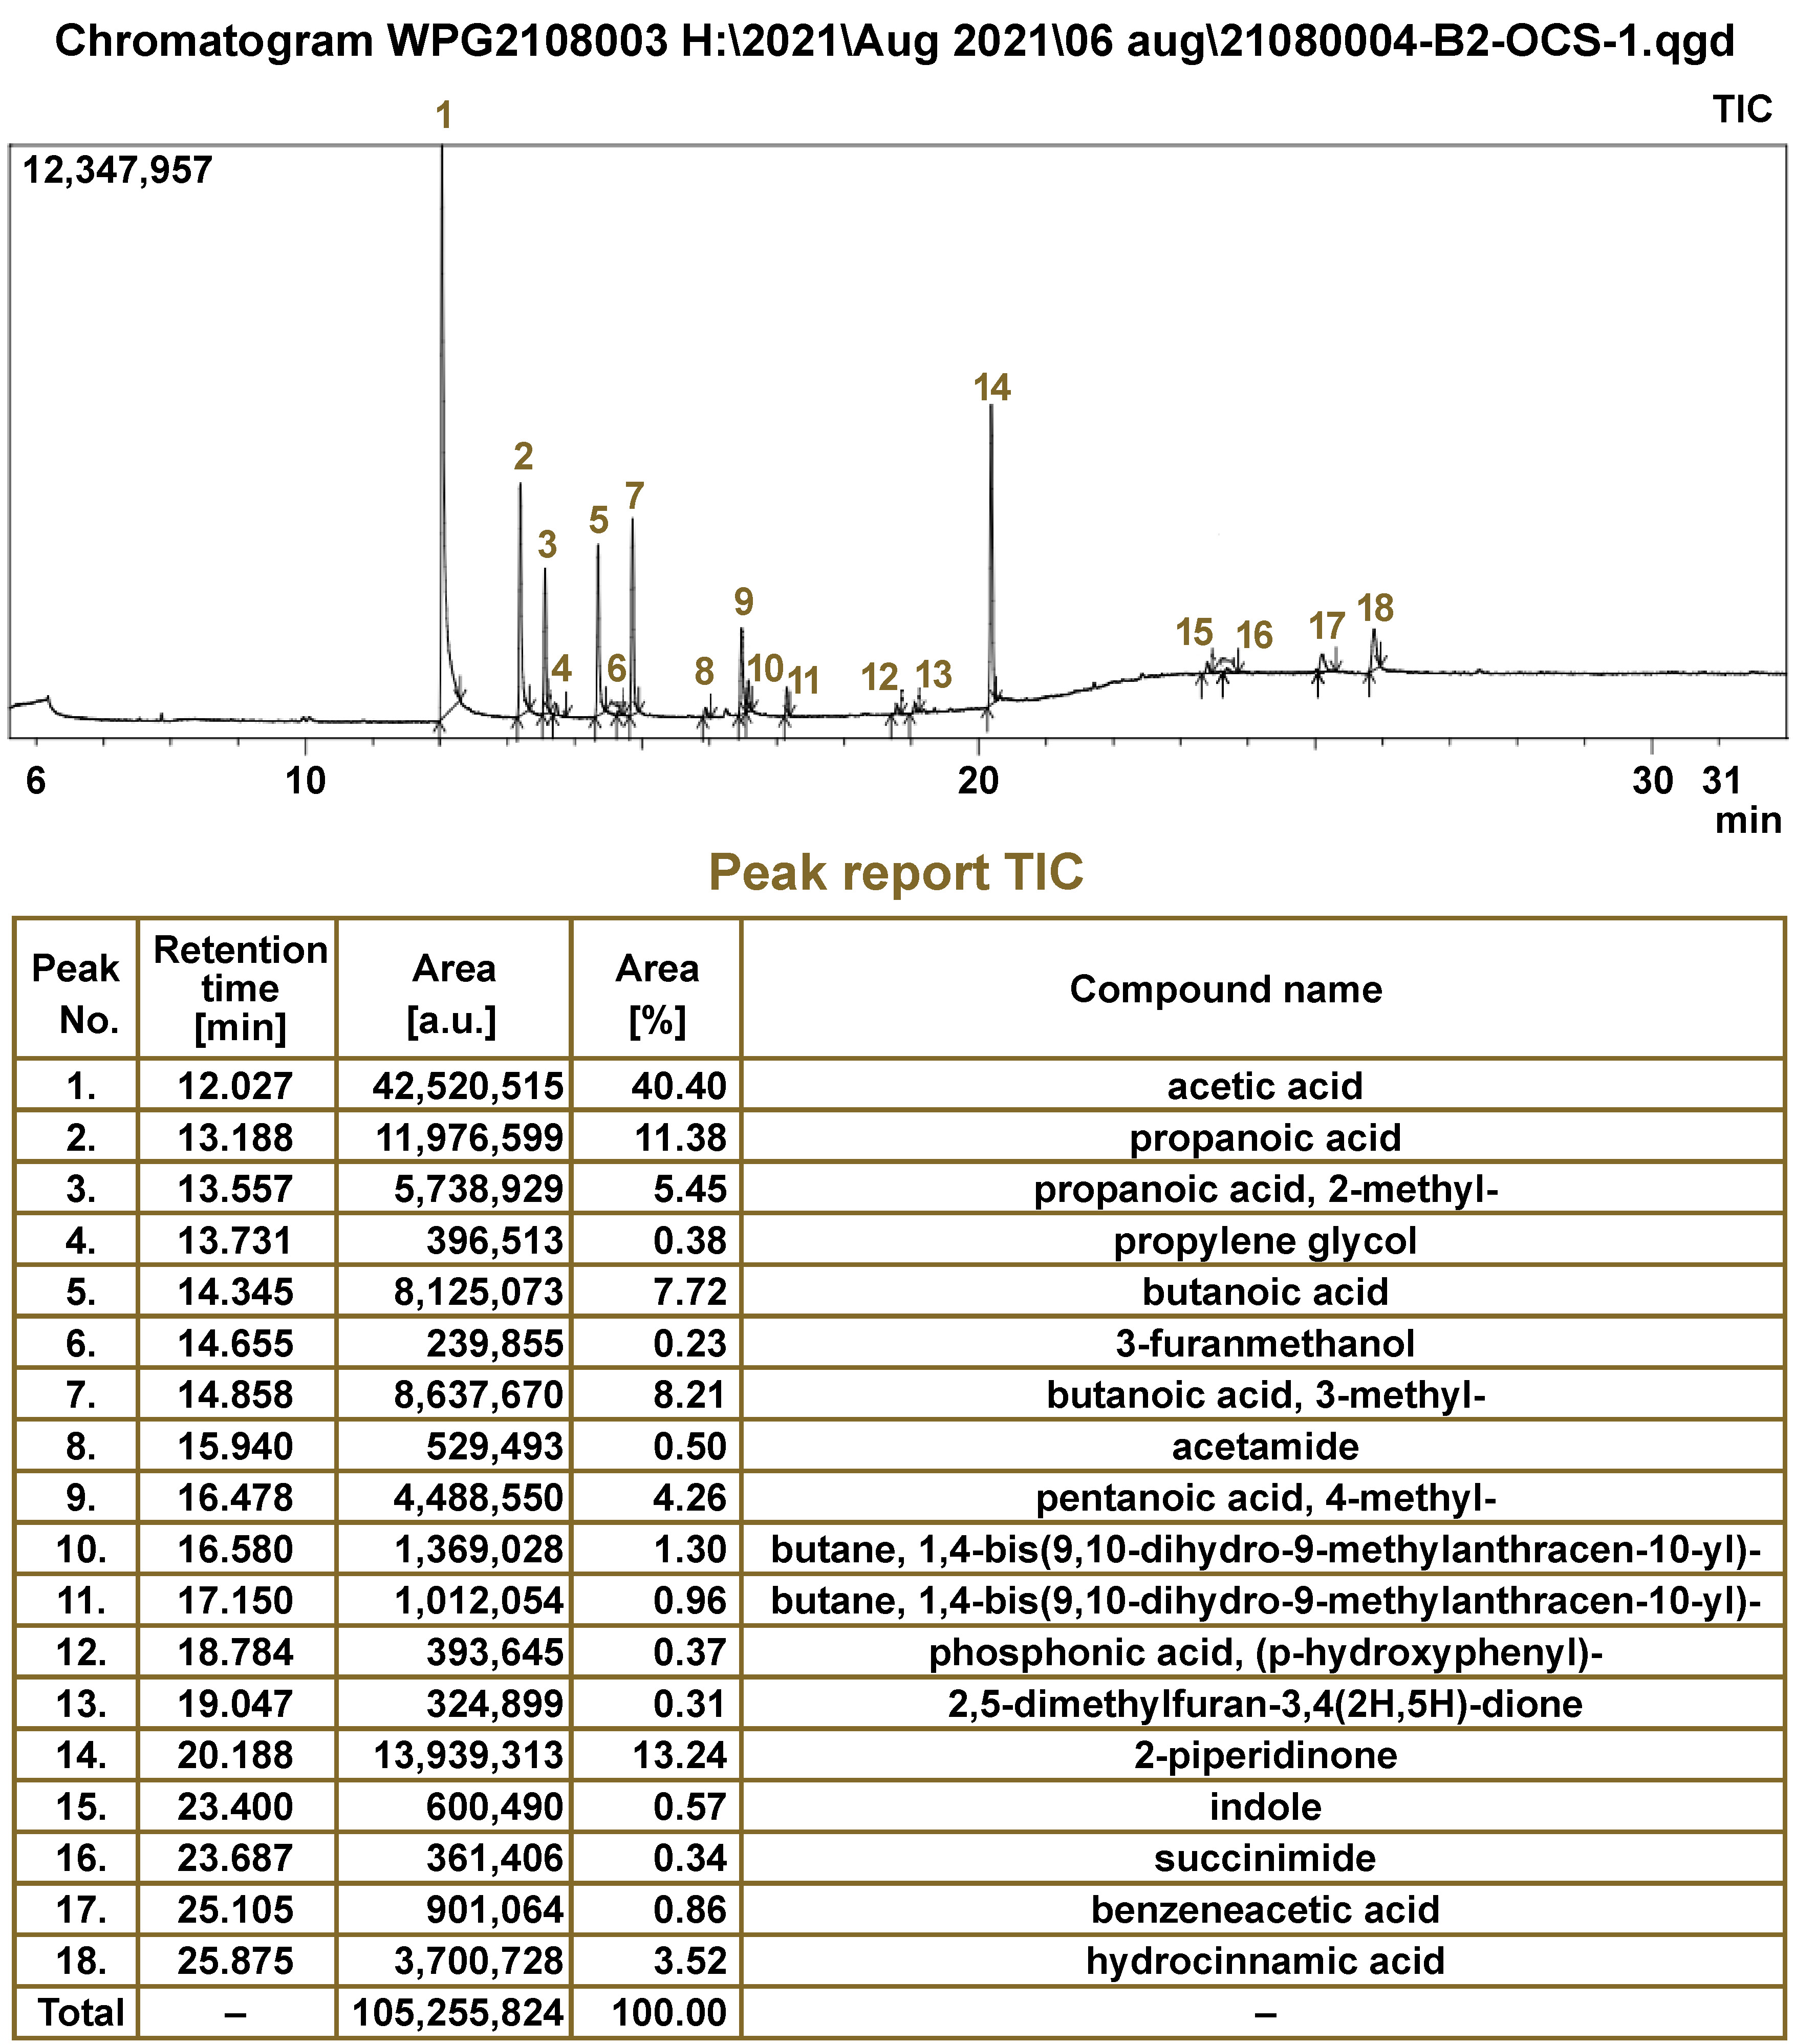
The GC–MS machine was used for the chromatographic analysis with mass spectrometric detection in the electron ionization mode at 70 eV. The interphase temperatures of the GC ion source were kept at 200°C and 230°C, respectively. Separation was accomplished using the HP-INNOWax capillary column (polyethylene glycol-based high-polarity stationary phase, length of 30 m, an inner diameter of 0.320 mm, film thickness of 0.25 m; 19091N-113I; Agilent, Santa Clara, USA). The mobile phase was 99.99% ultrahigh-quality helium gas, flowing at 1.78 mL/min. The temperature of the GC injection was fixed at 230°C. The oven temperature was set at 40°C for 3 min, then raised to 230°C at a rate of 10°C per minute for 5 min. The retention time data was recorded from 5 min 6 s to 27 min. Data acquisition was performed in the full scan mode with m/z = 35–500 and a scan time of 0.3 s. The mass spectrum library search program from the National Institute of Standards and Technology (NIST) (v. 2.3) was used to identify the sample chemicals. Compounds having a structural similarity score of over 700 were chosen as the validating biomarkers for successful VOC detection (Figure 3).
Results
A total of 110 subjects participated in the study, including 35 OSCC subjects (group 1), 35 OPMD subjects (group 2) and 40 healthy controls (group 3). The demographic characteristics of the subjects are summarized in Table 1.
Group 1 comprised 35 OSCC subjects: stage I – 4 (11.4%); stage II – 2 (5.7%); stage III –16 (45.7%); and stage IV – 13 (37.1%). With regard to the histopathological diagnosis, OSCC was well differentiated in 10 cases (28.6%), moderately in 20 (57.1%) and poorly in 5 subjects (14.3%). The buccal mucosa (both right and left) was the most common site of OSCC, accounting for 13 cases (37.1%), followed by the base and lateral border of the tongue in 8 (22.9%), the gingivobuccal sulcus in 4 (11.4%), the alveolus in 4 (11.4%), the retromolar trigone area in 3 (8.6%), the soft palate in 2 subjects (5.7%), and the upper lip in 1 patient (2.9%) (Table 2).
Group 2 comprised 35 OPMD subjects, including 12 (34.3%) with OL (6 homogeneous and 6 non-homogenous OL cases), 14 (40.0%) with OSF and 9 (25.7%) with OLP. Most of the OL patients had a clinical staging of C1L1P1 – 4 (33.3%) and C2L1P1 – 4 (33.3%). Among the OSF patients, 6 (42.9%) were in grade 2 and grade 3 (in total 12), with 2 (14.3%) in grade 1 and no subjects in grade 4. The REU staging in OLP patients showed a varied distribution (Table 2).
Sample information
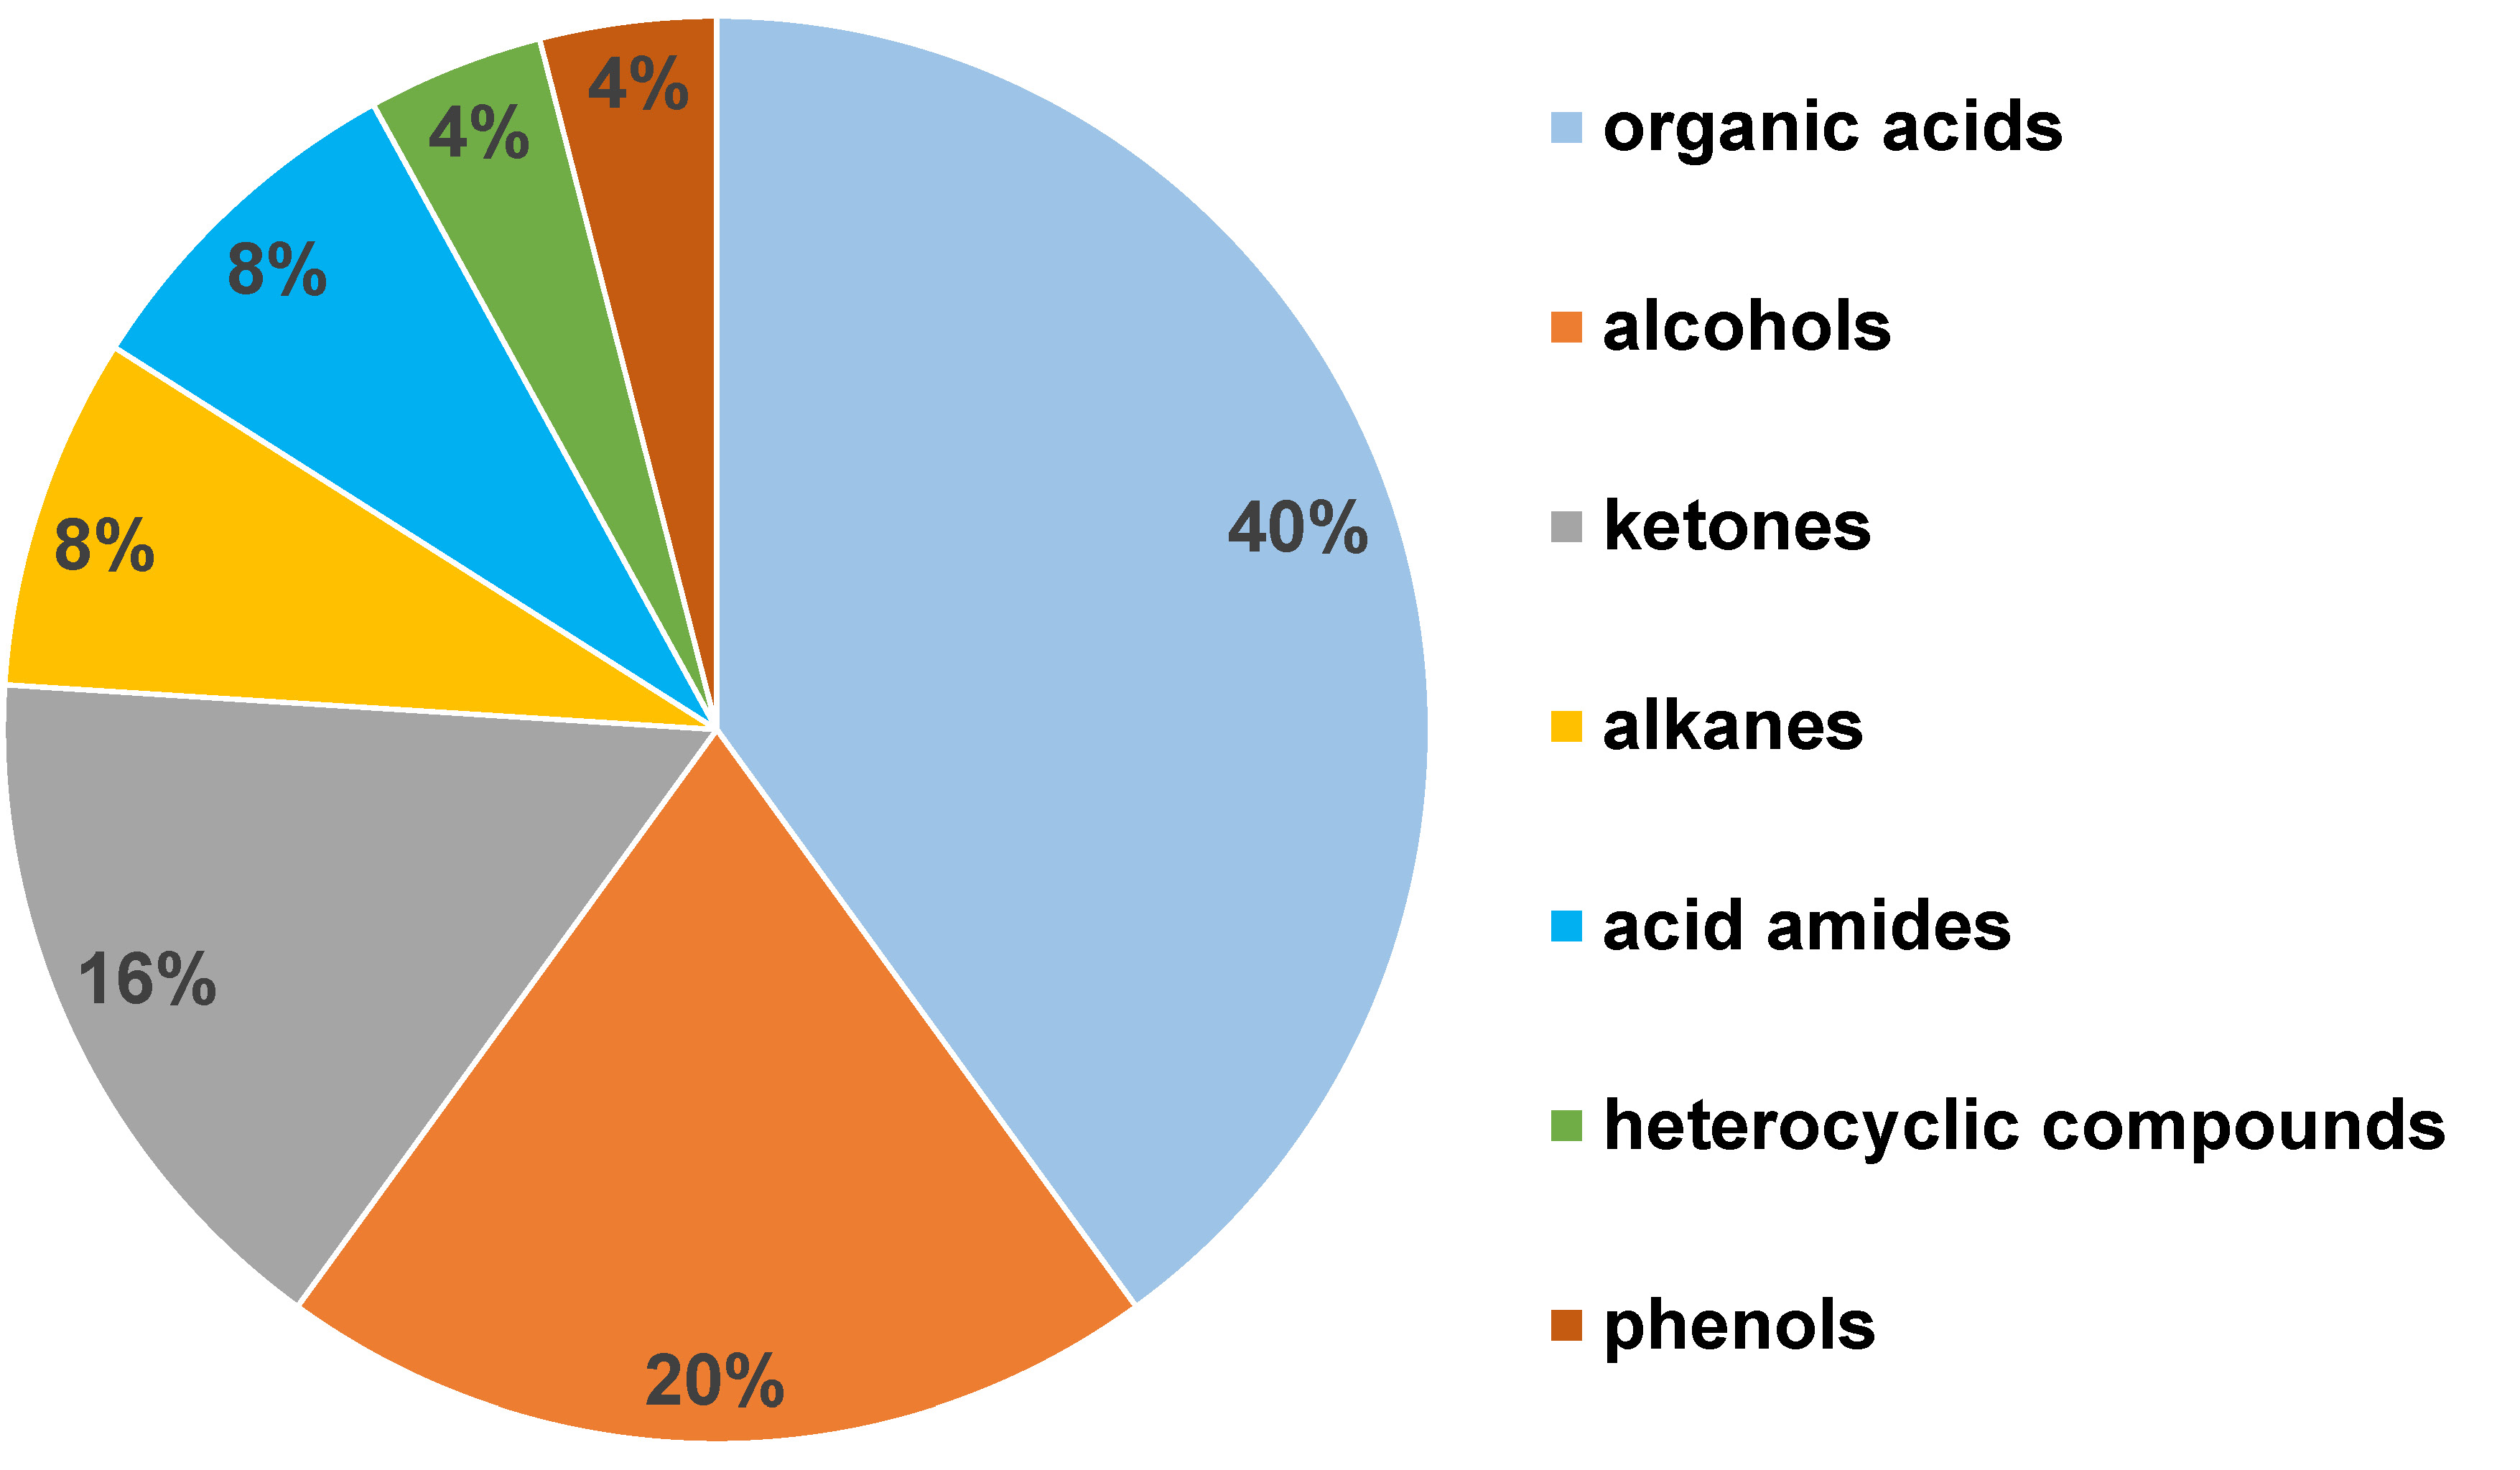
The GC–MS analysis of 110 salivary samples using the ZSM-5/PDMS hybrid film detected about 128 distinct VOCs. Amongst them, 25 VOCs were determined to be statistically significant in differentiating between the 3 groups. The major chemical classes of VOCs identified were organic acids (40%), alcohols (20%), ketones (16%), alkanes (8%), acid amides (8%), heterocyclic compounds (4%), and phenols (4%) (Figure 4). The salivary VOC metabolomic profiles were further evaluated based on gender, age, the type of tobacco used, the pathological tumor (T), node (N) and metastasis (M) (pTNM) classification, and histopathological staging.
Statistical analysis
VOC profiles based on gender
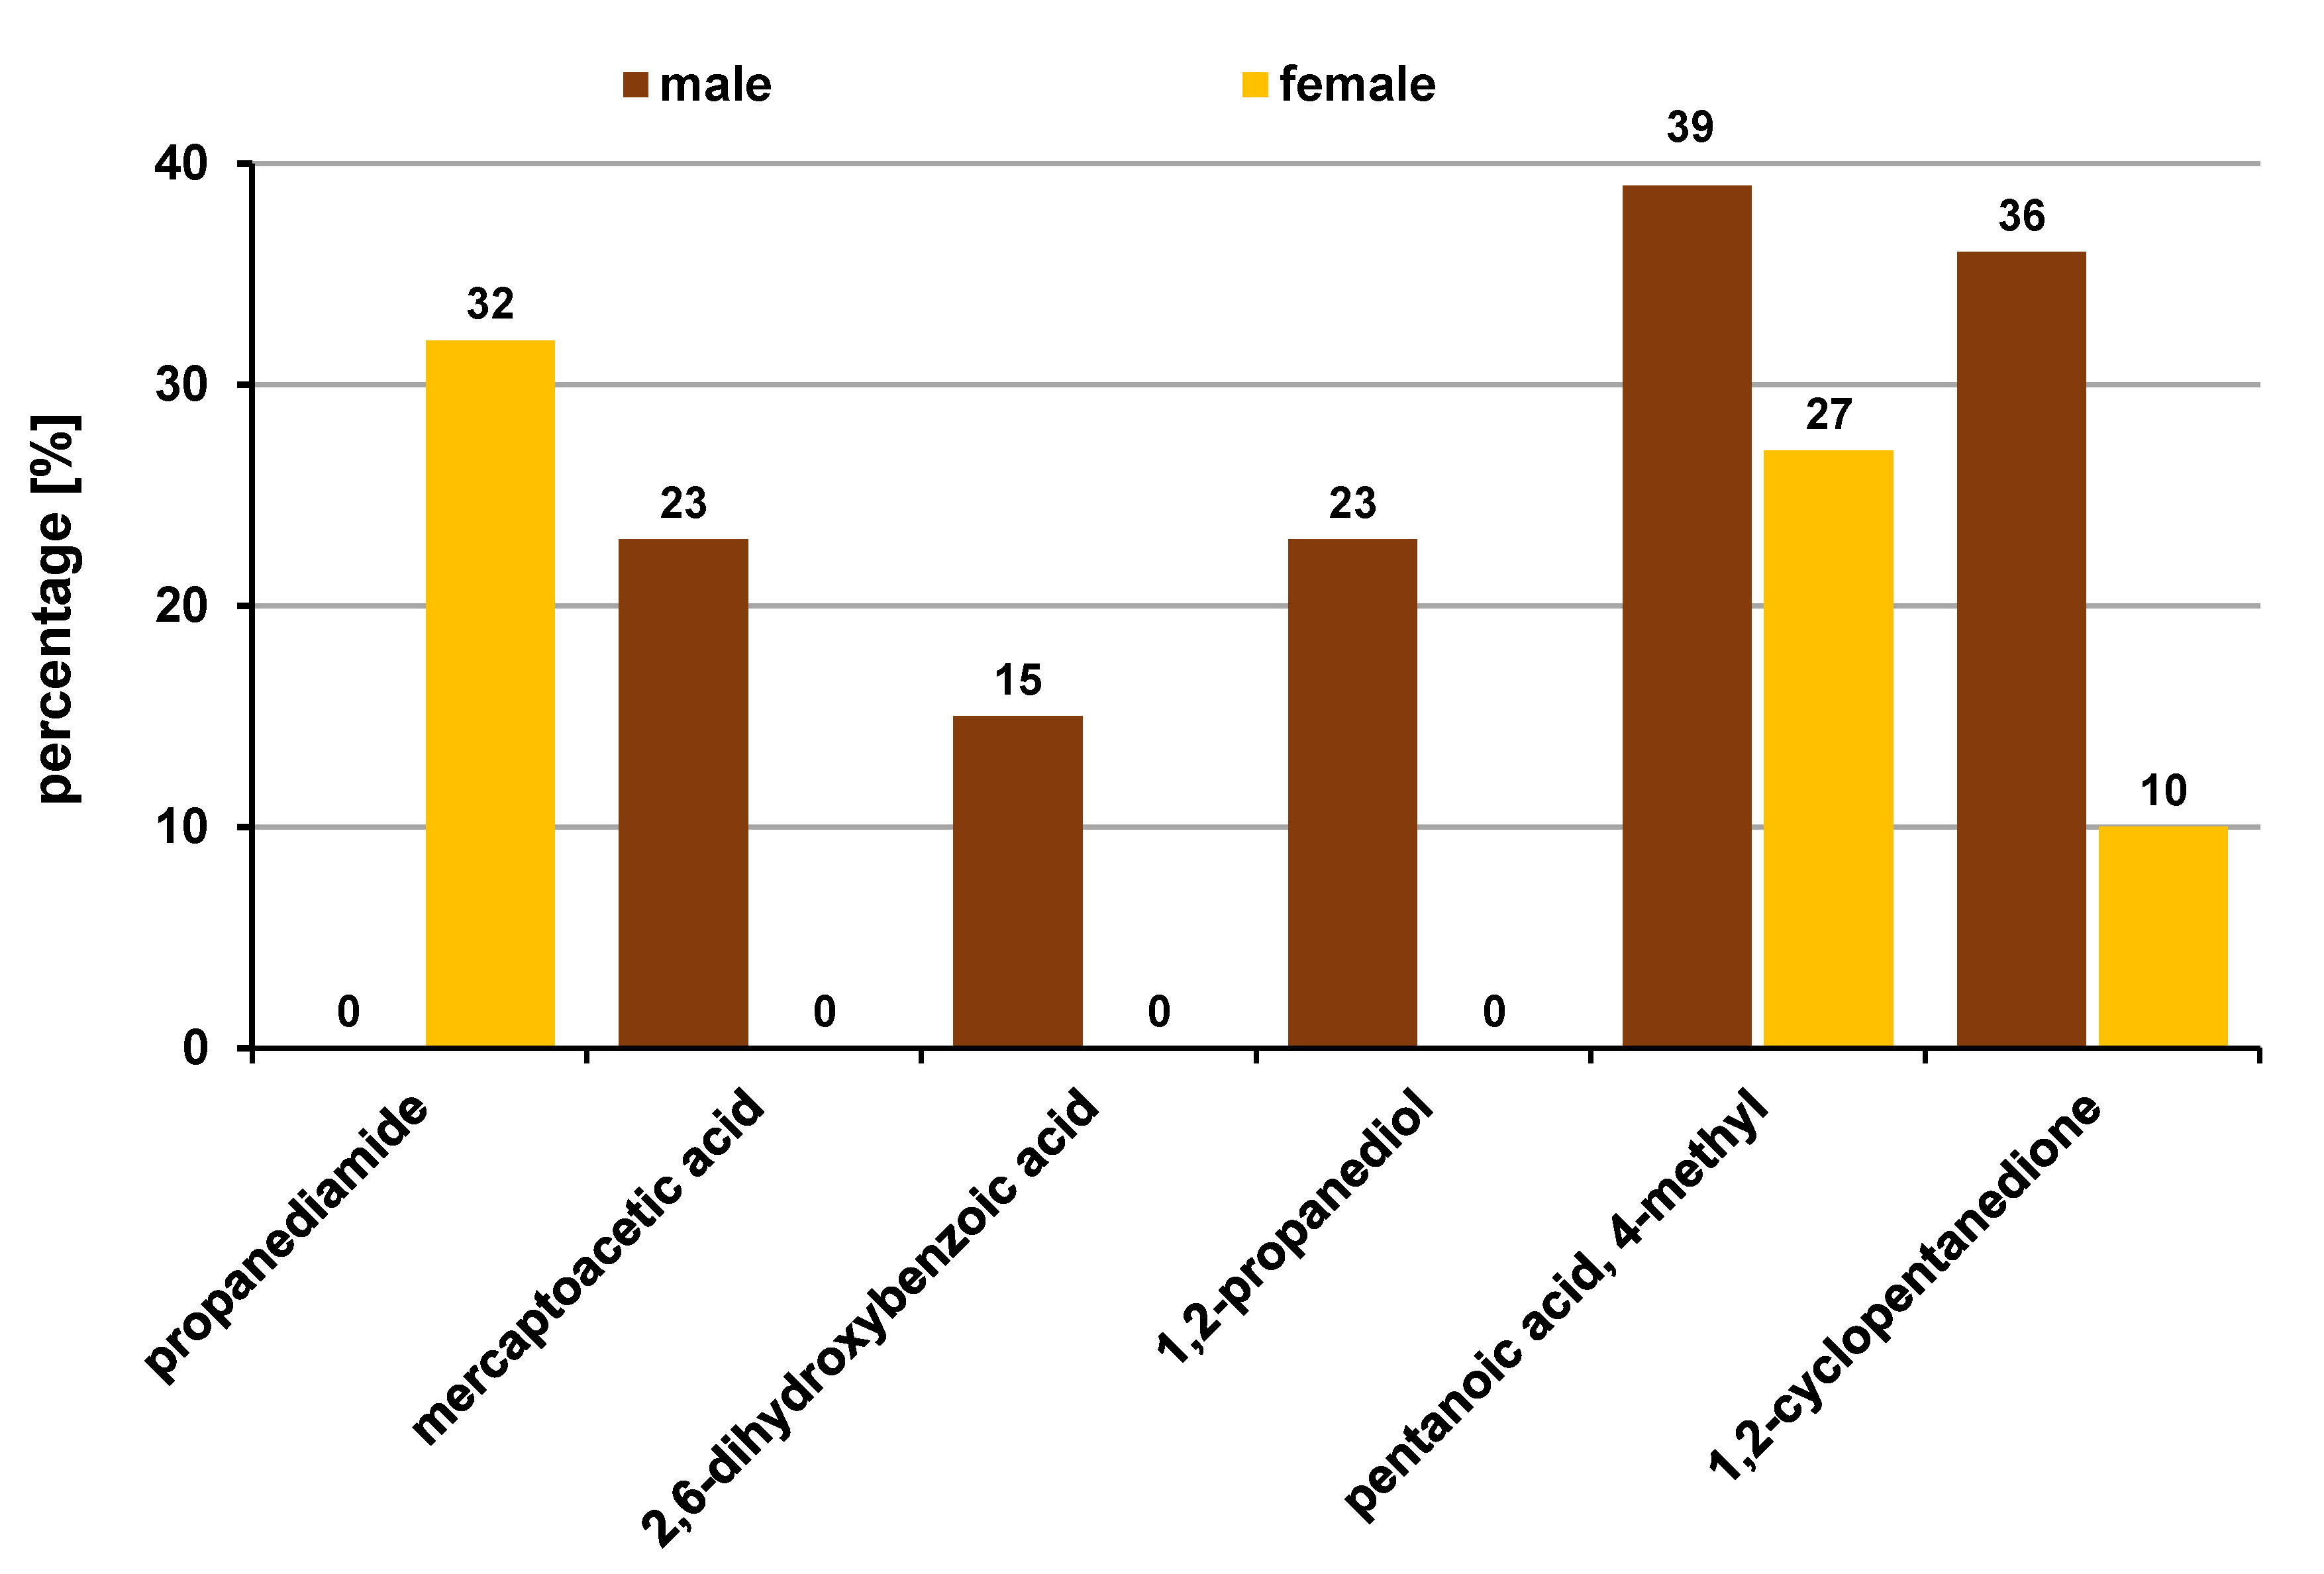
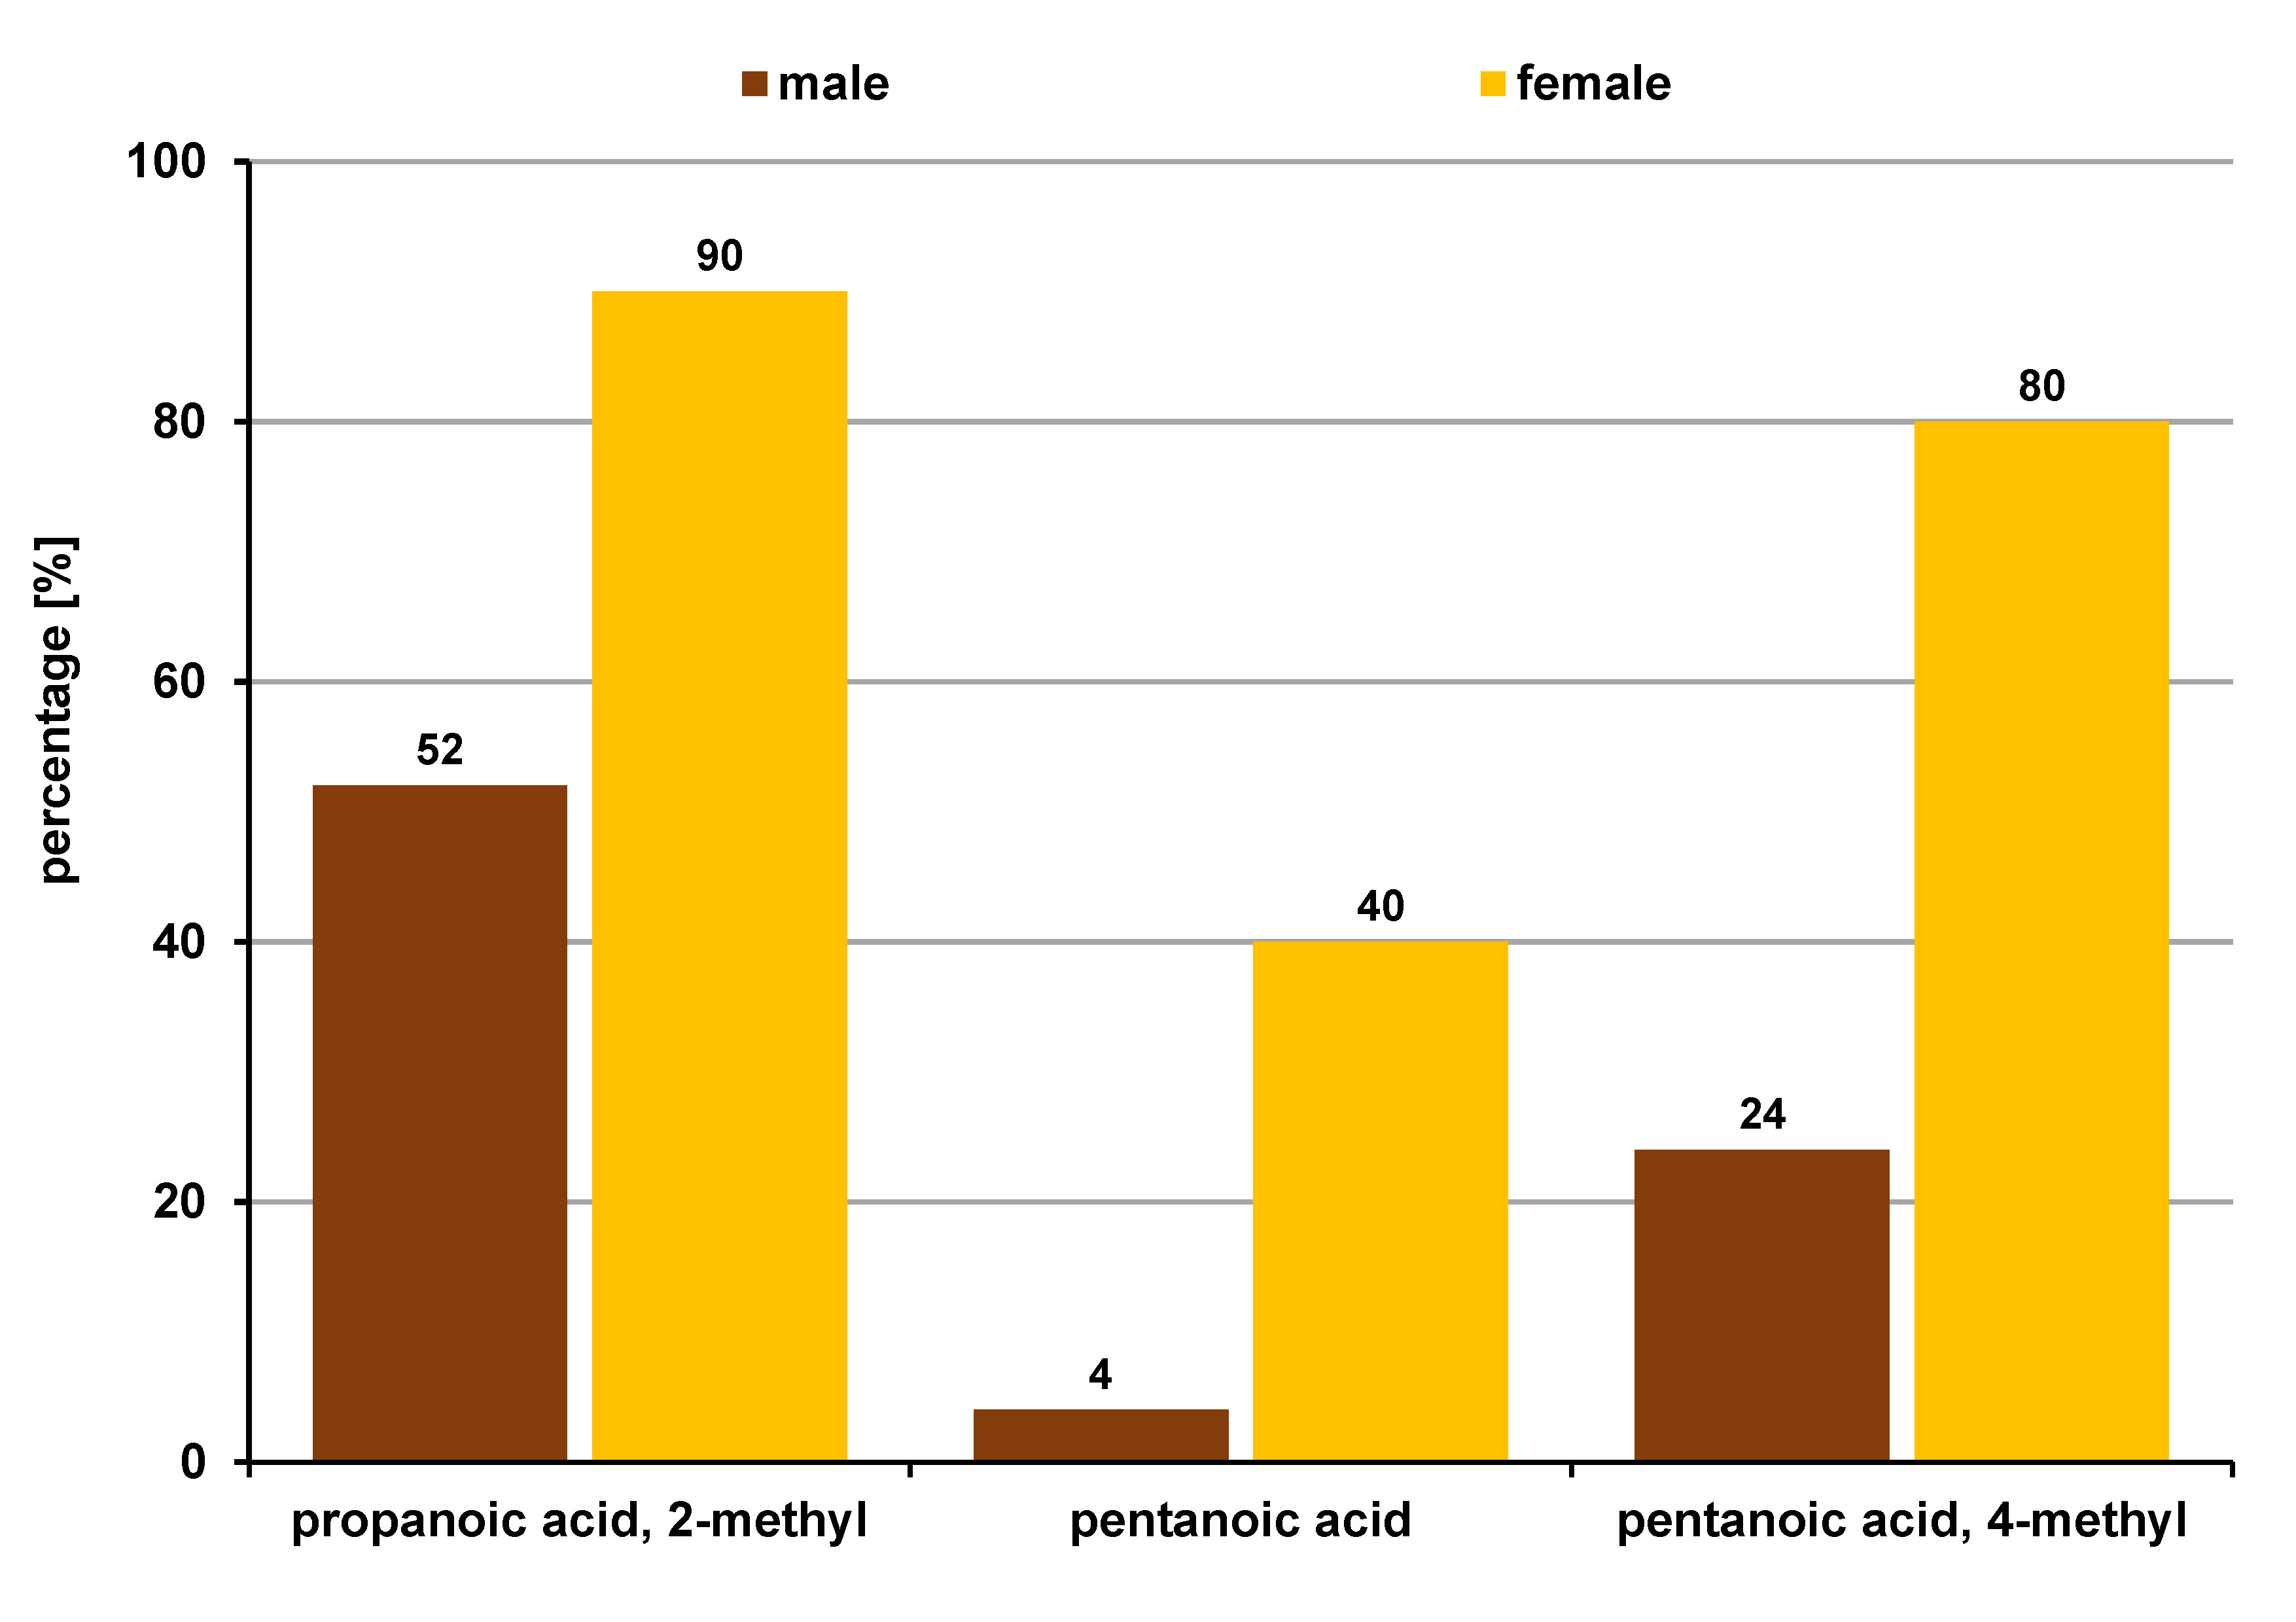
In groups 1, 2 and 3, the VOC profiles were compared according to gender. Six metabolites were statistically significant (p ≤ 0.05) in group 1, with 5 being more common in males than females. Organic acids (50.0%), alcohols (16.6%), ketones (16.6%), and acid amides (16.6%) were the chemical classes of VOCs identified in the OSCC subjects (Figure 5). Group 2 showed 3 VOCs that were statistically significantly more common in females as compared to males. Organic acids (100.0%) were the only VOCs found in group 2 (Figure 6). There were no significant differences in VOCs between genders in group 3.
VOC profiles based on age
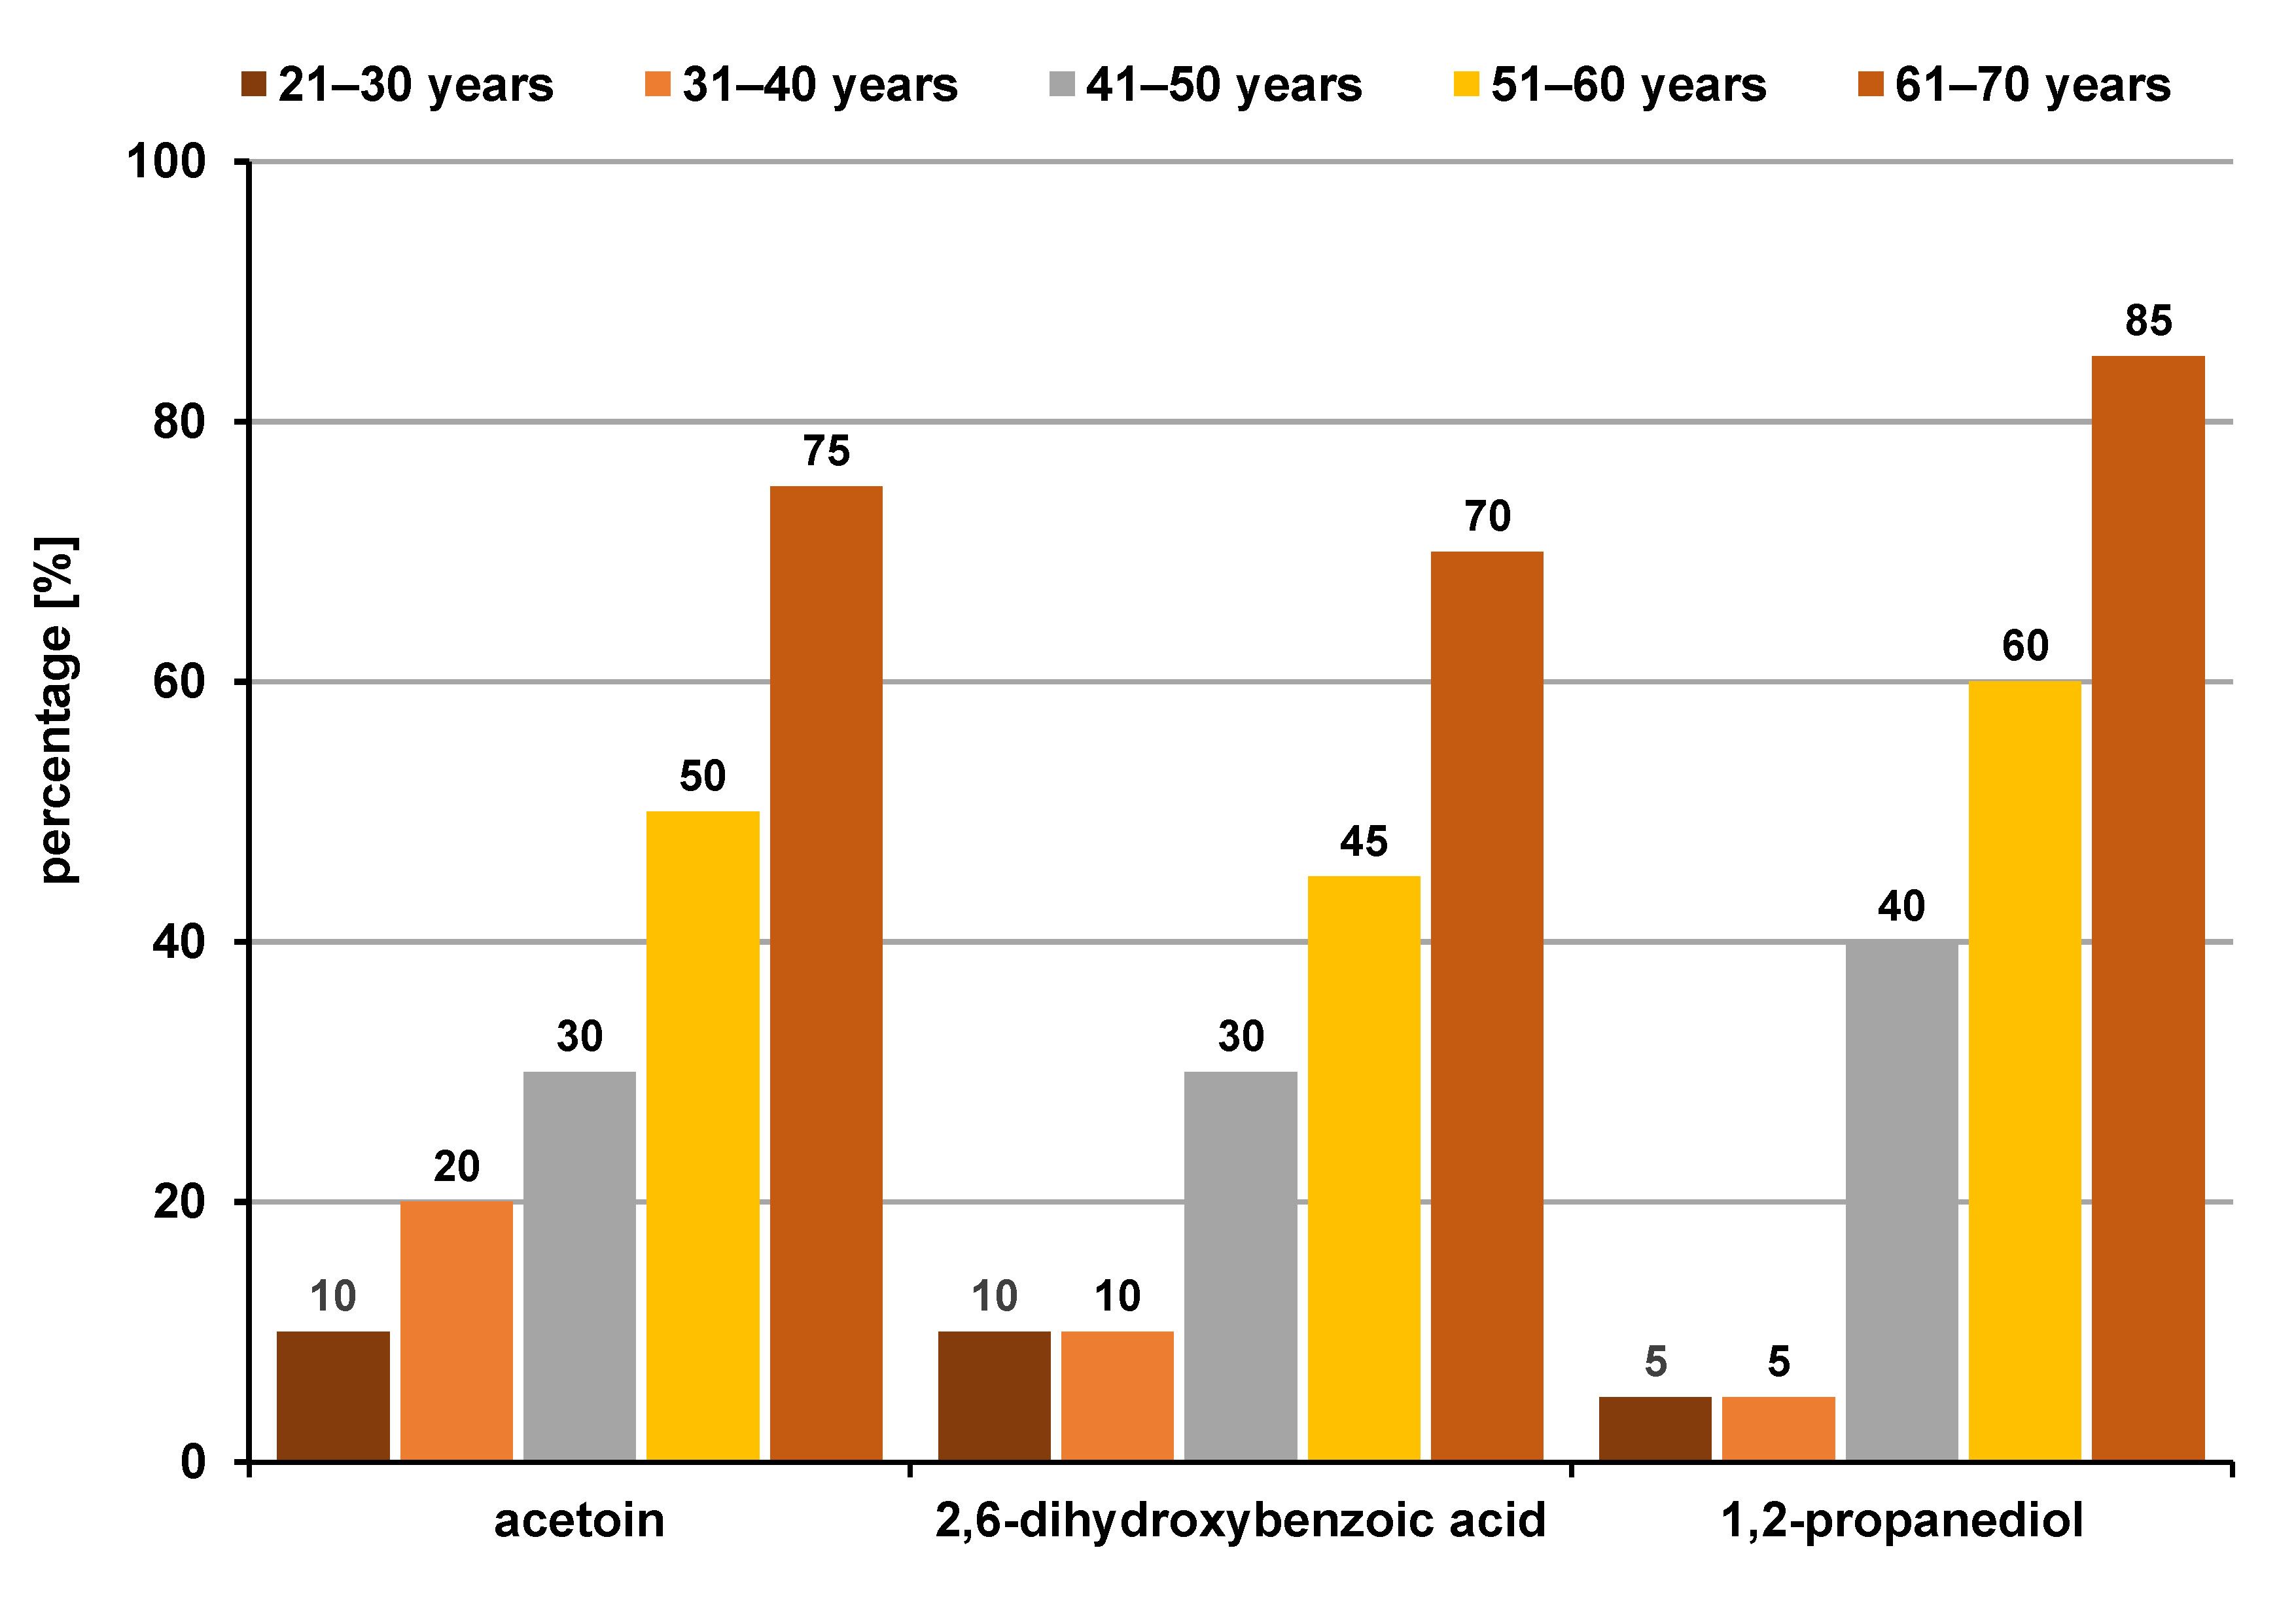
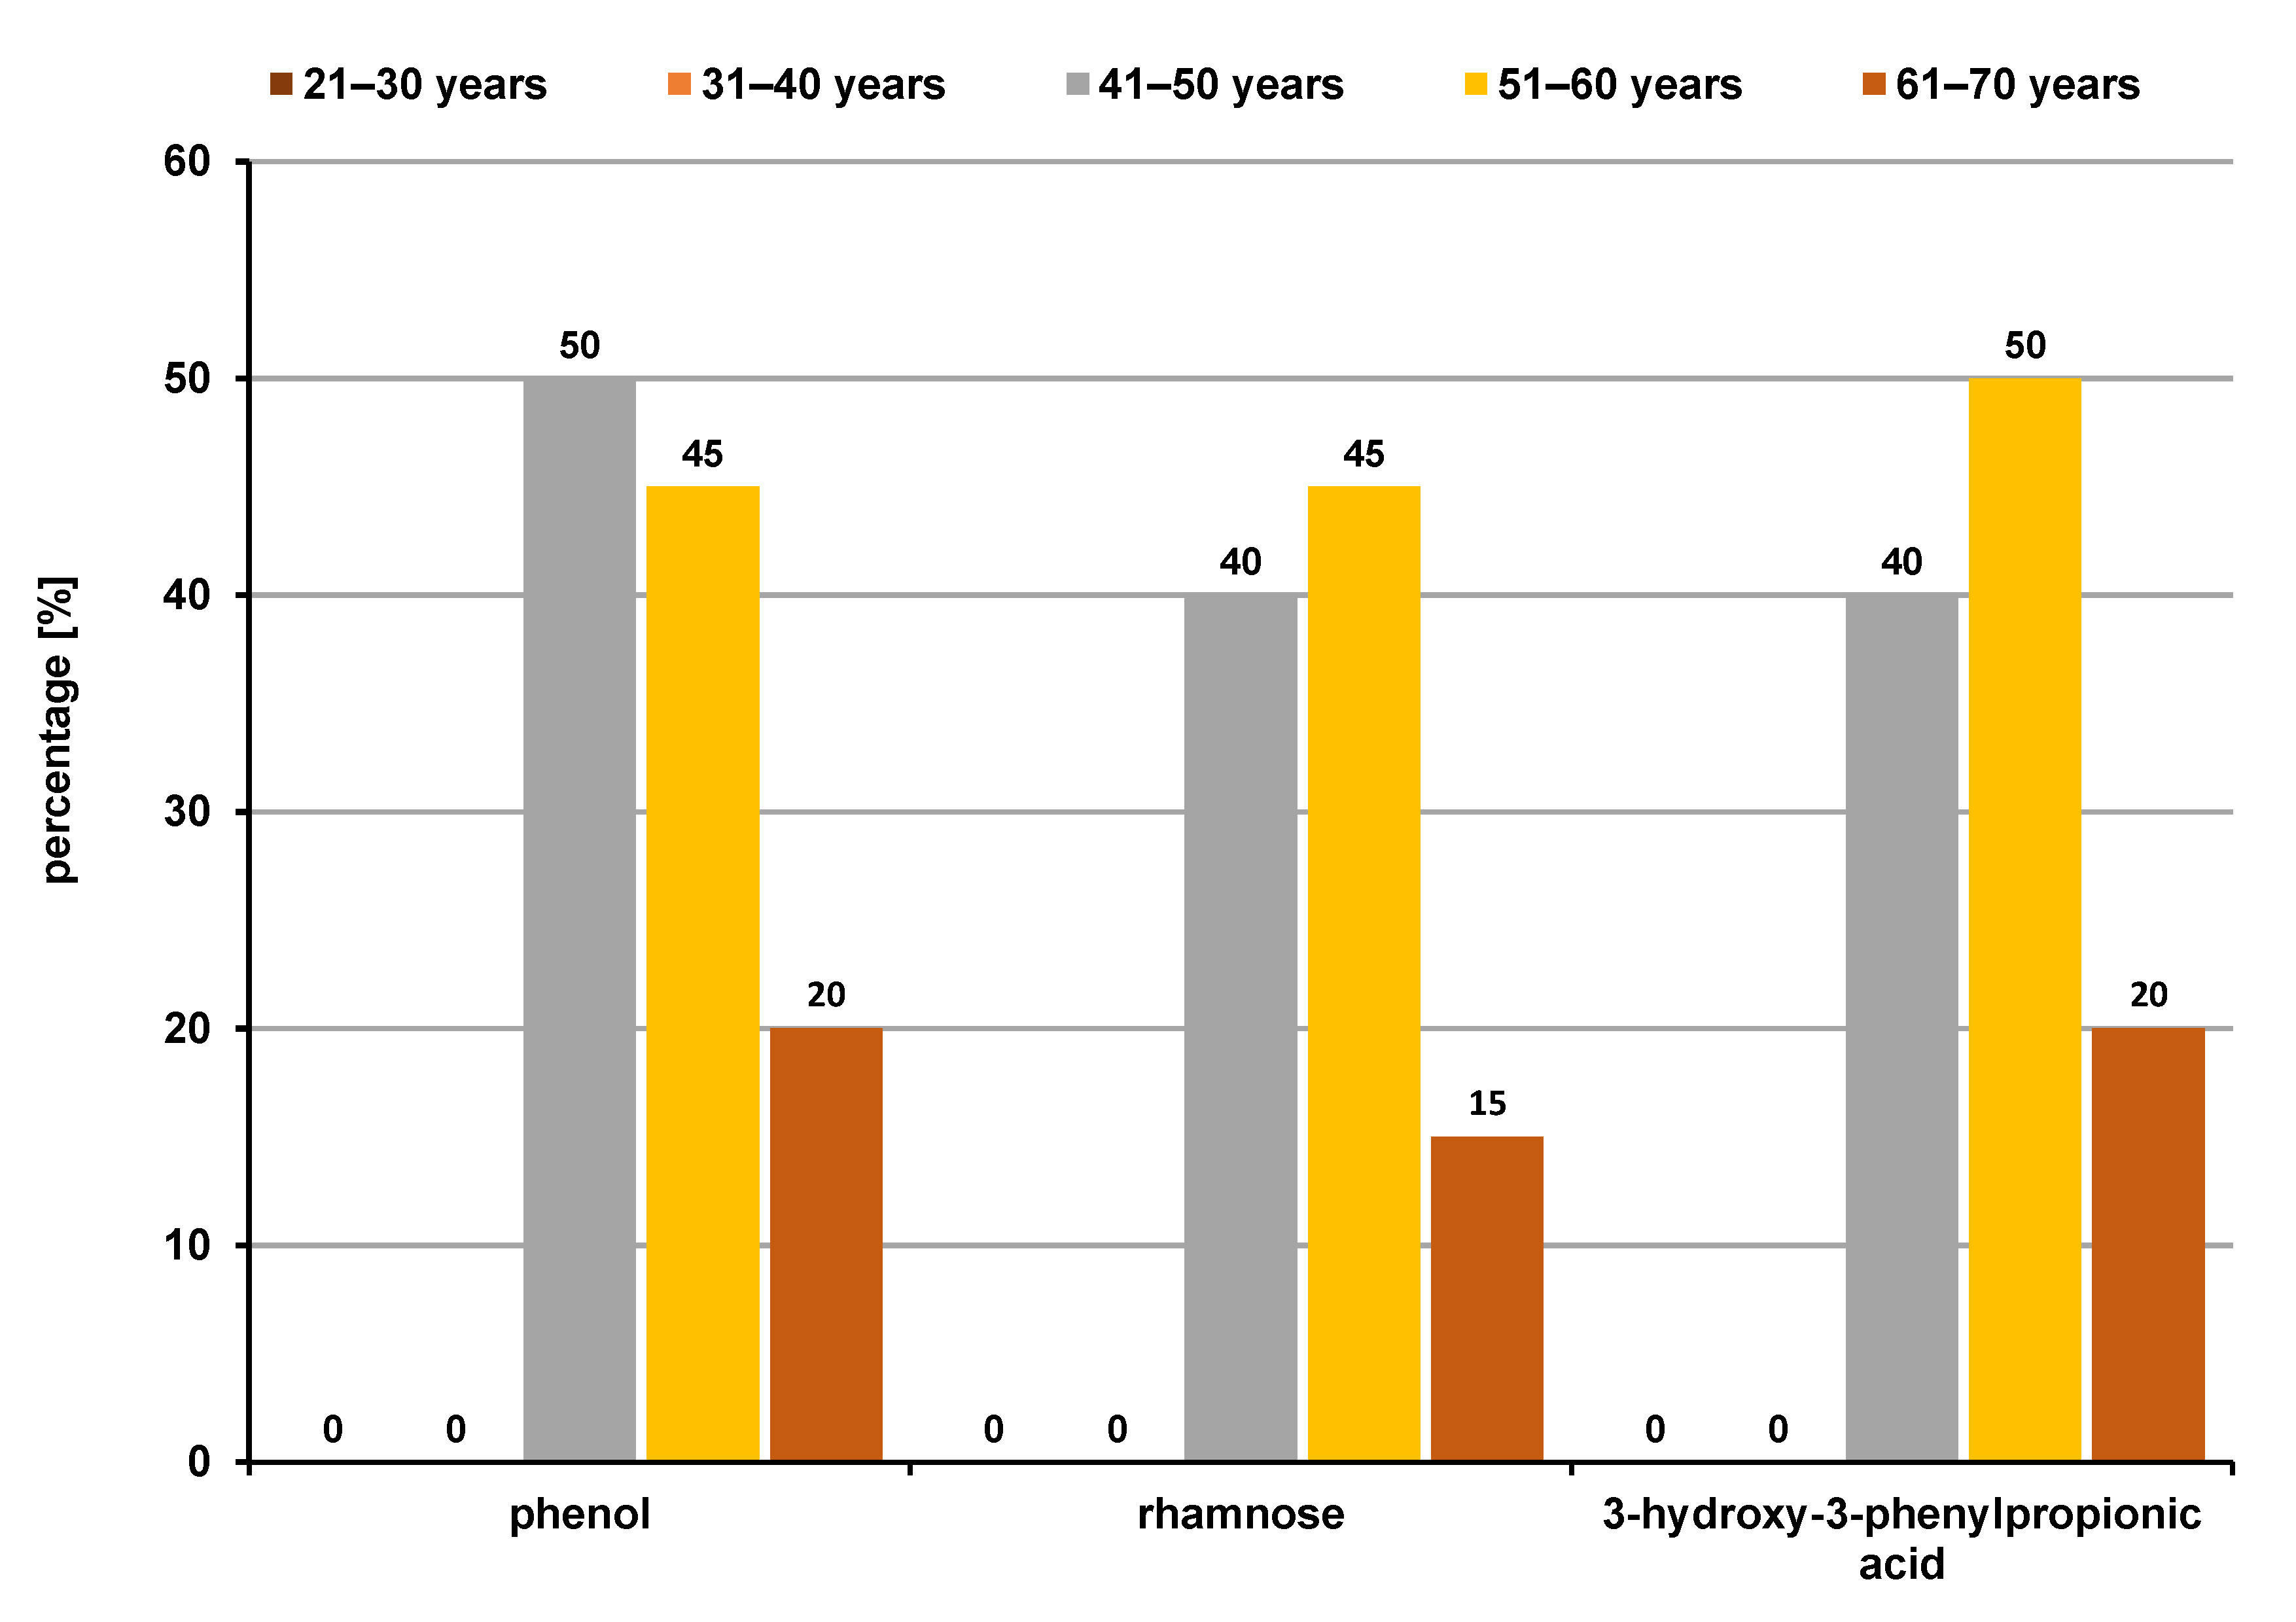
Upon comparing the VOC profiles between different age groups, group 1 revealed 3 statistically significant classes of compounds, i.e., organic acids (33.3%), alcohols (33.3%) and ketones (33.3%), which were all more common in the 61–70 age group (Figure 7), whereas group 2 also revealed 3 significant compounds, i.e., organic acids (33.3%), phenols (33.3%) and monosaccharides (33.3%), which were higher in the 41–50-year and 51–60-year age groups (Figure 8). However, in group 3, no significant differences in VOCs were found between the age groups.
VOC profiles based on the type of tobacco used
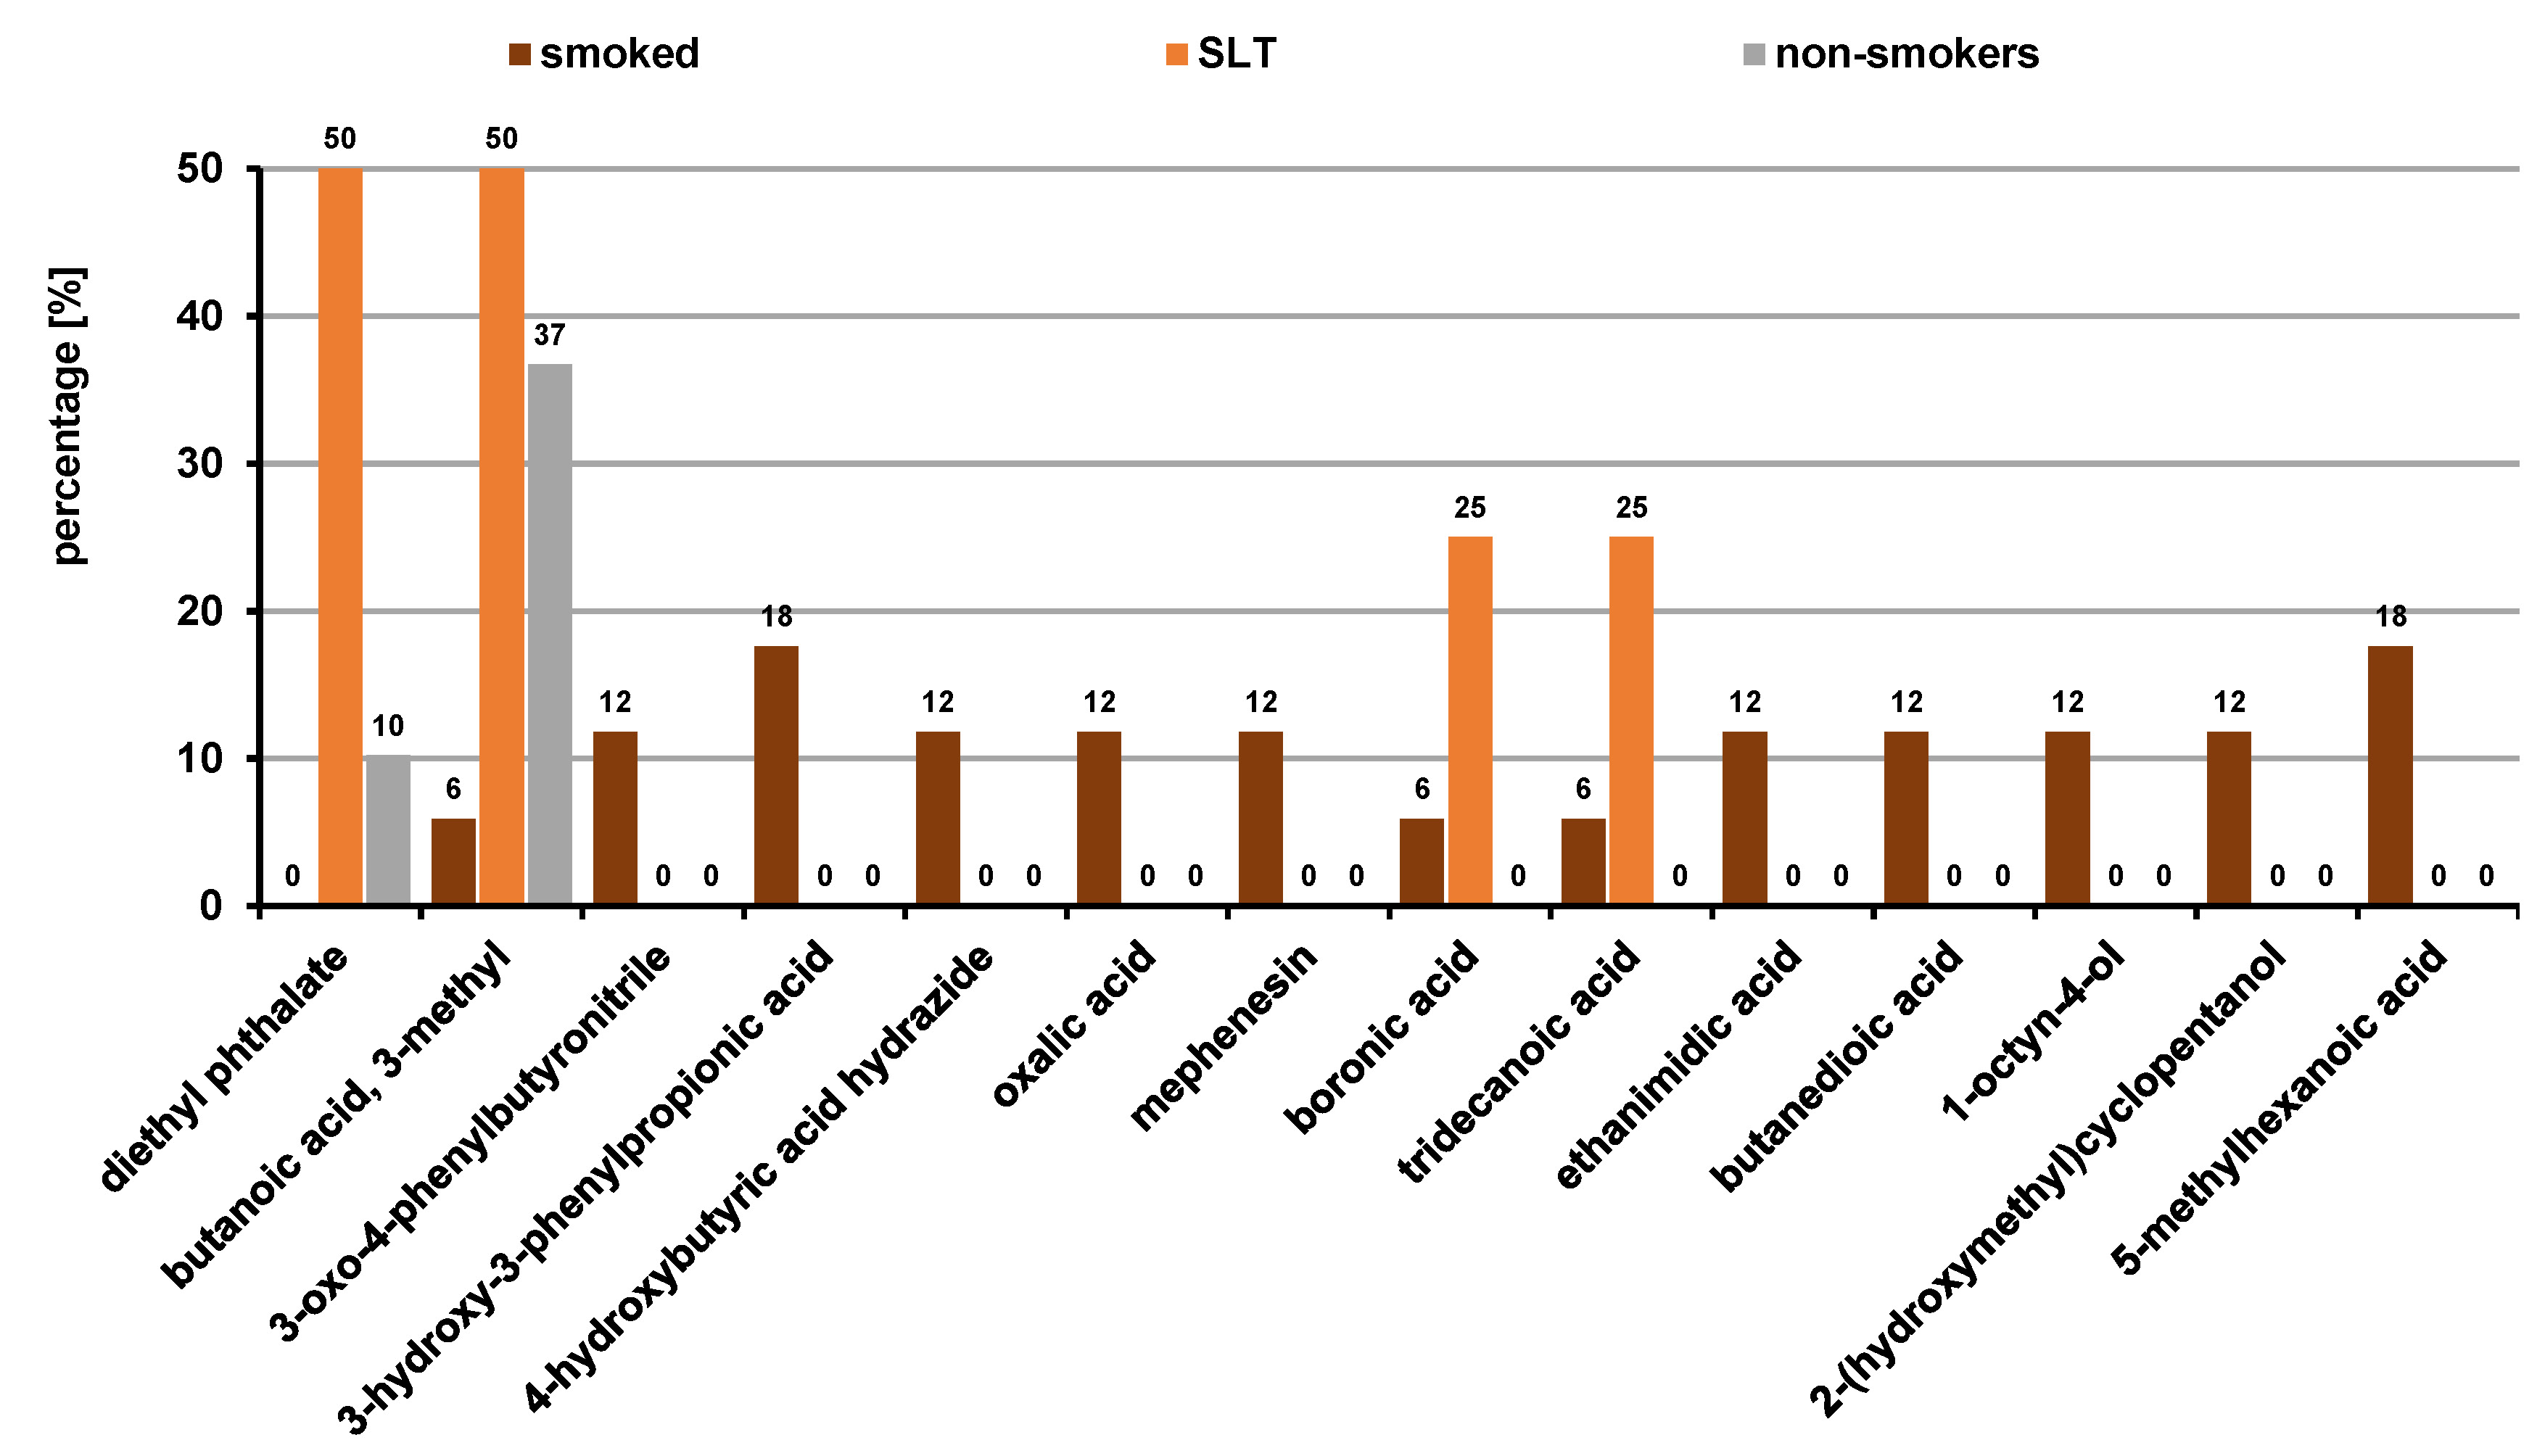
The VOC profiles of the users of smoked and SLT products were compared, and 15 compounds were found to be statistically significant (p ≤ 0.05), with organic acids (75.0%) and esters (25.0%) being most prevalent in SLT users. Smokers had a mixture of organic acids (54.5%), alcohols (18.1%), amines (9.0%), ethers (9.0%), and nitriles (9.0%) (Figure 9).
Comparison of VOCs based on pTNM staging in group 1 (OSCC)
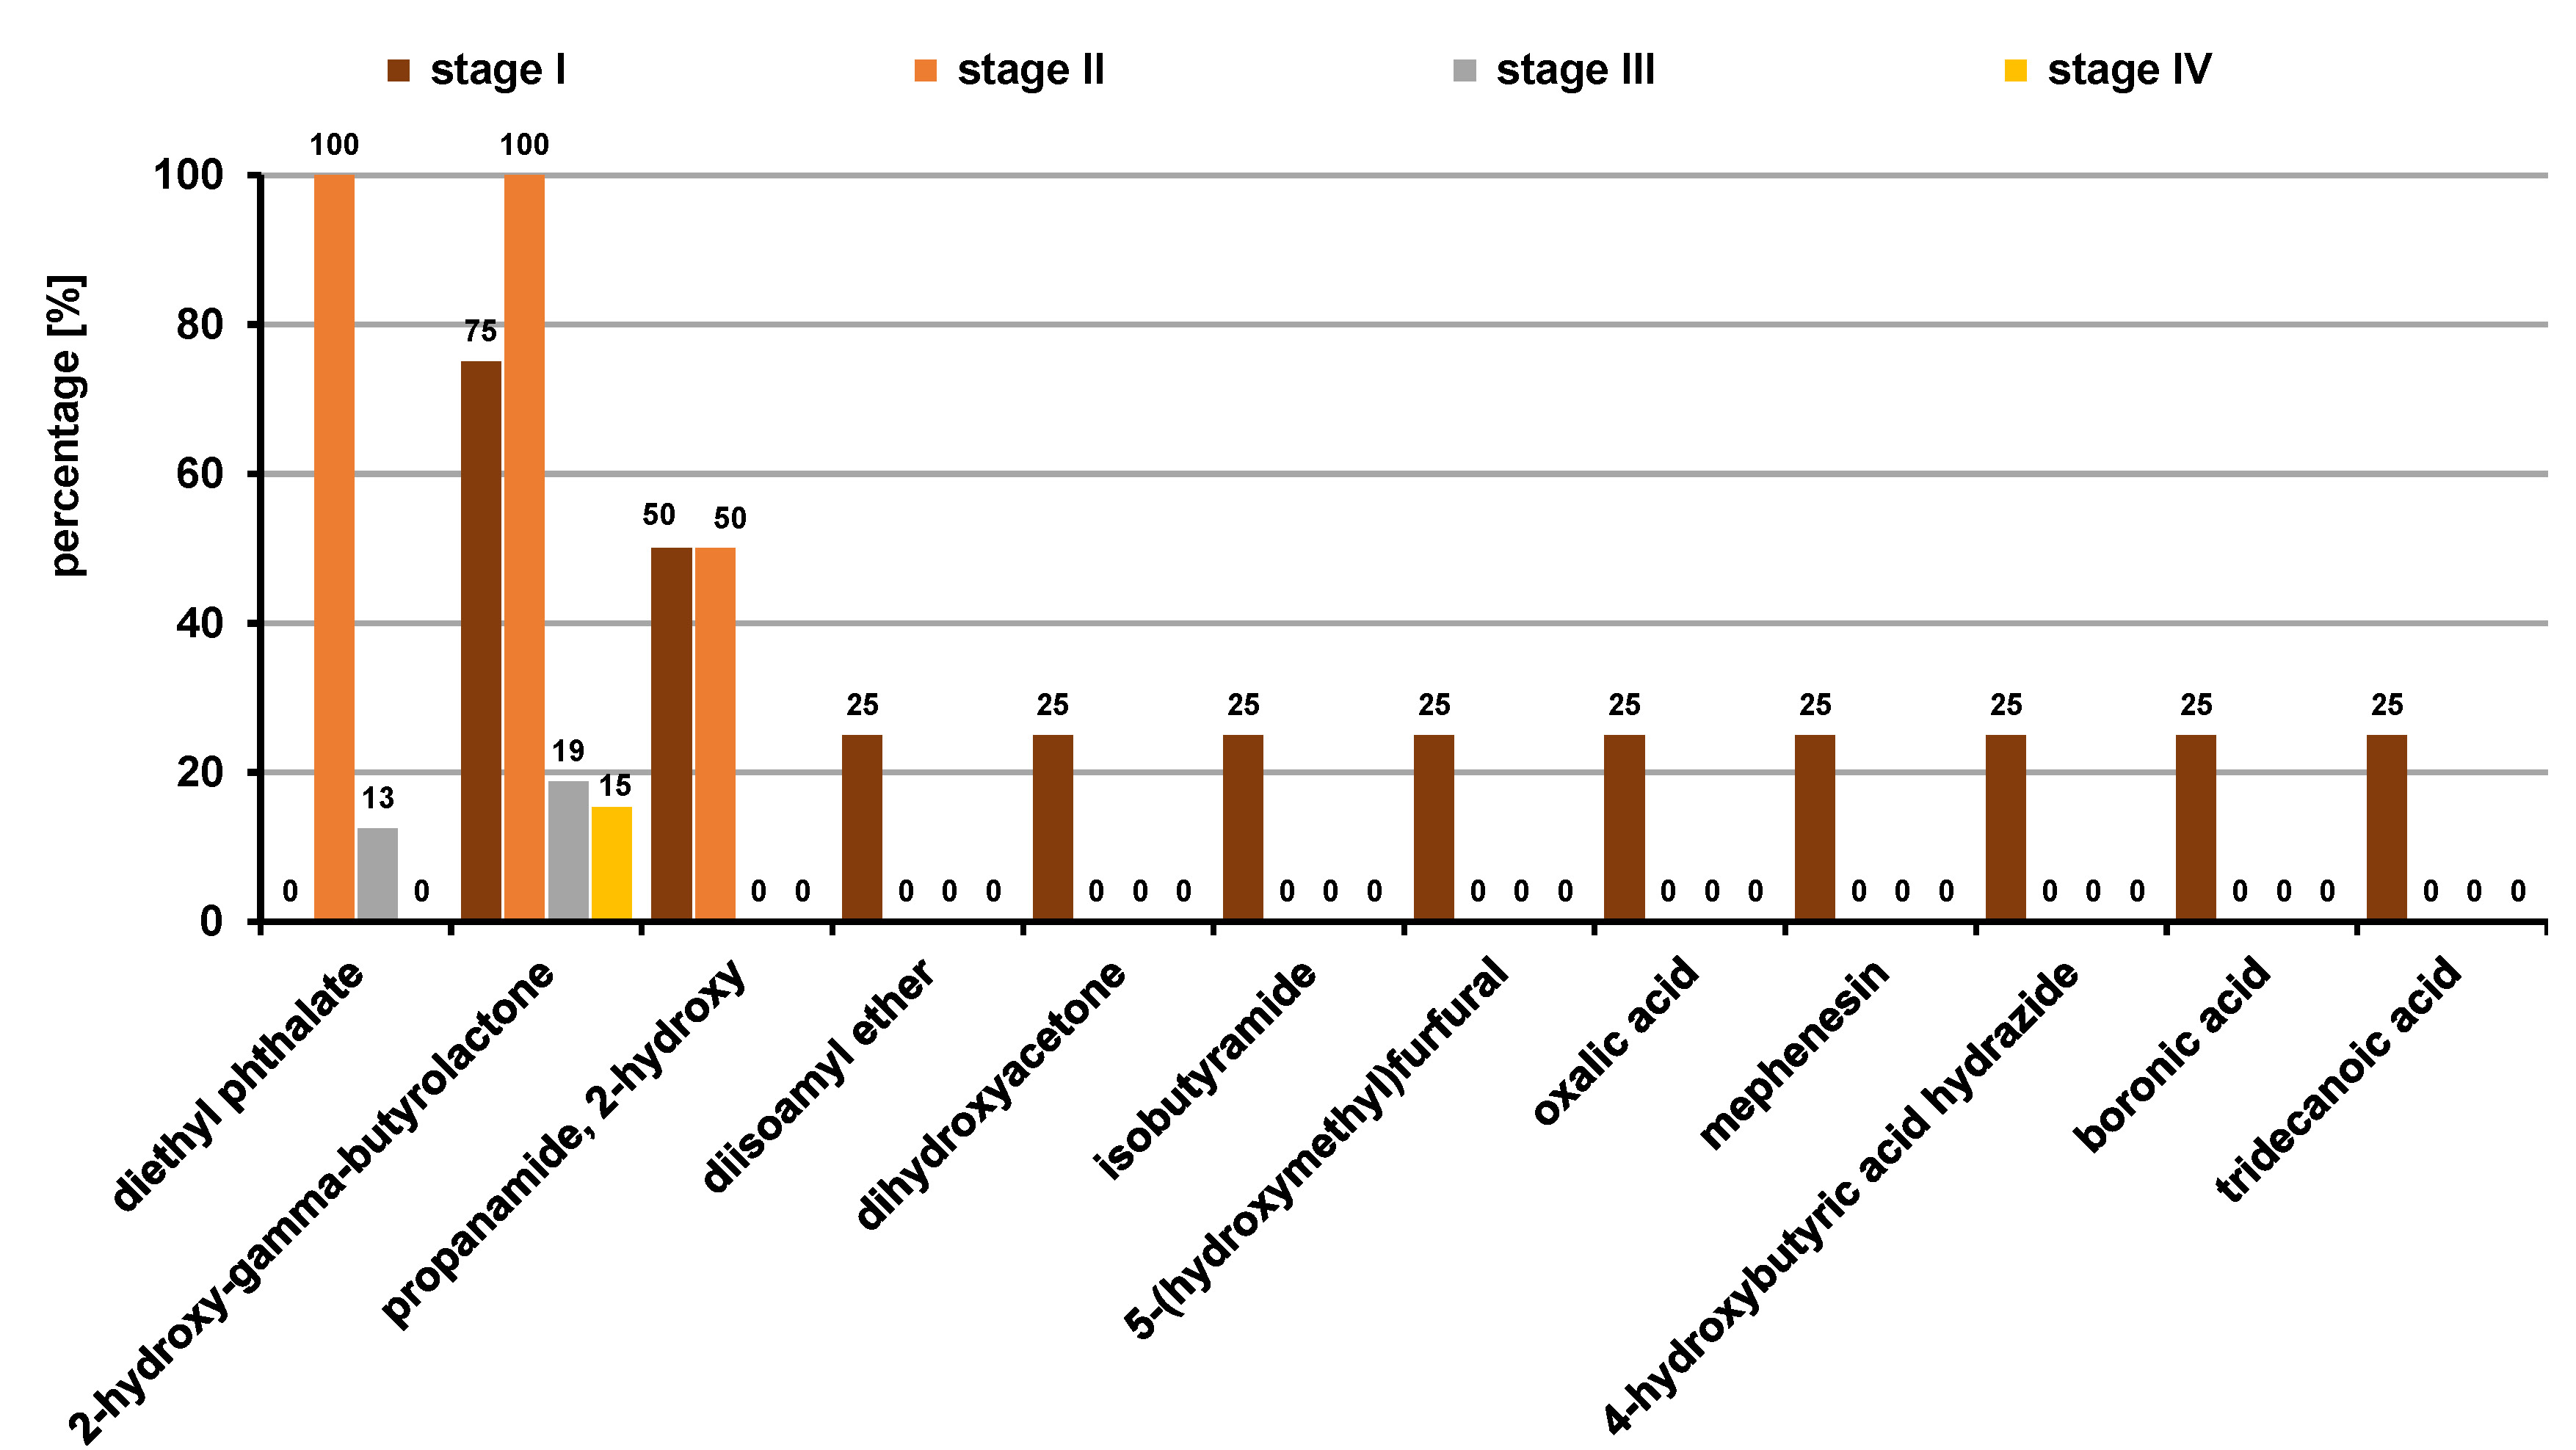
When comparing the VOC profiles based on the pTNM staging, 12 VOCs were determined as statistically significant (p ≤ 0.05). Organic acids, ketones, acid amides, ethers, and aldehydes were the predominant classes of the VOCs identified (Figure 10).
Comparison of VOCs based on histopathological staging in group 1 (OSCC)
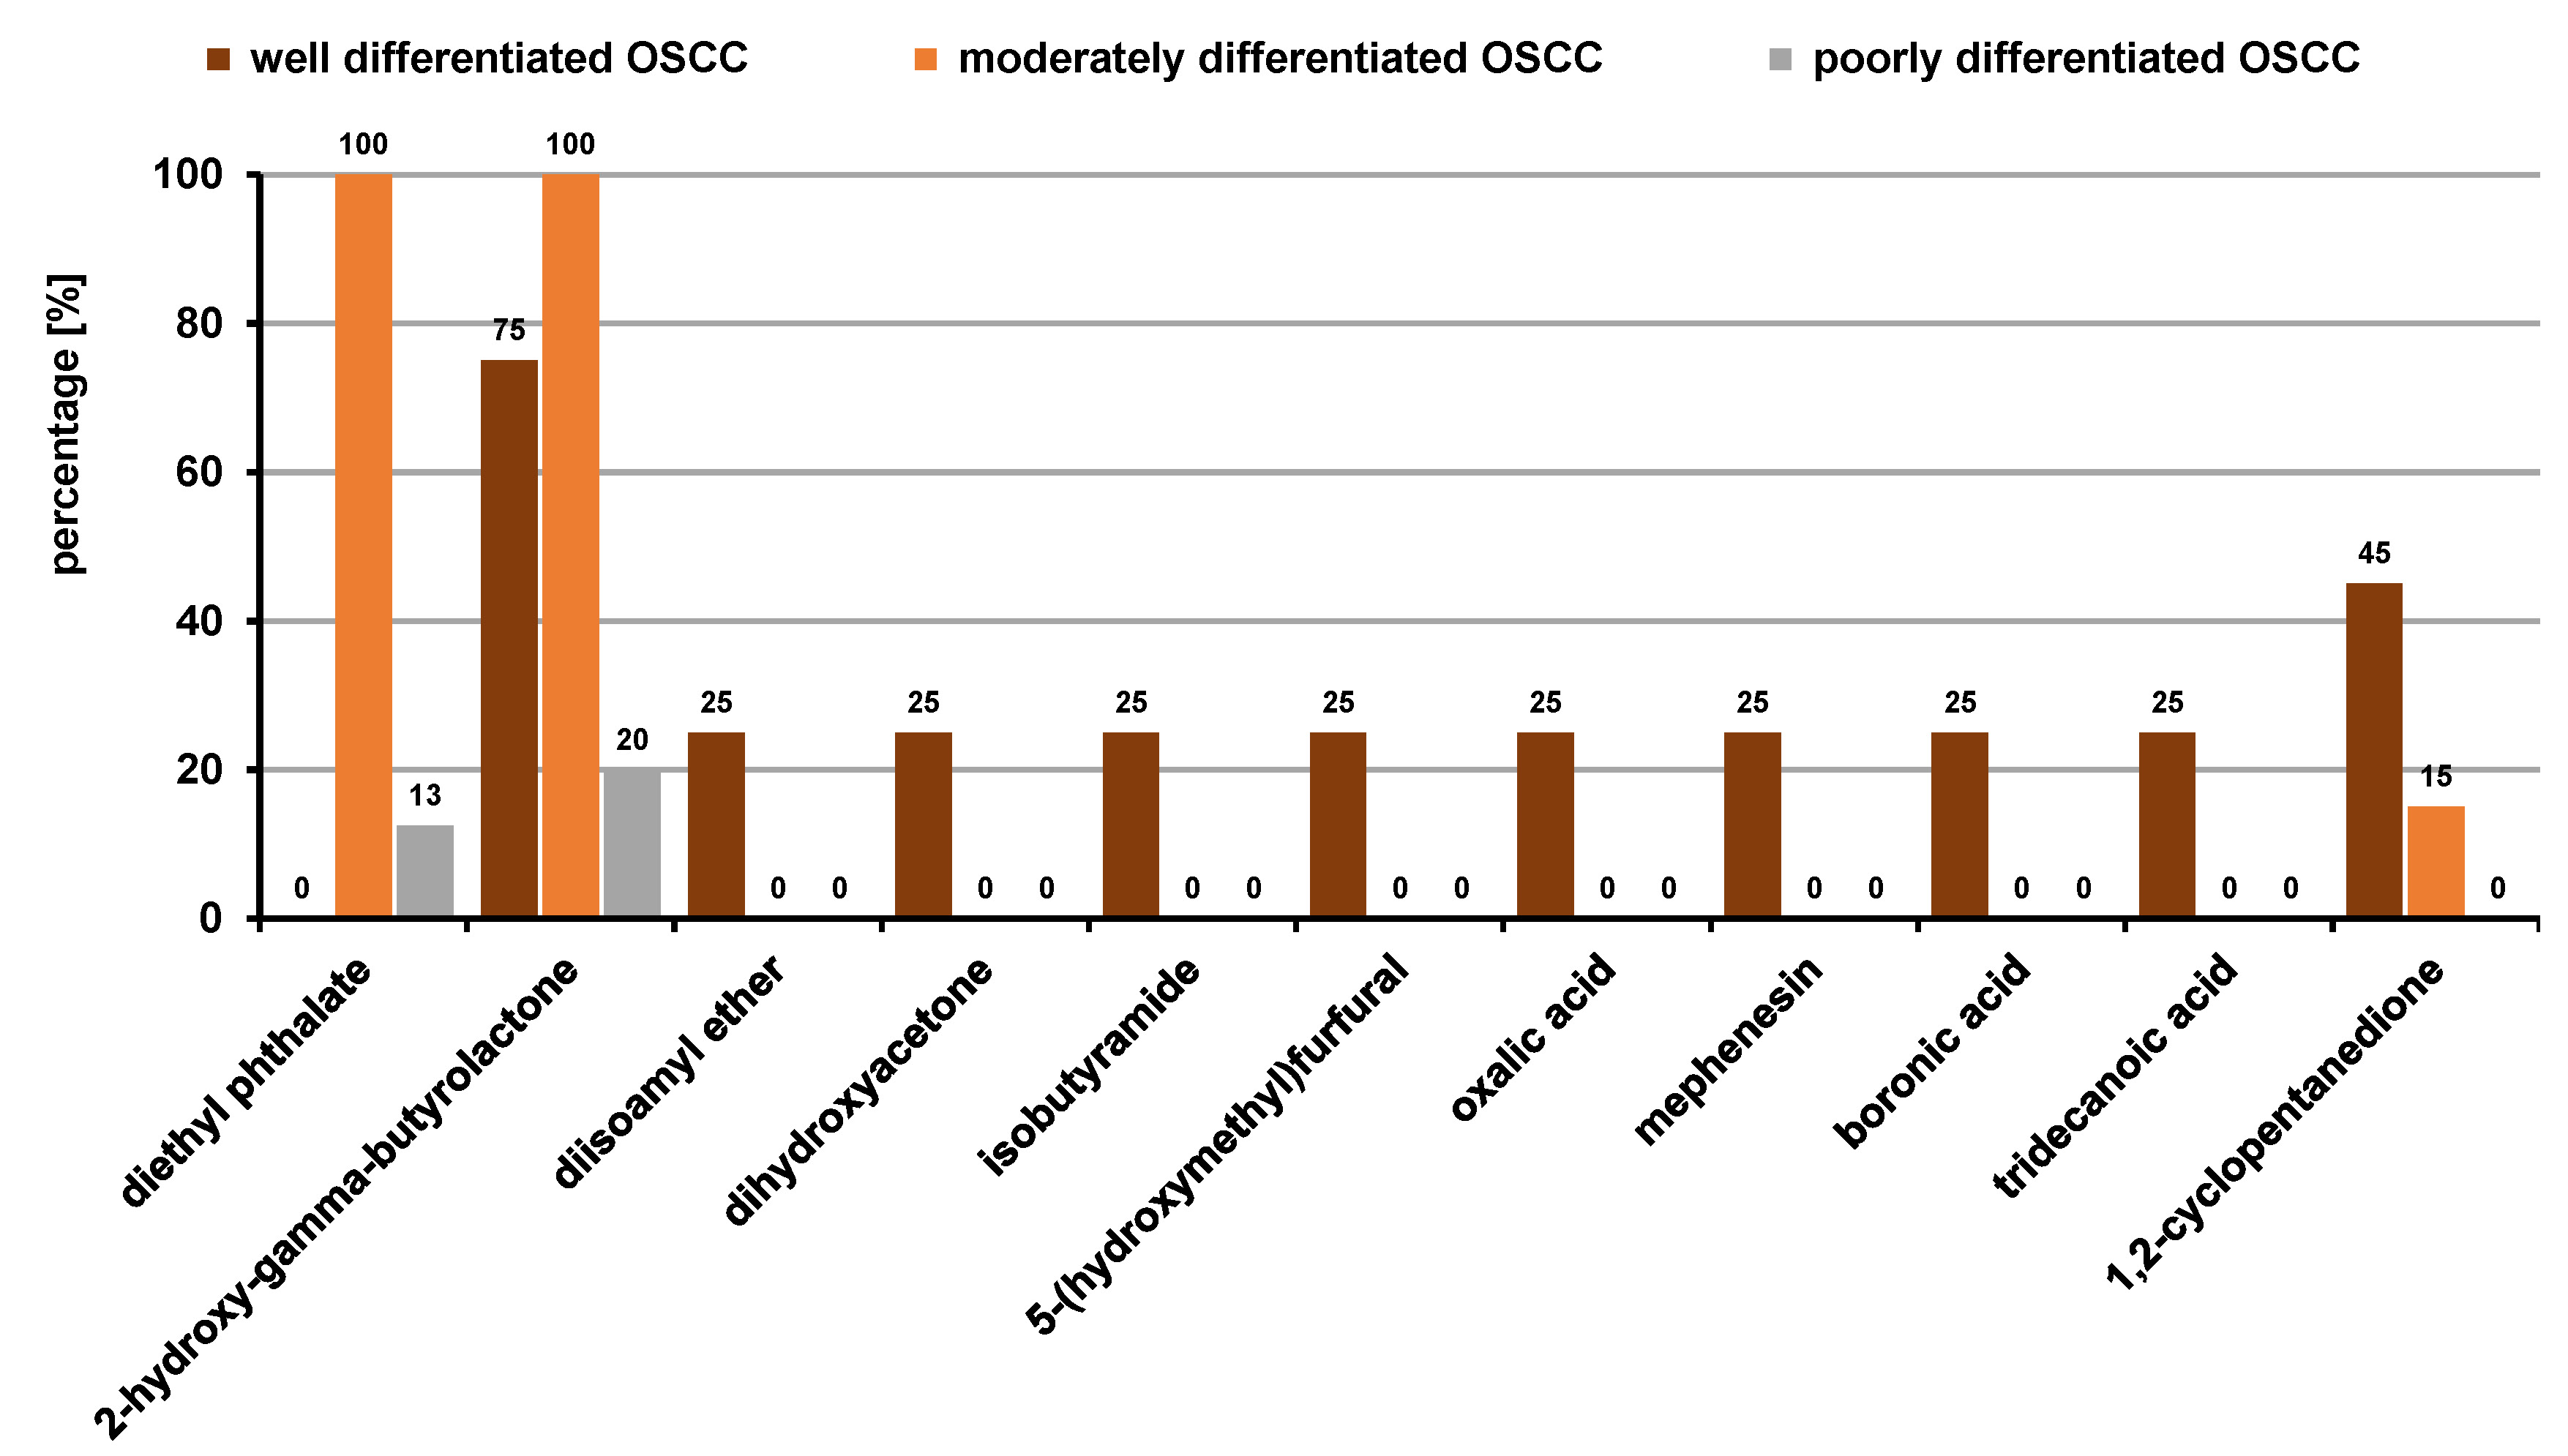
Examining the VOC profiles with regard to the 3 histological types of OSCC, 11 VOCs were found to be statistically significant (p ≤ 0.05; odds ratio (OR) ≥1). Organic acids, ketones, acid amides, ethers, and aldehydes were identified as the predominant classes of VOCs (Figure 11).
Discussion
The present study investigated the human salivary volatile metabolome, which might prove to be an accurate and non-invasive tool for distinguishing between OSCC and OPMD subjects, and healthy controls. The GC–MS analysis revealed 128 different VOCs. Amongst the 25 significant VOCs identified, the predominant chemical classes were organic acids (40%), alcohols (20%), ketones (16%), alkanes (8%), acid amides (8%), heterocyclic compounds (4%), and phenols (4%) (Figure 4). These analytes are clearly products of metabolic processes, i.e., they are endogenous metabolites that remain unaffected by daily activities or environmental conditions.
Although many volatile compounds might be easily detected in salivary samples, they are still influenced by various confounding factors, such as gender, age, diet, smoking, and certain medications. Also, a large number of VOCs in healthy subjects originate from the breakdown of food by normal intestinal flora and they are not indicative of any disease. The VOC profile may vary depending on gender, age, diet, physiological and nutritional status, and habits (alcohol consumption or smoking); therefore, VOCs could be considered as the “odor fingerprint” of individuals.12 In the present study, the OSCC group revealed more males with statistically significant levels of organic acids, alcohols and ketones associated with oxidative stress (Figure 5). The fact that OSCC is more frequent in men than women, largely owing to their higher intake of alcohol and tobacco use, justified the higher level of these metabolites in males. In contrast to the VOC profile in the OSCC group, the OPMD subjects showed 3 significant organic acids with statistically significantly higher levels in females than males (Figure 6). This finding is in accordance with a systematic review by Jia et al., which suggested that gender also influenced the breath VOC profile, with alkenes like isoprene and several other VOCs found to be gender-specific.12 However, another study by Dragonieri et al. concluded that gender and age did not seem to affect the overall profile of the exhaled VOCs measured by an e-nose device.13
Metabolic reprogramming in OC is not yet fully elucidated, and therefore, the investigation of metabolic alterations is crucial for detecting novel diagnostic biomarkers and understanding the disease progression. In a couple of studies, saliva was used to unveil the metabolomic signature of OSCC. Studies have sought to identify salivary metabolite biomarkers that would discriminate OSCC subjects from healthy controls.14 In the present study, the salivary VOC profiles obtained from individuals with OSCC and OPMDs were compared with regard to each other and healthy controls. Twenty-five VOCs were found significant between the OSCC subjects, the OPMD subjects and the healthy controls (Table 3, Table 4, Table 5, Table 6).
The OPMD VOC models derived from the metabolic analysis demonstrated good separation from OSCC and healthy controls, highlighting the diagnostic potential of this non-invasive analytical approach. Eleven VOCs were found to be differentially expressed in OPMDs as compared to OSCC and controls. The categories of OPMDs among the subjects of this study included OL (both homogenous and non-homogenous), SMF and OLP. Six acids, 1 alcohol, 1 ketone, 1 acid amide, 1 heterocyclic compound, and 1 phenol were the VOCs with the levels significantly higher amongst the OPMD subjects.
Organic acids, like benzeneacetic acid, mercaptoacetic acid, 2-butenoic acid, propanoic acid, 2-methyl-, 5-methylhexanoic acid, and 3-hydroxy-3-phenyl propionic acid, were found predominantly. It is known that propionibacteria, oral commensal bacteria, convert carbohydrates to short-chain fatty acids (SCFA), especially propanoic acid, through anaerobic metabolism. Propanoic acid can also be produced during metabolism and can be generated from propionyl-CoA, an end-product in the altered metabolism of the amino acids valine, isoleucine, threonine, and methionine, as well as odd-chain fatty acid oxidation and the degradation of cholesterol.15 A similar alteration of both propionyl-CoA and amino acid metabolism is observed in OL.16 In view of the above, the level of propanoic acid, 2 methyl- was higher in the OPMD group as compared to controls in the present study. The results of this study are in agreement with those presented by Wei et al., who identified the amino acids valine and phenylalanine for distinguishing OL from OSCC.17 Mercaptoacetic acid was seen in 66.7% of OL subjects. It is among substances that cause halitosis – volatile sulfur-containing compounds, such as hydrogen sulfide, methyl mercaptan and dimethyl sulfide, which in turn are associated with periodontitis. Given that more than 75% of the OPMD subjects had a history of tobacco use, this finding is justified. On the other hand, 2-butenoic acid increases glycolysis and elevates cancer cell growth through modulating the p53-dependent pathway in response to nutrition depletion, thereby making it a potential biomarker for malignant transformation. 5-methylhexanoic acid and 5-methylsalicylic acid were found in most of the OL and OLP patients; however, there are no reports indicating their role as biomarkers in OL and OLP.
Amongst alcohols, propylene glycol was found in most of the OPMD patients (28.6%). Propylene glycol is reportedly used as a humectant in tobacco products, and the majority of patients in this group had a history of tobacco use. In the ketonic group, acetoin was significantly present among OL patients. However, there is a lack of literature about these VOCs in OPMDs; the elevation of these compounds can be attributed to the tobacco use status of the patients, as acetoin is an ingredient of tobacco products. Acid amides and heterocyclic compounds, like indole, were also observed. Although there are no previous studies on the role of acetamide as a VOC biomarker in OPMDs, an in-vitro study by Sakano et al. found that amidases, which catalyze the hydrolysis of the compounds containing an amide group, are widely distributed in mammalian organs.18 Acetamide was hence proposed as a possible substrate for amidases to produce ultimate carcinogens. The heterocyclic VOC indole was elevated in the OPMD group, which supports a previous study by Ishikawa et al., who showed indole-3-acetate, which is the conjugate base of indole, as a significant volatile biomarker for OLP.19
Twelve VOCs had statistically significantly higher levels in the OSCC groups as compared to the OPMD and control group. Organic fatty acids (33.3%), ketones (33.3%), alcohols (16.6%), alkanes (8.3%), and acid amides (8.3%) were the major classes of VOCs noted in the OSCC subjects.
Lipogenesis appears to be enhanced during carcinogenesis in order to support the tumor demand for cell membrane constituents. Also, free fatty acids are important in cell signaling in neoplasms.20 This may explain the elevated levels of acid VOCs in OSCC subjects in this study. Butanoic acid was seen to be highly significant (p = 0.001) among the acids. Butanoic acid is an extracellular metabolite from periodontopathic bacteria, thought to play an important role in the progression of periodontitis through its contribution to the destruction of gingival tissues and the modulation of local immunity at gingival sites.21 In addition, it has been reported that butanoic acid promotes the migration of normal and neoplastic epithelial cells.22 The percentage of patients with butanoic acid detected was observed to gradually increase from the healthy controls to OPMD and further to the OSCC group. Apart from butanoic acid, pentanoic acid, 4-methyl-, 3-furanmethanol, 2-propanone,1-hydroxy-, 2-hydroxy-gamma-butyrolactone, and 1,2-cyclopentanedione also followed a similar trend, giving these VOCs strong potential to serve as early biomarkers in OSCC. Formic acid (11.4%) is thought to be a breakdown product of formaldehyde, which is also a component of tobacco smoke. Considering that 4 out of 10 active tobacco users in the OSCC group were smokers, it might be the reason for its occurrence in addition to its formation in cancer metabolism.
2-propanone, 1-hydroxy- was found to be significantly elevated amongst the group of ketones (p = 0.001) in comparison with both OPMD and healthy controls, which is in accordance with the study by Shigeyama et al., who dealt with the identification of salivary VOCs in oral cancer.23 Ketones may function as chemoattractants and stimulate the migration of epithelial cancer cells, promoting primary tumor growth.24 Ketone production is also linked to greater fatty acid oxidation rates, which have been reported in numerous malignancies. Cancer cells also exhibit altered glucose metabolism known as the Warburg effect, in which the production of their energy shifts from the Krebs cycle to glycolysis, which could explain the appearance of ketonic VOCs in this study. However, as the concentration of ketones in human fluids or breath fluctuates with certain activities, such as fasting, exercising and eating, some experts advise against using ketones as biomarkers.25 Alcohols were also found in most of the OSCC patients, possibly due to the action of cytochrome P450 enzymes, which hydroxylate the lipid peroxidation biomarkers to produce alcohols. Phillips et al. published an article in 1999 identifying 22 VOCs in the exhaled breath of patients with lung cancer, 15 of which were alkanes.26 Similarly, we found increased butane, 1,4-bis(9,10-dihydro-9-methylanthracen-10-yl)- levels, an alkane to be statistically significant (p = 0.053). The origin of this compound is related to oxidative stress; it is mainly formed during the lipid peroxidation of PUFA constituents of biological membranes, leading to the degradation of phospholipids and, eventually, cellular deterioration.27 It is thought by some researchers to be a secondary product of oxidative stress27; however, others disagree with this hypothesis.28 In addition, acid amides were also found to be significantly high (p = 0.037) in the OSCC group, thereby representing a strong biomarker for OSCC.
When comparing the VOC profiles between the OSCC and OPMD patients, it was the revealed that the salivary metabolites had the potential to discriminate OSCC from OPMD patients. Among the 14 identified metabolites, 6 compounds displayed statistically significant differences between both groups (p ≤ 0.05) (Table 4).
The observed chemical classes of VOCs were acids, ketones and alkanes. Phosphonic acid, formic acid, 2-propanone, 1-hydroxy-, and butane, 1,4-bis(9,10-dihydro-9-methylanthracen-10-yl)- were the differentially expressed VOCs in OSCC in comparison with OPMDs. Except for mercaptoacetic acid and phenol, all metabolites were decreased in OPMDs as compared to OSCC. These up- and downregulations of metabolites may be due to the involvement of metabolites in different metabolic pathways simultaneously.29 Periodontitis is also independently associated with OPMDs.30 This link between periodontitis and OPMDs may explain the occurrence of mercaptoacetic acid and phenol in the OPMD patients, and their strong distinction as a volatile biomarker from OSCC.
Ten VOCs were found to be statistically significant in the comparison between OSCC and healthy controls (Table 6). There were 2 acids, 3 alcohols, 3 ketones, and 2 alkanes found. In addition to butanoic acid, pentanoic acid, 4-methyl- was the most significant VOC noted (p > 0.001) in OSCC patients. The findings of the present study are consistent with the previous research reporting elevated levels of branched-chain fatty acids in cancer-related volatilomic profiles.31 The levels of 2 alcohols were found to be higher in the OSCC group, which could be attributed to the cytochrome P450 enzymatic action, while 1 alcohol – 1-tridecanol, which is a flavoring and fragrance agent, was observed in only 15% of healthy controls in comparison with OSCC patients (0%), and hence was eliminated as a biomarker for OSCC. In addition to this, 1-chloro-dodecane, which is an alkane, was also eliminated as a biomarker for OSCC, as it was present in only 30% of healthy controls and completely absent in OSCC patients.
The remaining VOCs illustrated a rise amongst the OSCC group of patients, although they depicted relatively low statistical significance. Although not statistically significant, 2,5-dihydroxybenzaldehyde (OR > 1) was also observed in 2.9% of OSCC subjects. Aldehydes are generated as intermediates in cytotoxic processes during signal transduction, genetic regulation or cellular proliferation through alcohol metabolism, the reduction of hydroperoxide by cytochrome P450 as a secondary product of lipid peroxidation and the detoxification processes related to smoking. In the particular case of cancer, previous studies reported an increment in the activity of aldehyde dehydrogenases (ALDHs), with cancer cell propagation resulting in the growth and proliferation of tumor cells, thereby implying an increase in the concentration of aldehydes in blood and saliva. Increased aldehyde production in cancer patients may be due to changes in membrane lipid composition and increased oxidative stress in tumor cells. Furthermore, increased levels of certain unsaturated fatty acids in the membranes of tumor cells may increase the production of certain aldehydes through lipid peroxidation. Aldehyde dehydrogenases and alcohol dehydrogenases (ADHs) are two abundant enzyme groups in the human liver. Aldehydes can be irreversibly oxidized to carboxylic acids by ALDHs or reduced to their corresponding alcohols by ADHs, thereby establishing a relation with organic acids and alcohols in accordance with the VOCs obtained in this study.
The analysis of the VOC profiles based on the pTNM staging showed that 12 VOCs were statistically significant (p ≤ 0.05) (Figure 10). The predominant classes of VOCs were organic acids, ketones, acid amides, ethers, and furans. Oxalic acid (25%), 4-hydroxybutyric acid hydrazide (25%), boronic acid (25%), and tridecanoic acid (25%) were the significantly elevated acids found during the early stages, and the ethers diisoamyl ether (25%) and mephenesin (25%) were elevated as well. In addition, ketones like dihydroxyacetone (25%), acid amides like isobutyramide (25%) and furanal derivates like 5-(hydroxymethyl)furfural (25%) were also observed to be distinctively higher in the early stages in comparison with the advanced stages. Diethyl phthalate and 2-hydroxy-gamma-butyrolactone were significantly higher in all subjects with stage-II cancer (100%), providing a potential early biomarker. In addition to these, the acid amide propanamide, 2-hydroxy- (50%) was also observed equally often in both stage I and stage II. Diethyl phthalate and 2-hydroxy-gamma-butyrolactone were the only VOCs present in the advanced stages, i.e. stage III and stage IV. However, there have been no literature reports concerning the salivary VOCs based on the pTNM staging of OSCC till date, although similar studies have been done in breath volatilomics. Fu et al. found the exhaled breath concentration of 2-butanone significantly higher in patients with stage-I lung cancer in comparison with the advanced stages.32 In contrast, Oguma et al. reported increased concentrations of cyclohexane and xylene in advanced lung cancer,33 which does not agree with the results of the present. In another study, Corradi et al. showed that although lung cancer patients had higher levels of ethylbenzene in their breath, the difference between early-stage lung cancer patients and control subjects was less pronounced.34 Peled et al. analyzed breath samples using GC–MS; however, the analysis did not reveal any significant differences between early-stage and late-stage lung cancer, nor did it show any distinction among the sub-histological types.35
As the prognosis and treatment options are critically dependent on the histology of the cancer, the salivary volatilomic profile in the OSCC patients was also identified based on the histopathological staging. The obtained metabolomic profile is in agreement with the literature, which supports the correlation between the pTNM and histopathological staging. Ten VOCs were statistically significant (p ≤ 0.05) (Figure 11). The main classes of VOCs were organic acids, ketones, acid amides, ethers, and furans. Oxalic acid (25%), boronic acid (25%) and tridecanoic acid (25%) were significant in the early histological stages. In addition, ketones like dihydroxyacetone (25%) and 1,2-cyclopentanedione (45%), acid amides like isobutyramide (25%), and furanal derivates like 5-(hydroxymethyl)furfural (25%) were also observed to be distinctively higher in the early stages in comparison with the advanced stages. Diethyl phthalate and 2-hydroxy-gamma-butyrolactone were the only VOCs present in the advanced stage, i.e., in poorly differentiated OSCC, corresponding to the pTNM stages III and IV. These VOC profiles can potentially serve as non-invasive prognostic biomarkers in OSCC. However, there is a dearth of studies in the literature related to the identification of salivary VOCs based on the histopathological staging of OSCC. Few other studies showed that the histopathological staging had no significant impact on VOCs.34, 35
Conclusions
The present study proposes a salivary VOC-based metabolomic profiling approach for patients with OSCC and OPMDs, compared with healthy controls, to support the discovery of clinically relevant biomarkers with potential diagnostic, prognostic and therapeutic applications. The findings provide volatilomic insights into the salivary metabolite alterations associated with OSCC and OPMDs. Although similar classes of compounds were detected in both disease groups, individual VOC profiles showed distinct variations. Additionally, the VOC profiles demonstrated significant associations with gender, age, the type of tobacco use, the pTNM classification, and the histopathological staging. These VOCs may represent tumor-specific candidate biomarkers suitable for screening OSCC and OPMDs. However, larger-scale studies are required to validate these findings and establish standardized protocols for their clinical implementation.
Limitations and recommendations
Challenges include the strong influence of confounding factors, such as food consumption, medications, physical activity, comorbid non-cancer diseases, and the normal gut microbiota, all of which can alter the pattern of generated VOCs. Care must therefore be taken to minimize the impact of these factors. Another limitation is that the origin and biological sources of many VOCs remain unclear, necessitating further research to better understand the altered metabolic pathways associated with their production.
The study population was small; therefore, the findings should be considered preliminary, and future studies should include larger sample sizes. Identifying distinguishable VOC fingerprints or the chemical groups associated with different cancers may facilitate early detection, provide insights into the mechanisms underlying cancer development and progression, and ultimately enable the manipulation of the altered metabolic pathways. Furthermore, the development of a portable, sensor-based point-of-care device for VOC detection would be invaluable in clinical practice for early diagnosis, monitoring disease states and assessing post-therapy outcomes.
Ethics approval and consent to participate
Ethical clearance was obtained from the Ethics Committee for Human Trials of M.S. Ramaiah University of Applied Sciences, Bengaluru, India (No. EC-2020/PG/36). Informed written consent was obtained from patients and controls after explaining the nature of the study.
Data availability
The patient datasets used in the current study are confidential and cannot be shared.
Consent for publication
Not applicable.
Use of AI and AI-assisted technologies
Not applicable.