Abstract
Background. Due to their low specificity, non-enzymatic antioxidants play a significant role in the protection of organisms against free radicals. They are normally sourced from the diet, and independently react with oxidizing molecules and their products.
Objectives. The study aimed to determine the concentrations of selected non-enzymatic antioxidants (uric acid (UA), reduced glutathione (GSH) and polyphenols) in the gingival fluid and saliva of patients diagnosed with periodontitis according to the current criteria.
Material and methods. This prospective case–control study included 50 patients with periodontitis, who were divided into 2 groups depending on disease severity, along with 25 healthy controls. Unstimulated saliva, stimulated saliva and gingival crevicular fluid (GCF) were collected from all subjects, and non-enzymatic antioxidant concentrations were determined.
Results. Significantly lower concentrations of all tested non-enzymatic antioxidants were observed in the gingival fluid as well as in the unstimulated and stimulated saliva of patients with periodontitis (p < 0.05). Moreover, the concentration of GSH was a parameter that differentiated the various degrees of periodontitis (p < 0.05). A significantly lower concentration of GSH was found in the stimulated saliva of patients with moderate progression as compared to those with fast progression of the disease (p < 0.05).
Conclusions. The continuation of research on the GSH concentrations in the gingival fluid and saliva may be useful in the context of biomarkers for periodontitis progression.
Keywords: periodontal disease, gingival crevicular fluid, salivary diagnostics
Introduction
Non-enzymatic (low-molecular-weight) antioxidants are characterized by much lower specificity as compared to enzymatic antioxidants. For this reason, these substances play a much greater role in protecting organisms against free radicals; they inhibit oxidation processes by reacting with oxidizing agents and the intermediate products of oxidation. Such interventional antioxidants reduce free radicals on their own through propagation or termination. Most of them are exogenous compounds supplied in the diet. They are divided into hydrophobic antioxidants, which protect the inside of the cell membranes, and hydrophilic antioxidants, which are active in the aqueous environment of the cell.1 Among the most important non-enzymatic antioxidants are uric acid (UA), reduced glutathione (GSH) and polyphenols.
Uric acid participates in the capture of hydroxyl radicals, lipid peroxides and singlet oxygen. It limits the processes associated with free radicals by creating complexes with iron, copper and manganese ions, which stabilizes the reduced form of vitamin C. The compound is also responsible for 70–80% of the antioxidative potential of saliva; therefore, it is considered the most important antioxidant of the oral cavity.2, 3 However, in high concentrations and in the presence of copper ions, UA and its derivatives may be highly cytotoxic. In such conditions, it has been shown that UA may intensify lipid peroxidation, and therefore act as a pro-oxidant.4, 5
Reduced glutathione is composed of 3 amino acid residues (γ-glutamyl–cysteinyl–glycine). It is most often oxidized to glutathione disulfide, via a non-enzymatic or enzymatic pathway, which can then be reduced by glutathione reductase or can be actively removed from the cell. Furthermore, GSH is responsible for maintaining the thiol groups of proteins in a reduced form, and for reactions with organic peroxides, hydrogen peroxide, free radicals, xenobiotics, and protein disulfides.6
Polyphenols differ in terms of structure, mass, and physiochemical and biological properties. In animal organisms, they are not synthesized, but are absorbed from plant foods. Their antioxidant activity consists in, among other things, inhibiting the activity of enzymes responsible for the formation of reactive oxygen species (ROS), chelating the metals catalyzing the reactions of ROS formation, binding and inactivating the formed free radicals, intensifying the activity of antioxidant enzymes, and increasing the concentrations of other low-molecular-weight antioxidants.7 Due to the significant exposure of the oral cavity to environmental and diet-related stress, polyphenols reach high concentrations in the mucous membrane, increase the antioxidant activity of biological fluids in the oral cavity and show antibacterial activity against periopathogens in vitro.8
In periodontitis, the excessive secretion of ROS and oxidative stress occur due to the exposure of (mostly) neutrophils to periopathogens and their products. This leads to periodontal tissue damage through the intensification of such processes as lipid peroxidation in the gingival tissue, gingival crevicular fluid (GCF) and saliva. Furthermore, it causes protein and deoxyribonucleic acid damage, and changes the functional activity of the proteins found in GCF and saliva.9 It has been suggested that the chronic occurrence of such processes may result in the depletion of the antioxidant capacity of the enzymatic and non-enzymatic systems. It is manifested as a significant decrease in the activity of preventive and interventional antioxidants as well as in the total antioxidant capacity of GCF and saliva.9, 10 Non-enzymatic antioxidants, which can be supplied exogenously and, as a consequence, can be applied in treatment to reduce the effects of oxidative stress, are particularly important with regard to the abovementioned processes. However, there is no data concerning the antioxidant properties of GCF or saliva with respect to the new criteria for the classification of periodontal disease, established during the 2017 World Workshop on the Classification of Periodontal and Peri-Implant Diseases and Conditions.11 Classification into stages and grades refers to the severity of the disease at the time of treatment and the treatment plan complexity. Grades provide information about the characteristics of the disease, the rate of its progression, risk assessment, and the analysis of possible treatment failure as well as the evaluation of the impact of periodontopathy and its treatment on the general condition of the patient.11
The current study aimed to determine the concentrations of selected non-enzymatic antioxidants (UA, GSH and polyphenols) in the GCF and saliva of patients diagnosed with periodontitis according to the current criteria. Additionally, correlations between the concentrations of these antioxidants in gingival fluid and saliva and the parameters of the clinical condition of the periodontium were evaluated.
Material and methods
Patients
This prospective study involved 50 patients treated for periodontitis at the Department of Periodontology of Wroclaw Medical University, Poland. The diagnosis was made based on a clinical examination, according to the current definition of periodontitis.11 All patients were Polish Caucasians aged 20–55 years. The study group with periodontitis was divided into 2 subgroups – stage III or IV, or grade B or C.
The control group was composed of 25 persons with a clinically healthy periodontium (bleeding on probing (BoP) <10%, pocket depth (PD) ≤3 mm) who matched the study group in terms of age and gender, and who had been admitted to the Academic Dental Clinic in Wroclaw for treatment.
The exclusion criteria for both the study and control groups were as follows: age below 20 or above 55 years; systemic comorbidities associated with oxidative stress (cancers, diabetes, hypertension, rheumatoid arthritis, kidney diseases, lung diseases, or thyroid diseases); pregnancy; use of any medications or supplements during the 3 months preceding the study; smoking; number of teeth below 15; occurrence of clinical lesions on the oral cavity mucosa; and periodontal treatment less than a year before the study. The research was approved by the Bioethics Committee at Wroclaw Medical University (KB-559/2018), and was conducted between February 19, 2018 and August 30, 2019.
Material collection
The methods of Toczewska et al. were followed throughout the study.12, 13 The material collected for analysis included total mixed unstimulated saliva and stimulated saliva, with both types of samples collected via spitting. All samples were taken between 8 a.m. and 10 a.m. Saliva was collected in a sitting position, with the head slightly inclined downward, and with minimal facial and labial movements. There was an initial 5-minute adaptation period prior to collection. The saliva accumulated at the base of the oral cavity was spat into a sterile Falcon® test tube, which was placed in a container filled with ice. To avoid possible contamination from other sources, the oral cavity was rinsed two times with room-temperature distilled water before saliva was collected. Unstimulated saliva was spat to a maximum volume of 5 mL, within no more than 10 min.
Stimulated saliva was collected at 5-minute intervals. The secretion of saliva was stimulated by administering 10 µL of 2% citric acid (Sigma-Aldrich, Poznan, Poland) on the tongue every 30 s.14, 15 The volume of saliva was measured using an automated Eppendorf® pipette, with an accuracy of 0.1 mL. Immediately after collection, the samples were centrifuged (5,000 × g, 20 min, 4°C). An antioxidant (10 µL of 0.5 M-butylated hydroxytoluene (Sigma-Aldrich) per 1 mL of saliva) was then added to the supernatant fluid, and the content was frozen at −80°C and stored for no more than 3 months for further analysis.16, 17 The salivary flow was calculated over a 1-minute period by dividing the volume of saliva by the time necessary for its secretion, and was expressed in mL/min.14
After selecting the clinically deepest periodontal pockets, GCF was collected using PerioPaper Strips® (Oraflow Inc., New York, USA). The region was dried with compressed air and isolated from saliva by employing cotton dental rollers. PerioPaper Strips contaminated with blood or saliva were discarded. Before and after collecting the material, the strips were placed in Eppendorf test tubes and weighed on an analytical balance to determine the volume of GCF.12, 13 The supernatant fluid (10 µL of 0.5 M-butylated hydroxytoluene per 1 mL of saliva) was added to GCF and the samples were frozen at −80°C.16, 17
Clinical trial
The clinical trial was conducted using a mouth mirror, a HuFriedy® periodontometer (Warsaw, Poland), which was calibrated every 1 mm, and an artificial light source. The following clinical parameters were assessed: number of preserved teeth; modified plaque index (PI)18; approximal plaque index (API)19; mean PD measured at 6 points of each tooth; mean interproximal PD for all teeth measured at 4 points of each tooth; number of sites with PD > 5 mm; mean clinical attachment level (CAL) measured at 6 points of each tooth; BoP index20; papillary bleeding index (PBI)21; maximum value of tooth mobility assessed with the use of Periotest® (Medizintechnik Gulden, Modautal, Germany); and mean value from the indications of Periotest for all teeth.
Enzymatic antioxidant activity
The biochemical tests of saliva and gingival fluid were conducted in the Experimental Dentistry Laboratory at the Medical University of Bialystok, Poland. All measurements were conducted in duplicate and were standardized to total protein content. On the day of the measurements, the samples of saliva and GCF were slowly thawed at 4°C. The saliva and GCF samples were then mixed with a vortex mixer immediately before analysis.
To extract gingival fluid, the strips were placed in an Eppendorf test tube containing 0.02 M phosphate-buffered saline (PBS) solution (pH 7.0) (Sigma-Aldrich) in the proportion of 1 strip/500 µL PBS, and were mixed for 30 s with a vortex mixer before being centrifuged (3,000 × g, 5 min, 4°C). The supernatant was preserved for testing.12, 13 Gingival fluid was used for all experiments on the same day.
The concentration of GSH was determined using a colorimetric method based on the reduction of 5,5’-dithiobis-(2-nitrobenzoic acid) (Sigma-Aldrich) to 2-nitro-5-mercaptobenzoic acid under the influence of GSH contained in the test sample.22 The absorbance of the 2-nitro-5-mercaptobenzoic acid product was measured at a wavelength of 412 nm and its concentration was calculated from a reference curve for GSH. The measurements were conducted in duplicate and the values were expressed in µg/mg of total protein.
The concentration of UA was measured using the QuantiChrom™ Uric Acid Assay Kit (DIUA-250; BioAssay Systems, Hayward, USA). This method consists in the reaction of 2,4,6-tripirydyl-s-triazine with the iron ions (3+) contained in UA in the test sample. Changes in the absorbance of the obtained complex were measured at a wavelength of 690 nm.
Total polyphenol content (TPC) was determined with the use of the Folina-Ciocâlteu (FC) reagent (Pol-Aura, Roznowo, Poland), which is a mixture of phosphotungstic acid and phosphomolybdic acid. As a result of the reaction of FC with phenols, a blue product with a maximum absorbance of 760 nm was obtained.23 Total polyphenol content was calculated from a reference curve for gallic acid and the values were expressed as µg/mg of total protein.
Statistical analysis
The 2 groups were compared using the Mann–Whitney U test, whilst the analysis of the 3 groups (with regard to different stages of the disease) was conducted using the Kruskal–Wallis one-way analysis of variance (ANOVA) followed by Dunn’s post-hoc test. Spearman’s rank-order correlation was used to assess associations between the variables. The threshold for statistical significance was set at p < 0.05, while in the correlation analysis, the threshold was p < 0.02. All analyses were conducted with the use of the Statistica software, v. 13.1. (TIBCO Software Inc., Palo Alto, USA).
Results
The patients’ general and periodontal data is presented in Table 1.
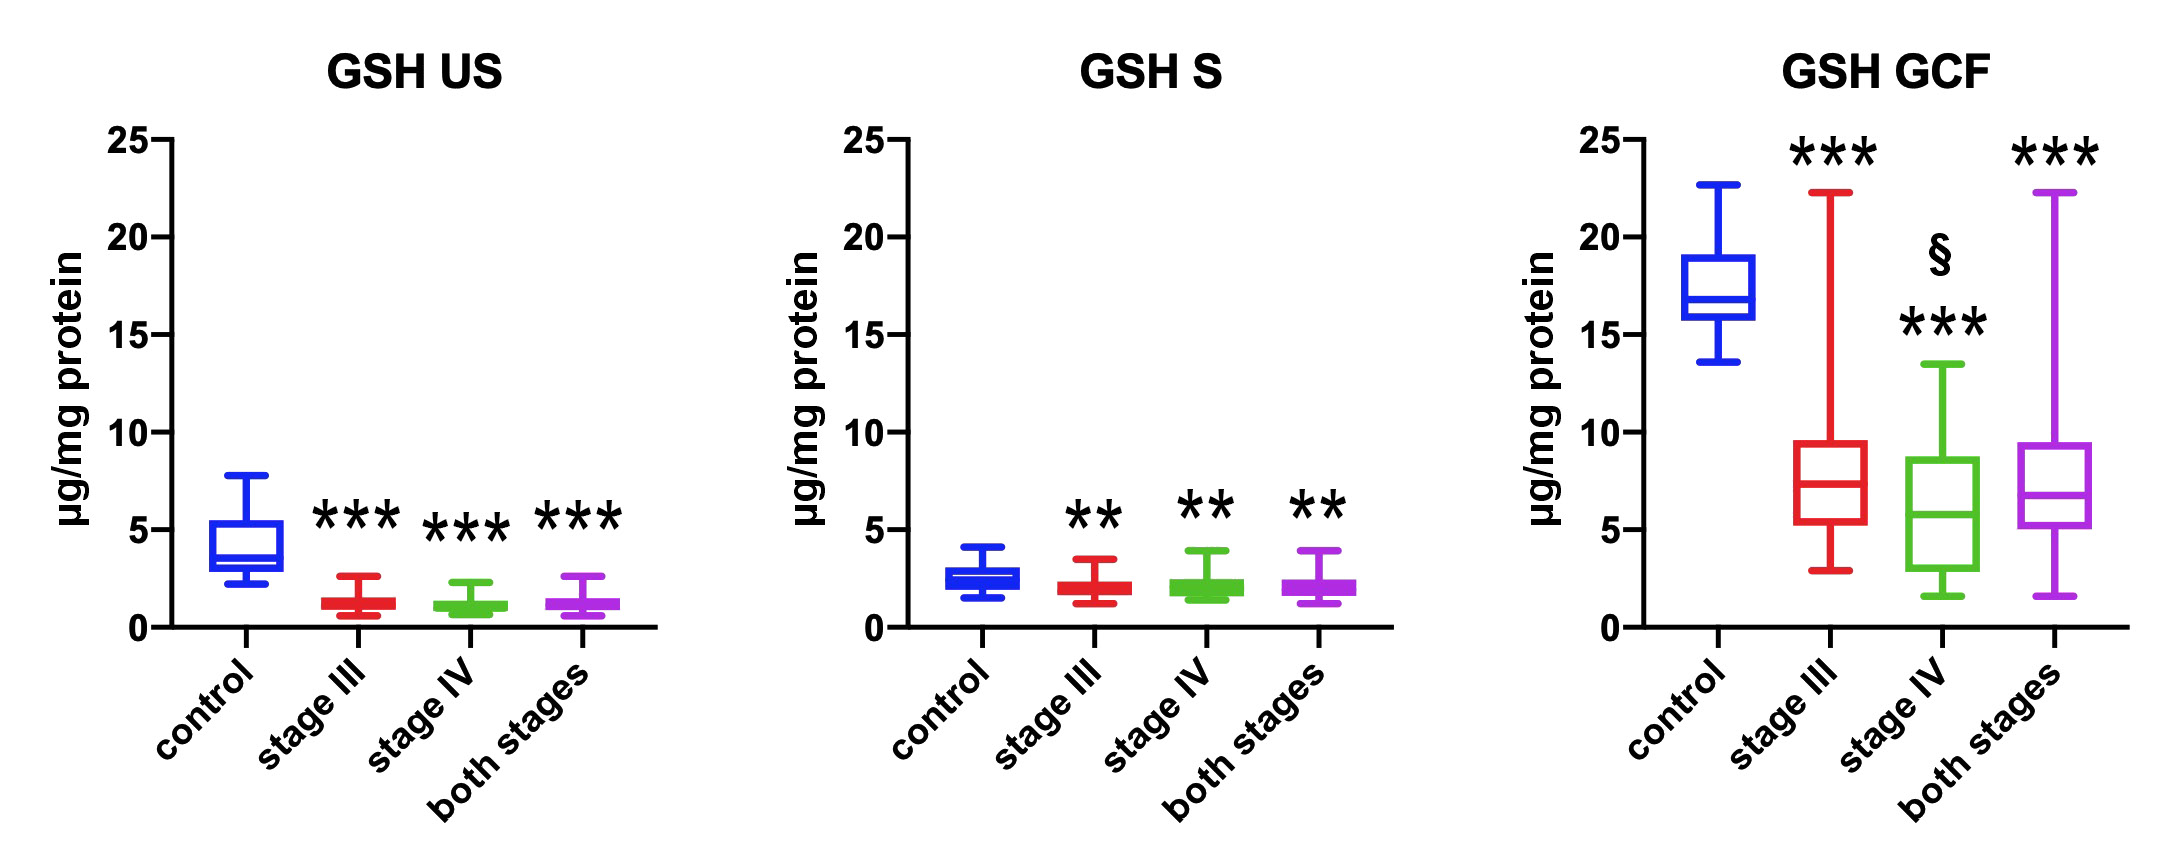
In comparison with the control group, the concentrations of GSH in the study group were significantly lower in both biological fluids. This was especially evident in unstimulated saliva and gingival fluid (p < 0.001), and regarded all patients with periodontitis, at both stages. A significantly lower concentration of GSH was observed in the gingival fluid of those at the most severe stage of periodontitis (stage IV) as compared to stage III patients (p = 0.039) (Figure 1).
In both types of saliva and in gingival fluid, the concentrations of UA were significantly lower in both periodontitis subgroups as compared to patients with a clinically healthy periodontium (p < 0.001). The concentrations of UA in these fluids did not differentiate the advancement of periodontitis (Figure 2).
In the unstimulated saliva and gingival fluid of patients at both stages of periodontitis, TPC was significantly lower as compared to the control group (p < 0.001). In stimulated saliva, this difference was significant for all persons from the study group (p = 0.016) and for those with stage IV periodontitis (p = 0.028). Total polyphenol content did not differ significantly with regard to different stages of periodontitis (Figure 3).
Comparisons were made between the concentrations of the 3 non-enzymatic antioxidants in both types of saliva and in the gingival fluid of patients with grade B or C (stage II or stage IV, respectively) periodontitis. The results indicated a significantly lower concentration of GSH in the GCF obtained from participants with periodontitis of moderate progression a compared to those with fast progression of the disease (p = 0.039).
Total polyphenol content in saliva and gingival fluid as well as the clinical condition of the periodontium were positively correlated across the entire study group. Two significant positive correlations were observed between TPC in unstimulated saliva and the advancement of gomphosis, according to the measurements conducted with the use of Periotest (for the maximum value: R = 0.33, p = 0.020, and for the mean value: R = 0.33, p = 0.018). A significant negative correlation between the concentration of UA in stimulated saliva and the number of preserved teeth was also revealed (R = −0.36, p = 0.018) (Table 2). In patients with the most advanced stage of periodontitis, there were significant positive correlations between the concentration of UA and TPC in gingival fluid and the value of API (R = 0.53, p = 0.015, and R = 0.55, p = 0.013, respectively) (Table 3). The assessment of relationships between antioxidant concentrations revealed strong correlations between GSH and UA in unstimulated and stimulated saliva (R = 0.54 and R = 0.55, p < 0.001), between UA and TPC in unstimulated saliva (R = −0.38, p = 0.010), and between GSH and TPC in stimulated saliva (R = −0.81, p < 0.001).
Discussion
The data relating to the concentrations of the most frequently tested non-enzymatic antioxidants in periodontitis in the gingiva, gingival fluid, saliva, and blood, are presented in Table 4.24, 25, 26, 27, 28, 29, 30, 31, 32, 33, 34, 35, 36, 37, 38 Results and observations from the current study as well as from other studies are quite unambiguous and indicate that in periodontitis, non-enzymatic antioxidant concentrations are significantly reduced in saliva and gingival fluid. The most homogenous results were obtained for GSH; it has been consistently shown in numerous studies to be significantly decreased in gingival fluid as compared to individuals with a healthy periodontium.24, 30, 34 Such decreases have also been observed in saliva and plasma,27 and, for glutathione, in serum.36 In the current study, a correlation was observed between the clinical advancement of periodontopathy (and its duration) and a decreased concentration of GSH in gingival fluid (significantly lower in stage IV as compared to stage III).
Glutathione is secreted to GCF by epithelial cells and neutrophils, and under physiological conditions, its concentration in GCF is 1,000 times higher than it is found in plasma.39 However, its concentration is reduced in patients with periodontitis due to a strong respiratory burst, the destruction of the epithelium and the degradation of proteins by periopathogens. The greatest ability to metabolize glutathione to hydrogen sulfide is shown by Treponema denticola, Fusobacteria (nucleatum, periodonticum, and necrophorum), Parviromonas micra, and Prevotella tannerae.40 In the gingival tissue that is inaccessible to periopathogens, the concentration of reduced and oxidized glutathione may even be elevated.27, 29 Using gas chromatography in combination with mass spectrometry, Chen et al. conducted an analysis of 349 metabolites of gingival fluid in patients with generalized aggressive periodontitis.36 The secondary nature of the decrease in the concentration of glutathione and its reduced form in relation to the advancement of periodontitis was also indicated by the possibility of significantly improving its secretion to GCF as a result of non-surgical periodontal treatment.34 In our opinion, the lowest concentrations of GSH in the unstimulated saliva of patients with periodontitis stem from a single source, which is the outflow of GSH from periodontal pockets together with gingival fluid and the degrading activity of periopathogens in saliva. The observation of significantly lower concentrations of GSH in GCF in the moderate grade of periodontitis progression as compared to fast progression can be explained by the slower course of the former and the exhaustion of the antioxidative potential of GSH.
Uric acid is secreted into saliva by passive diffusion from blood and its concentration depends on the volume of the secreted saliva, as previously demonstrated.41 It is estimated that UA is responsible for approx. 70% of the total antioxidative potential of saliva.19 Uric acid, which is an end product of purine metabolism, is produced as a result of a reaction that also generates ROS. For this reason, salivary hyperuricemia would not be beneficial. The UA concentration in both types of saliva in patients with periodontitis was significantly lower as compared to the control group, which was also observed in other studies,25, 33 though this difference was not confirmed by 2 other publications.26, 32 However, it should be noted that neither of the abovementioned studies took CAL into account when defining periodontitis, and the basic inclusion criterion was a radiological image.
In the current study, a significant decrease was observed in the concentration of UA in the GCF obtained from periodontitis patients in comparison with clinically healthy sites. With the use of the most popular colorimetric uricase–peroxidase method for the evaluation of the UA concentration, Narenda et al. did not show significant differences in its concentration in GCF between the chronic and aggressive periodontitis groups and the control group (in the control group, the UA concentrations in blood serum and gingival fluid were identical, i.e., 5.11 ±0.54 mg/dL).37 It is possible that these contradictions stem from the application of different methods for the determination of the UA concentration. Nonetheless, a significant reduction in the concentration of UA in gingival fluid and saliva in periodontitis is probably due to its increased activity against ROS in the dental pocket and the entire oral cavity. Indeed, this is indirectly indicated by the positive correlation between its concentration in gingival fluid and the presence of plaque in interdental spaces in stage IV periodontitis. Moreover, there is also a possibility of significantly increasing the concentration of UA in saliva as a result of non-surgical periodontal treatment.32
Positive correlations between UA and GSH concentrations may be indicative of the synergy of non-enzymatic antioxidant cooperation in protection against periodontal oxidative stress. However, the findings regarding hyperuricemia in peripheral blood in periodontitis and the possibility of significant reductions thereof as a result of scaling and root planing combined with the administration of exogenous antioxidants are seemingly contradictory to the above observations.35, 38, 42 Nonetheless, hyperuricemia in GCF and saliva plays a completely different role in periodontitis than it does in the peripheral vascular bed. In the latter case, it can be a sign of immunological-metabolic dysregulation, linking the clinical status of the periodontium to systemic pathologies.43
Polyphenols are plant metabolites that are not synthesized endogenously. Therefore, their concentration in vivo reflects the supply and absorption of these compounds from food. They include a number of biologically active substances (e.g., flavonoids and phenolic acids), many of which have antioxidant properties. Apart from their direct interventional activity against ROS, these compounds also participate in intercellular signaling that promotes the activity of enzymatic antioxidants, such as heme oxygenase, and inhibit enzymes in ROS and reactive nitrogen species production pathways.44
There are no studies available in the literature investigating TPC in gingival fluid or saliva in periodontitis. Studies on antioxidant phenolic components with regard to periodontopathy conducted to date have been randomized clinical studies on coenzyme Q and catechins as well as in vitro and animal studies.44 A significant reduction in TPC in GCF was observed in our patients with periodontitis, though the stage and grade of periodontitis did not have a significant impact on TPC. It seems that the antioxidative activity of polyphenols develops in the periodontal pocket, similar to UA, in response to stimulation by plaque bacteria (a significant positive correlation between TPC in GCF and API in stage IV periodontitis was found). Meanwhile, a strong pro-oxidative impulse in the dental pocket is responsible for a significant reduction in TPC in the gingival sulcus. Regardless, fluctuations in salivary TPC may be of limited value due to the possible activity of flavonoids that are commonly found in food.
Lower values of TPC were observed in the unstimulated saliva of patients with periodontitis. In addition, the concentration correlated directly with the electronic measurement of tooth mobility. This pioneering research on the impact of the periodontal condition on TPC should be continued, with the attention paid to determining antioxidant concentrations in serum. Furthermore, other antioxidants, such as resveratrol, apigenin and kaempferol, should be investigated. Such research may lead to recommendations for the introduction of antioxidant supplementation into periodontal treatment protocols.
The majority of studies on non-enzymatic antioxidants in periodontal diseases have been conducted with regard to ascorbate and α-tocopherol. Some of them showed a significant decrease in the ascorbate concentration in the serum and plasma of individuals with periodontitis,27,45 depending on the severity of periodontopathy.46 However, periodontitis does not have a significant impact on the ascorbate concentration in saliva.25, 26 Researchers have also observed a significant decrease in the α-tocopherol concentration in plasma27; however, unlike with vitamin C, its high concentration in serum was not associated with a rare occurrence of the most severe clinical form of periodontal disease.46 In the analysis of the gingival fluid metabolome in patients with generalized aggressive periodontitis, the concentrations of ascorbate and α-tocopherol were over 18 times and 6 times higher, respectively, in comparison with a clinically healthy periodontium.36
Salivary redox biomarkers are being increasingly used in clinical practice, both in the diagnosis of systemic diseases and in the diseases of the oral cavity.10, 47, 48, 49, 50, 51, 52 Unfortunately, in the current study, they did not differentiate between the grades of periodontitis (except for GSH), which indicates that their diagnostic value is low. However, due to the significant impact of oxidative stress on the pathogenesis of periodontitis, further studies on a larger population of patients are needed.
Conclusions
A significant decrease in the concentrations of all the studied non-enzymatic antioxidants in saliva and gingival fluid from periodontitis patients may be indicative of a strong oxidative impulse associated with inflammatory and destructive processes in dental pockets. Further studies concerning the GSH concentration in gingival fluid and saliva may be useful in the context of periodontitis progression biomarkers. The model of periodontitis progression which is currently being considered provides the basis for the local application of exogenous non-enzymatic antioxidants, such as polyphenols resveratrol and curcumin, to inhibit signaling that initiates and exacerbates the disease.53
Ethics approval and consent to participate
The research was approved by the Bioethics Committee at Wroclaw Medical University, Poland (KB-559/2018). Written informed consent was obtained from all participants.
Data availability
The article contains complete data used to support the findings of this study.
Consent for publication
Not applicable.