Abstract
Background. Various ceramic materials have been used for esthetic rehabilitation with implants, but the issues regarding the dissipation of masticatory loads are not well understood.
Objectives. This in vitro quasi-static study aimed to evaluate with the photoelasticity test the dissipation of stress around dental implants with regard to different rehabilitation materials.
Material and methods. A photoelastic model was elaborated in resin, where a conical Morse-tapered implant was inserted. On the abutments (1 per crown), 6 single crowns were prepared using different materials to form 6 groups: feldspathic ceramic (G1); chrome-cobalt alloy covered with ceramic (G2); hybrid ceramic (G3); zirconia covered with ceramic (G4); zirconia (G5); and lithium disilicate (G6). Axial loads of 100 N (load 1) and 300 N (load 2) were applied in the center of the crowns, and photoelastic images were captured and analyzed. The total area of stress dissipation was measured for each group. Then, a computational program was developed to measure the number of pixels of the colors generated in each group. Two image sizes were analyzed – total image and crestal image.
Results. Counting the numbers of pixels of the colors in the total images showed that G6 > G4 > G5 > G1 > G2 > G3 when load 1 was applied. When load 2 was applied, the sequence was G6 > G4 > G1 > G3 > G2 > G5. In the evaluation of the crestal area, the obtained results were G4 > G5 > G1 > G3 > G2 > G6 with load 1 and G5 > G1 > G2 > G6 > G4 > G3 with load 2.
Conclusions. Within the limitations of this in vitro quasi-static study, the findings indicate that the zirconia crown (G5) presented higher stress in the crestal images, while the lithium disilicate crown (G6) presented higher stress in the total images.
Keywords: dental implant, ceramic materials, computer-aided design/computer-aided manufacturing, photoelastic stress analysis, stress dissipation
Introduction
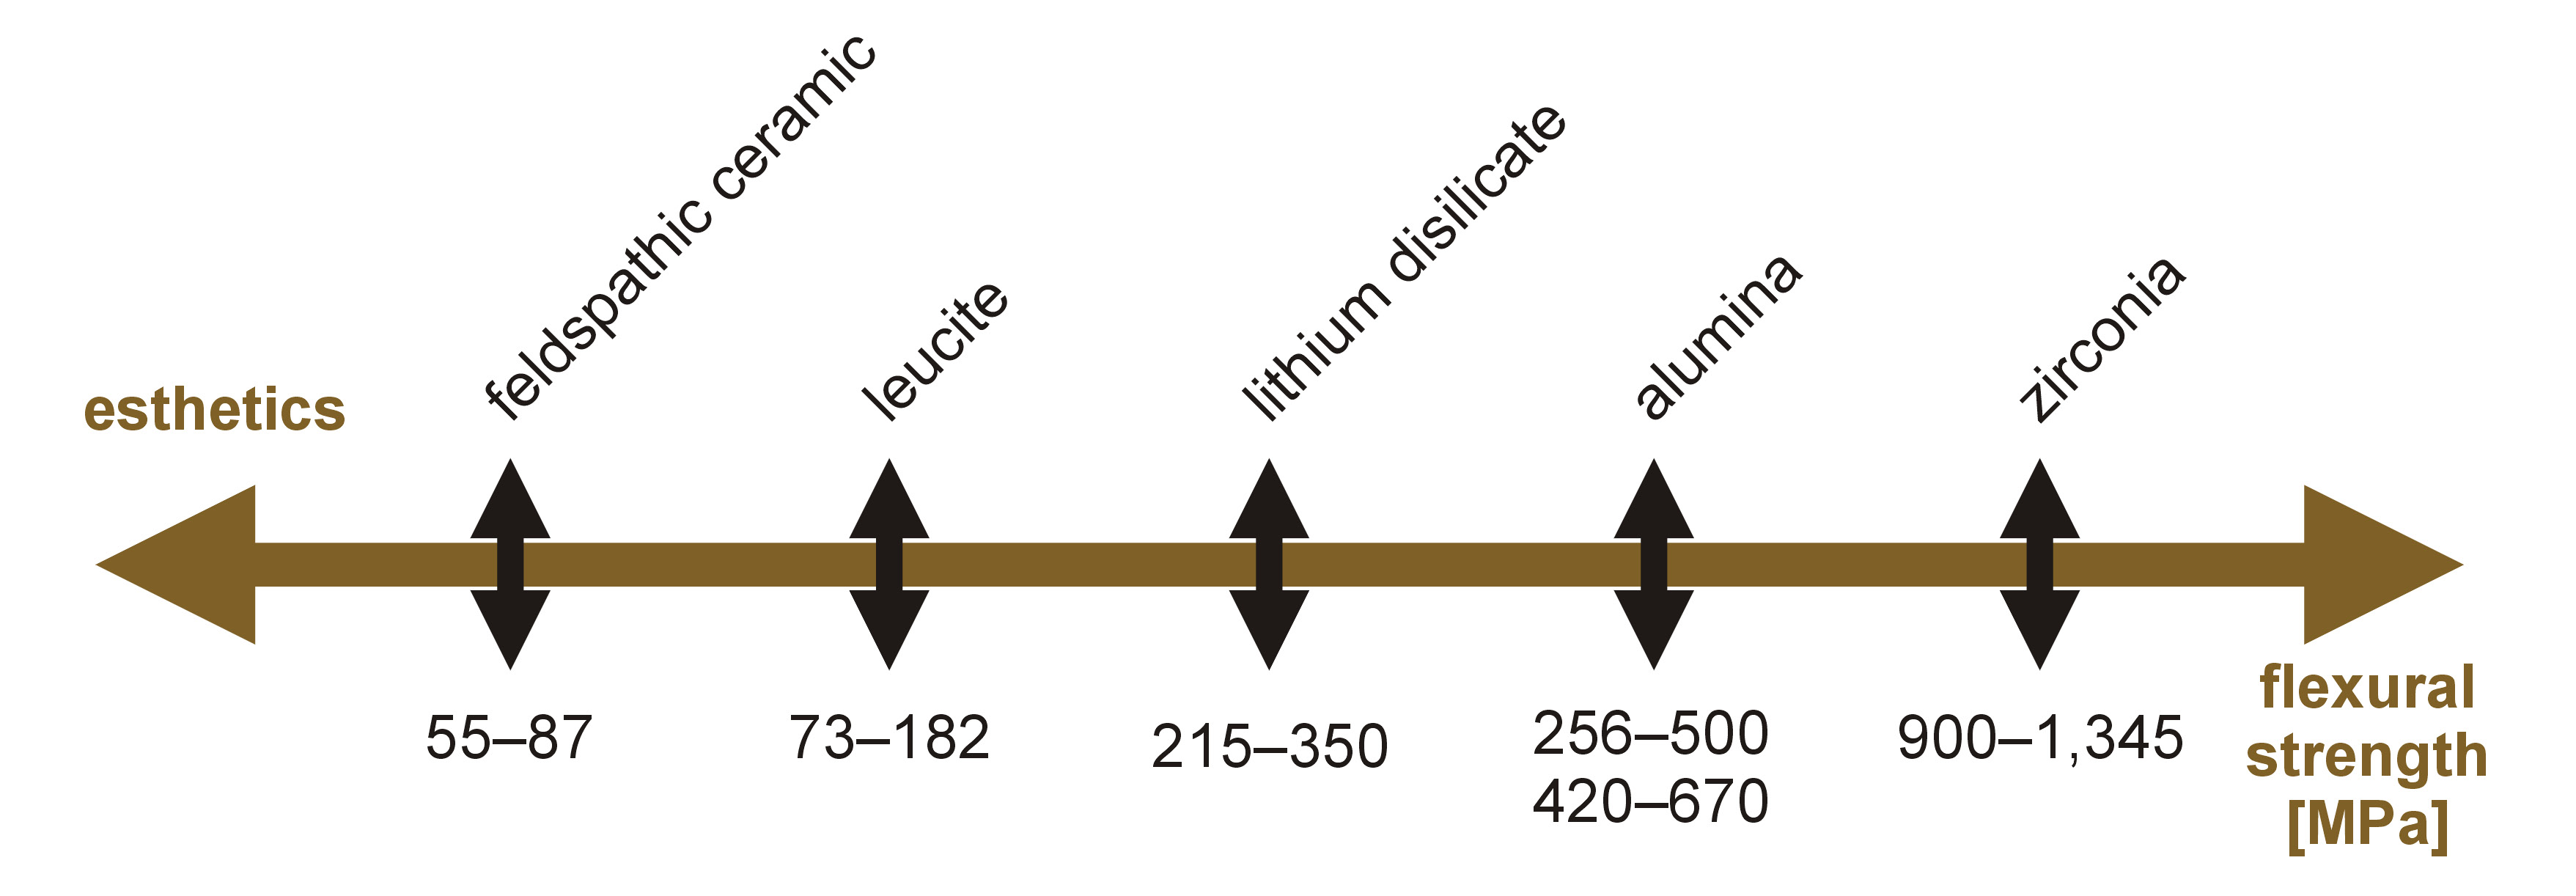
The ongoing search for the ideal restorative material in terms of resistance characteristics, esthetics and biocompatibility has led to the development of new materials in modern restorative dentistry. The innovations have been implemented in implantology as well. However, at present, we can affirm that there is no consensus on the ideal material that adapts to all cases. The most esthetic materials have lower flexural strength and vice versa (Figure 1).1
Describing more specifically some of the ceramic materials frequently used for esthetic restorations, feldspathic ceramic has excellent esthetic qualities, but it has lower resistance than other ceramic materials; this difference is more notable in implantology due to the impossibility of increasing resistance by performing adhesive cementation on the dental substrate. Since lithium disilicate presents acceptable levels of both resistance and esthetics, it is indicated for single implant restorations.2, 3 Zirconia is already widely accepted as a restorative material due to its biocompatibility and resistance properties, although it has poorer esthetic qualities as compared to the previously mentioned materials.4, 5
Actually, there is controversy about the use of zirconia without ceramic coating due to its great hardness. There is a possibility of excessive wear of the opposing part and of the transmission of loads to the supporting structures in the case of materials with such hardness. Hardness, in addition to the surface roughness and tenacity of restorative materials, is one of the factors considered as determinants of the enamel wear caused by antagonistic teeth.6 The Vickers hardness value for zirconia is 1,250 HV, which is well above the hardness of the enamel (275 HV) or the dentin (66 HV), and also of other frequently used materials, such as composite (87–124 HV), feldspathic porcelain (700 HV), lithium disilicate (590 HV), titanium (349 HV), and gold (130–135 HV).7 In theory, using a material with a lower modulus of elasticity would transmit less stress to the supporting structures. Some authors recommend the use of more resilient materials to absorb part of the impact exerted on implants.8, 9 Other authors recommend the use of acrylic resin teeth for the full-arch prostheses restored over implants, since this type of material would compensate for the lack of resilience of this rehabilitation system, which is different from natural teeth, as natural teeth have periodontal ligaments.10, 11
In a finite element analysis study evaluating stress distribution in the supporting structures with regard to materials of different hardness, the researchers showed that both resin types (composite and ceramic-filled resin) transmitted less load than porcelain or the gold alloy.10 Other finite element analysis studies were unable to demonstrate benefits in stress distribution in the supporting structures with the use of more resilient materials.12 On the contrary, some authors demonstrated that the most resilient materials increased stress in the prosthetic fastening screws.13 Hence, until now, there has been no consensus on which material is ideal from a biomechanical point of view. Thus, the objective of this study was to evaluate by means of the photoelastic stress analysis, applying a quasi-static axial load, the dissipation of stress in the supporting structures of the implant restoration with a unitary crown. Six different materials with different elasticity modules were tested for unitary crowns: feldspathic ceramic; metal-ceramic; polymer-filled ceramic; ceramic-stratified zirconia; monolithic zirconia; and lithium disilicate. The hypothesis tested was that the material used for the manufacture of the crown does not affect the pattern of load dissipation in the peri-implant bone tissue.
Material and methods
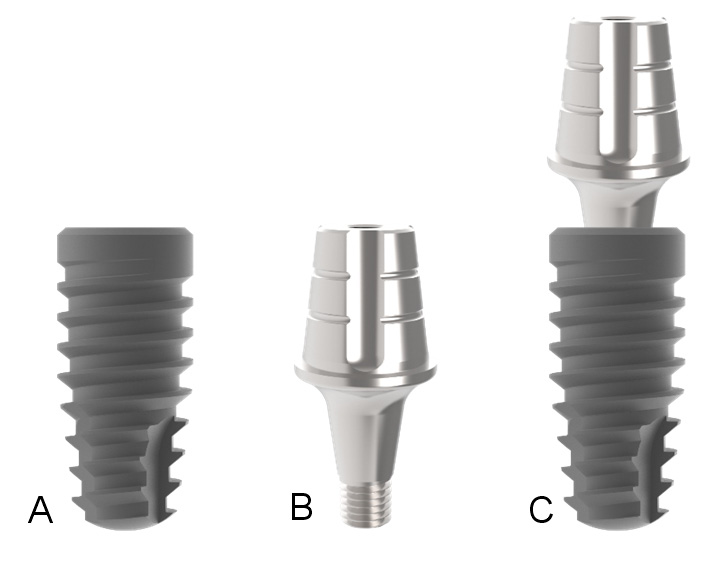
This in vitro study used 1 conical implant with a Morse-tapered connection, with dimensions of 11 mm in length and 4 mm in diameter, and 6 abutments (1 per crown) – 4.5 mm in diameter, 6 mm in height and 3.5 mm in the transmucosal length. All pieces were manufactured by Implacil De Bortoli (São Paulo, Brazil) and are demonstrated in Figure 2.
Development of the experimental models
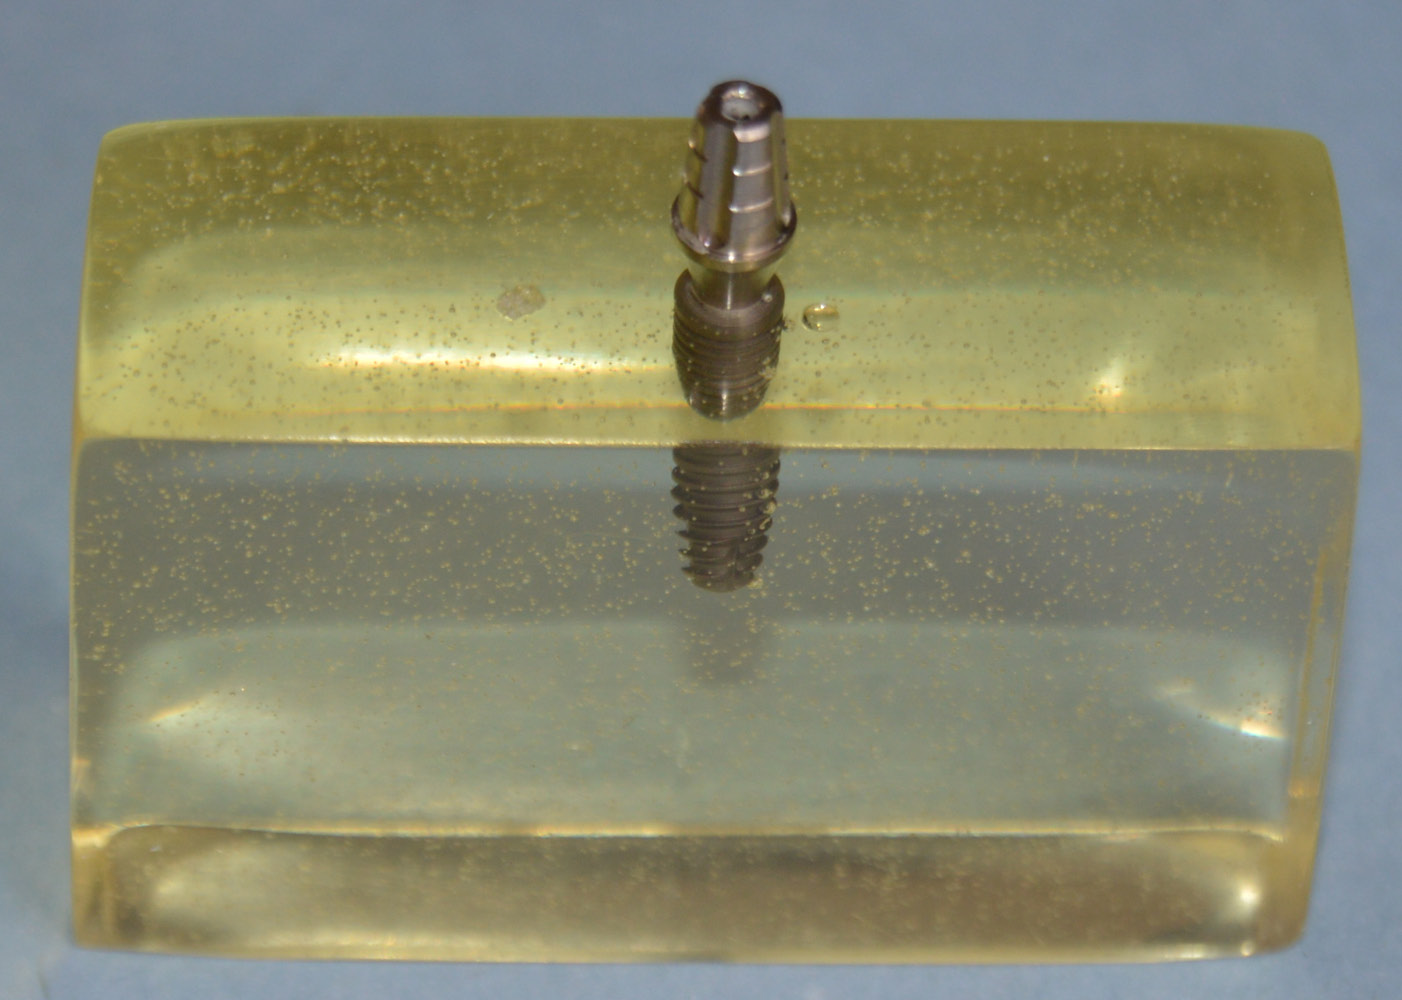
Initially, the implant was installed in a wooden block with dimensions of 12 mm in thickness, 25 mm in height and 30 mm in length at a depth of 2 mm from the surface of the block, according to the manufacturer’s recommendations. Then, the abutment was screwed to the implant and a silicone impression was made with the use of the transfer abutment indicated for the system, generating a mold for the inclusion of the implant in resin. The implant–abutment set was positioned with the abutment connected to the transfer abutment inside the silicone mold and resin was poured, filling all spaces. A flexible epoxy resin model G4 (Polipox, São Paulo, Brazil) was used. After the complete polymerization of the resin, the block was polished using a sequence of sandpaper and resin polishing pastes. Figure 3 shows the resin block with the implant–abutment set.
Crown preparation and group formation
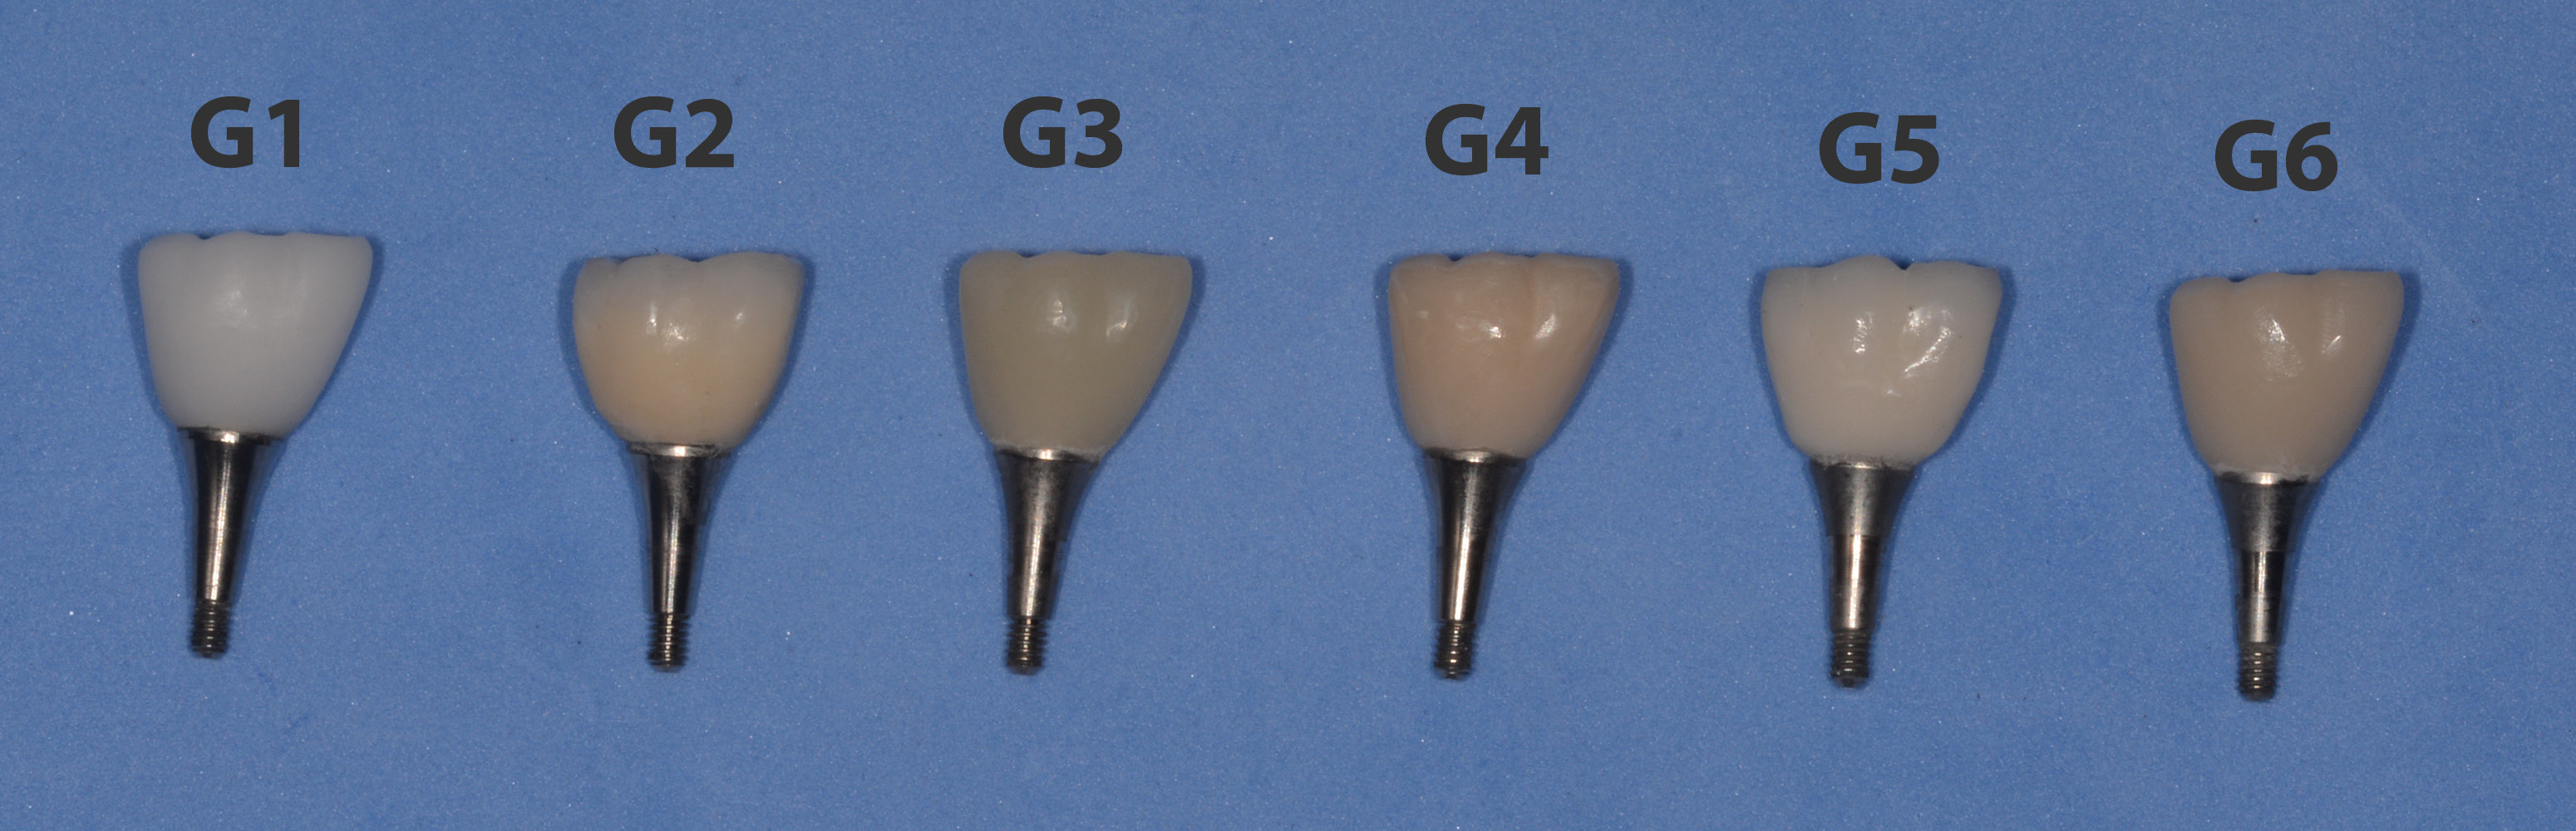
A plastic cap corresponding to the abutment dimensions was installed over 1 abutment, and a dental crown corresponding to a lower right first molar, with dimensions equal to the natural anatomical measurements described for this dental element (11.4 mm in the mesio-distal direction, 10.2 mm in the buccal-lingual direction and 7.7 mm in height),14 was waxed and polished. Then, a matrix (barrier) was made with silicone for the elaboration of the crowns in which ceramic was applied manually (the metal-ceramic and zirconia-ceramic crowns). In addition, the crown and the abutment were scanned using a dental scanner (Cerec® AC; Dentsply Sirona, Behnheim, Germany) for the subsequent milling of the crowns in 5 different materials and the preparation of the metal-ceramic crown, which was fabricated using the conventional method. Six groups were formed according to the material used: feldspathic ceramic (G1); metal-ceramic (VITA VM9; VITA Zahnfabrik, Bad Säckingen, Germany) (G2); hybrid ceramic (Shenzhen Upcera Dental Technology Co. Ltd., Shenzhen, China) (G3); yttria-stabilized tetragonal zirconia polycrystal (Y-TZP) covered with ceramic (VITA VM9; VITA Zahnfabrik) (G4); partially stabilized Y-TZP (inCoris TZI; Dentsply Sirona) (G5); and lithium disilicate (Shenzhen Upcera Dental Technology Co. Ltd.) (G6). Figure 4 shows the crowns fabricated for each group, positioned on the abutments.
Photoelastic test, image acquisition
and data collection
To test the sample of each group, an abutment was installed on the implant and torqued at 25 N. Then, the crown was cemented using resin cement (RelyX™ Ultimate; 3M ESPE, St. Paul, USA) and subjected to a load of 5 kgf for 5 min. Therefore, a new abutment was used for each tested group, as it would be difficult to remove the crown cemented over the abutment. For the photoelasticity test, each sample was placed on a polariscope with circular crossed polarizers (Meadowlark Optics, Inc., Frederick, USA) and 2 occlusal axial load intensities were applied – 100 N (load 1), and 300 N (load 2). The loads were applied in the central pit of each crown, using a hydraulic press coupled with a load cell. Each load was measured with a calibrated load cell (Model 2000; OHAUS Corporation, Pine Brook, USA). Images were obtained for each group, for both applied loads, using a Nikon camera, model D3200 (Tokyo, Japan), which was fixed in the same position (distance and angulation) in relation to the block.
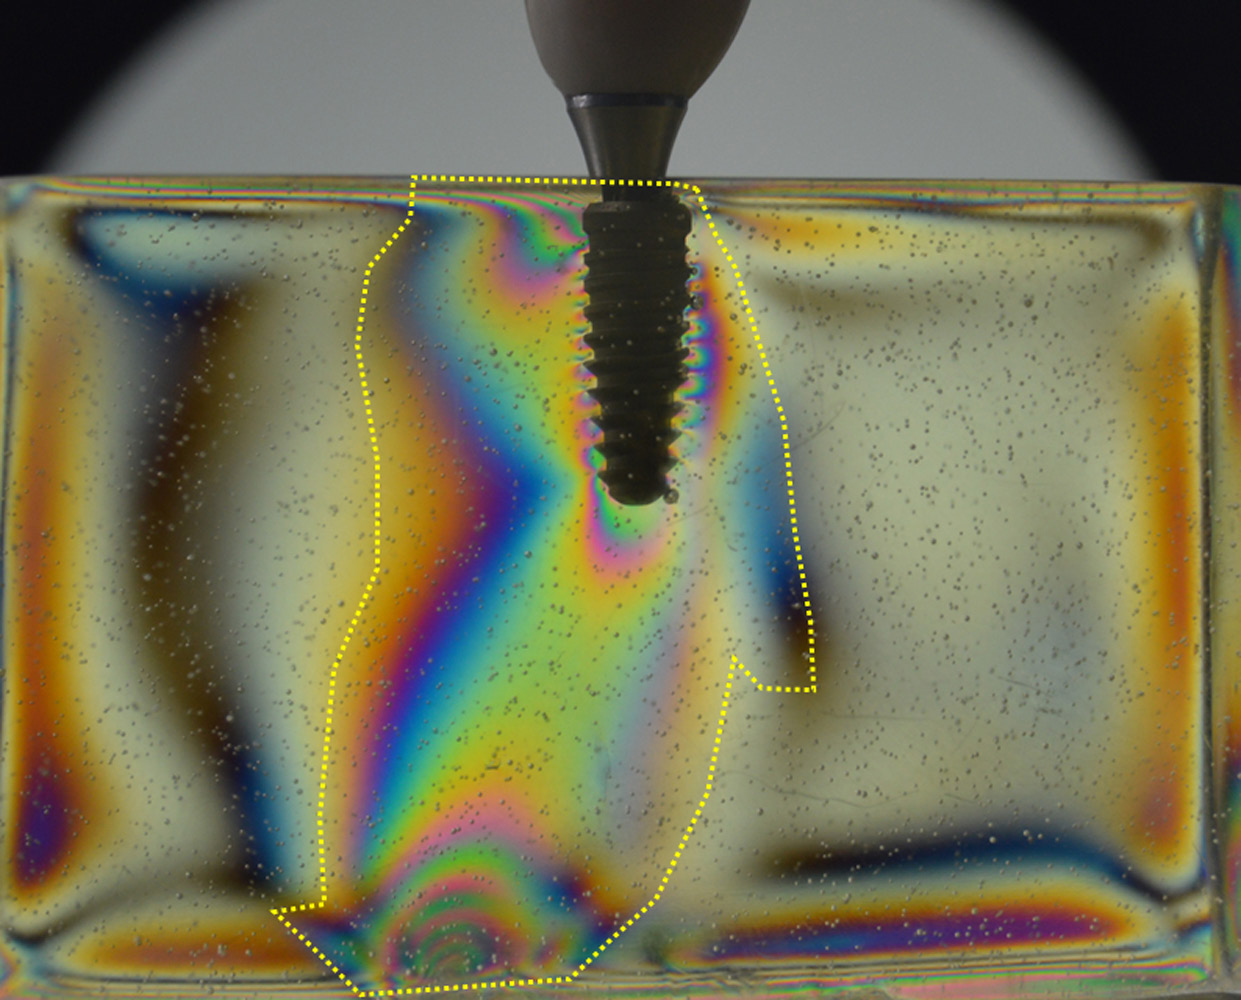
First, the total dissipation area (discounting the implant area, which is equal to 40 mm2) of the applied forces was measured for each load, as shown in Figure 5. The area in each image was measured twice by each author, generating a total of 8 measurements for each image. These measurements were performed using the ImageJ software (National Institutes of Health, Bethesda, USA).
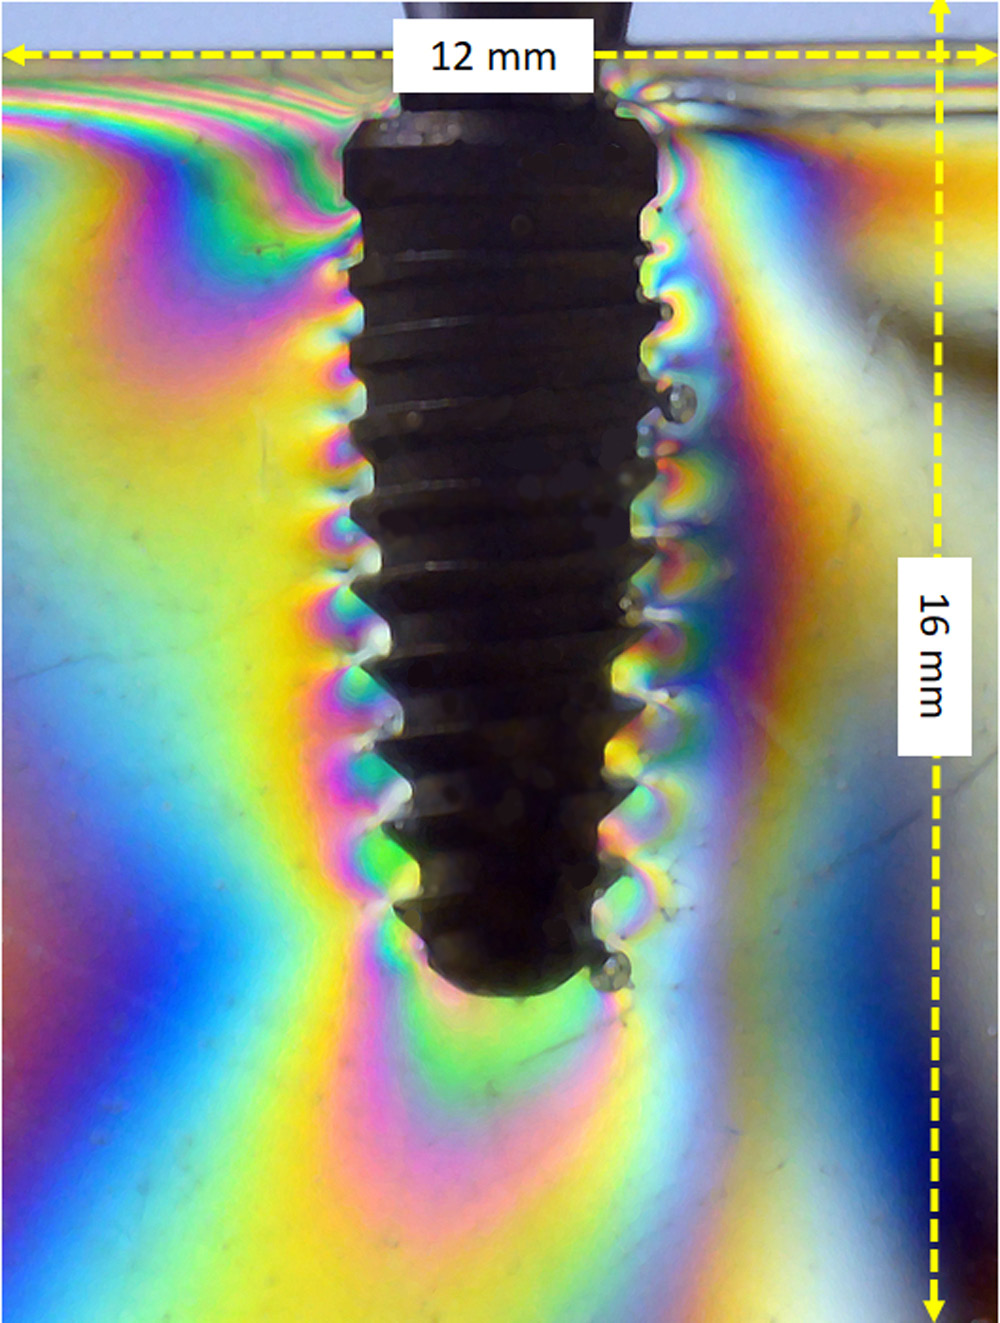
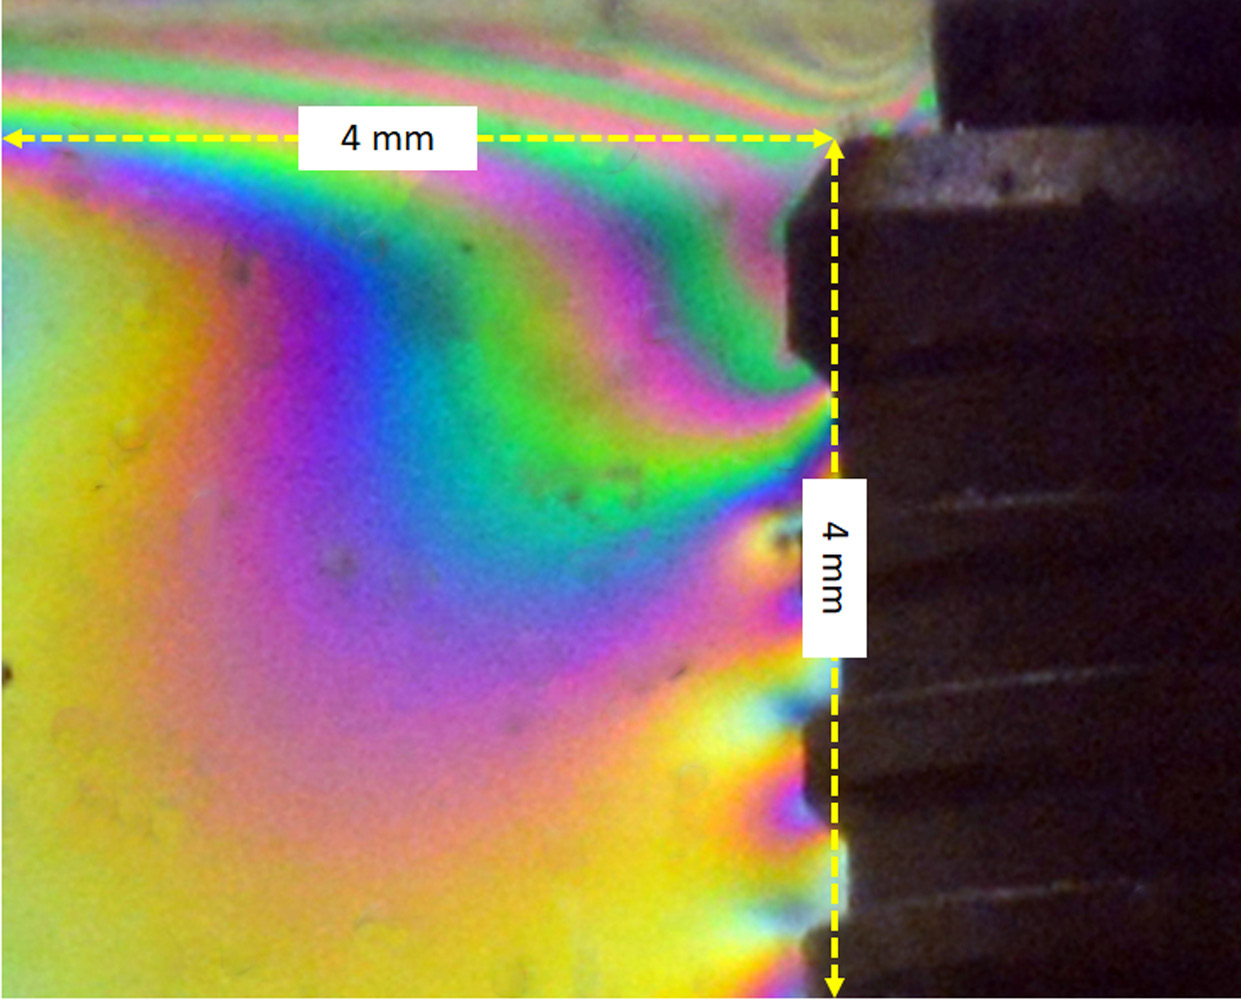
Then, to quantify the fringes in the total images, all images were standardized to 12 mm in width and 16 mm in height, as shown schematically in Figure 6. For the crestal area, the images were standardized to assess cervical loads as follows – from the implant platform to the 3rd thread (4 mm) and at a distance of 4 mm from the implant platform – as shown schematically in Figure 7. A program was developed for the evaluation and quantification of the main colors of the fringes in each image.
Development of a computational program
In order to analyze the distribution of fringes in the images, a Python application was created using the scikit-image processing library.15 The application takes an image, a color and 2 parameters as the input. The color parameters are given as the a* and b* values of a color in the International Commission on Illumination (Commission internationale de l’éclairage – CIE) L*a*b* color space16; the 2 remaining parameters are the lightness parameter λ and the error parameter ε. The input image can be given in the RGB (red, green and blue) color space, but it is then converted to the CIE L*a*b* color space, using the standard illuminant, so that the color variables of each pixel can be analyzed independently of the varying luminosity.
A new monochromatic image of the same proportions as the original one is created and initially consists entirely of black pixels. The application takes each individual pixel, represented by its CIE L*a*b* color space coordinates (L*, a* and b*), of the converted image and checks it against the following conditions (Equation 1 and Equation 2):
where:
L – lightness coordinate of the pixel;
a – a* coordinate of the pixel;
b – b* coordinate of the pixel;
a0, b0 – a* and b* values of the input color in the CIE L*a*b* color space;
λ – lightness parameter;
ε – error parameter.
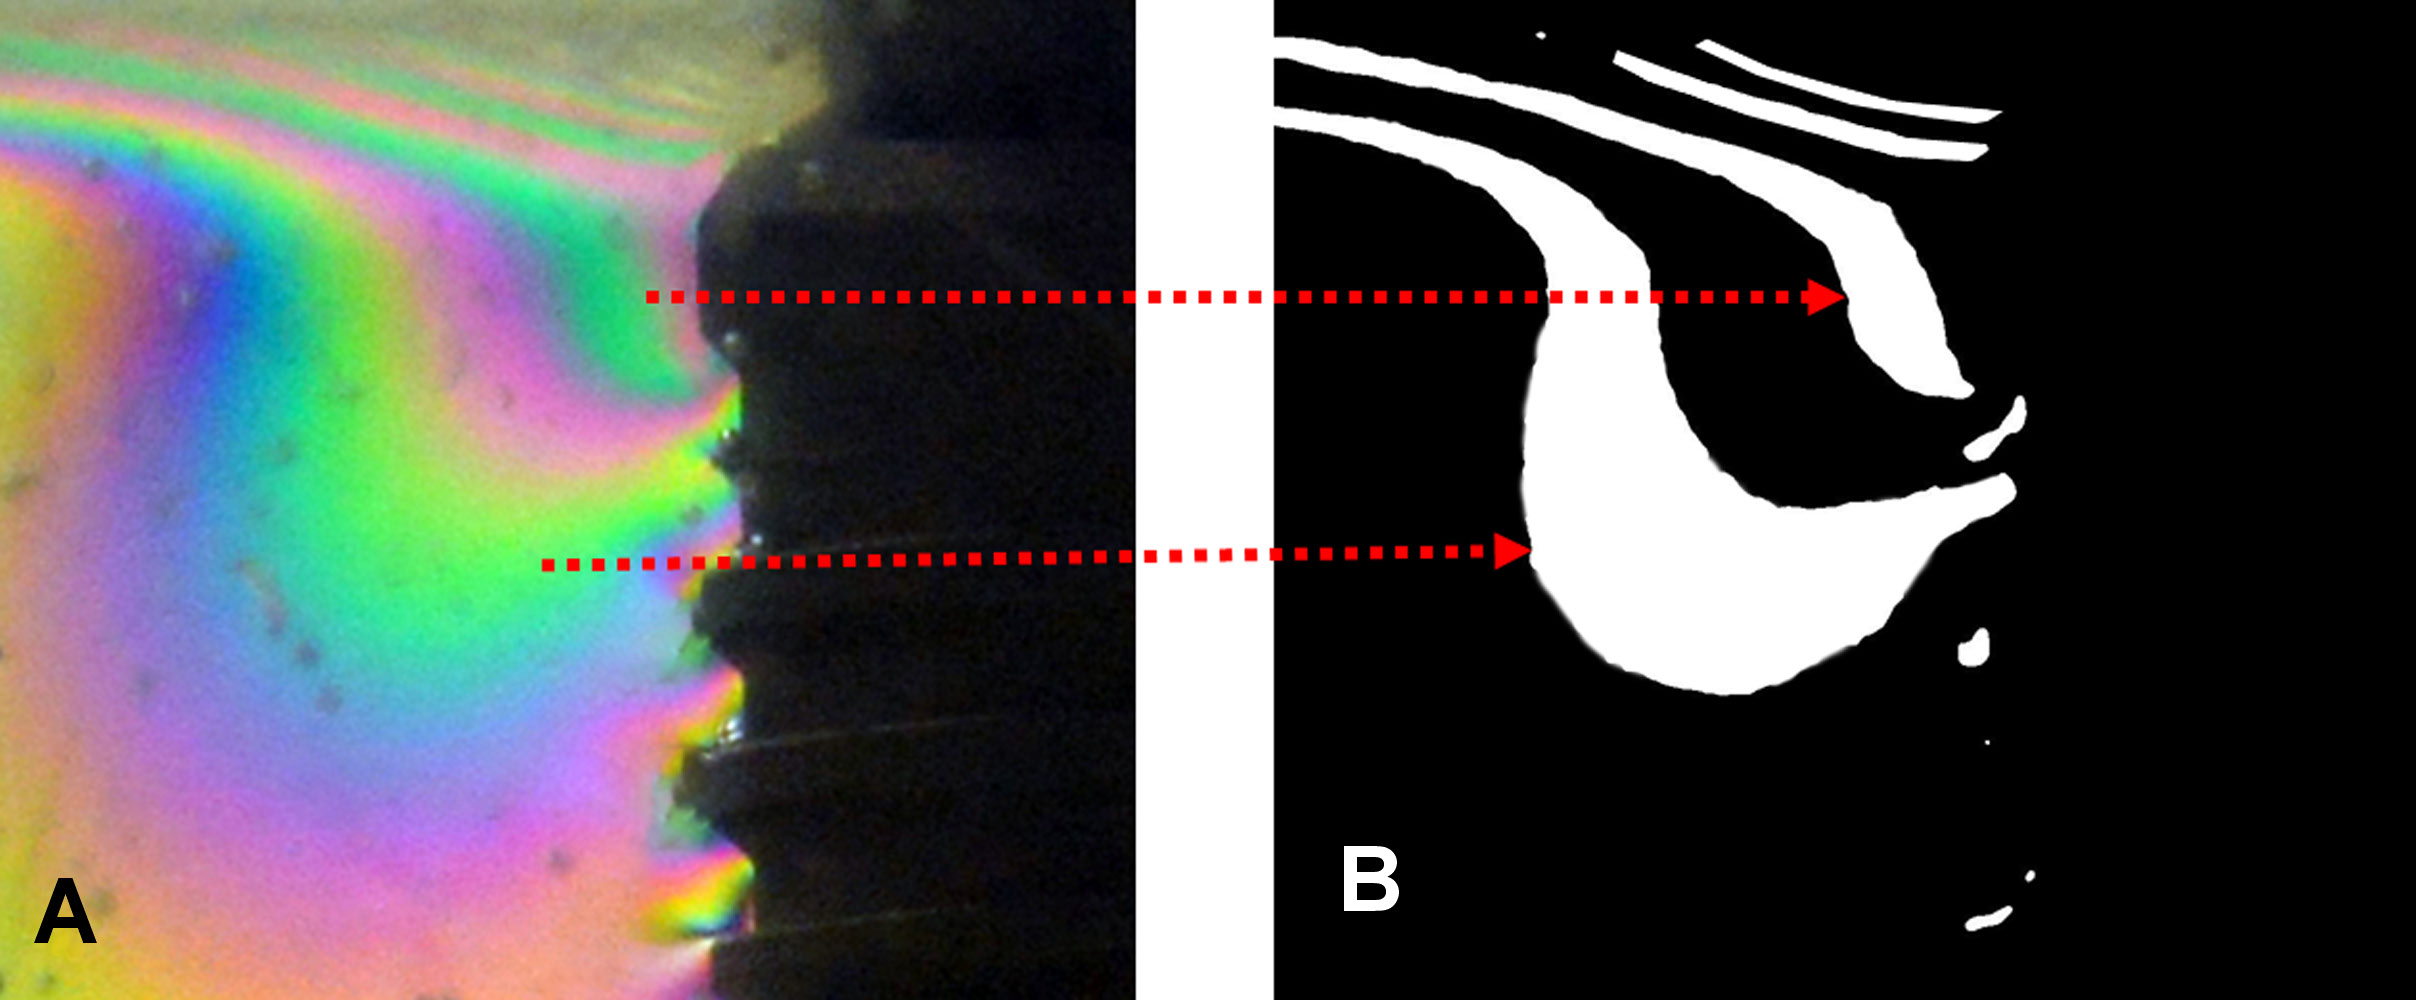
For each pixel of the input image that satisfies the above conditions, the corresponding pixel in the generated monochromatic image becomes white. In this manner, by setting the input colors to a0 = −128;0;0 and b0 = 0;−128;128 for green, blue and yellow, respectively, and setting the lightness and error parameters according to each image, we isolated the green, blue and yellow fringes of each image. An example can be seen in Figure 8.
Next, the white area of each monochromatic image was measured by simply counting the number of white pixels and dividing it by the total number of pixels.
Statistical analysis
The data was compared statistically using the one-way analysis of variance (ANOVA) to verify differences between the 6 groups with regard to the 2 proposed conditions (load 1 and load 2). Pearson’s correlation test was applied to check for the correlation between the measured area of stress dissipation and the number of pixels in each group. A p-value <0.05 was considered statistically significant. All data was analyzed using the GraphPad Prism software, v. 5.01 for Windows (GraphPad Software Inc., San Diego, USA).
Results
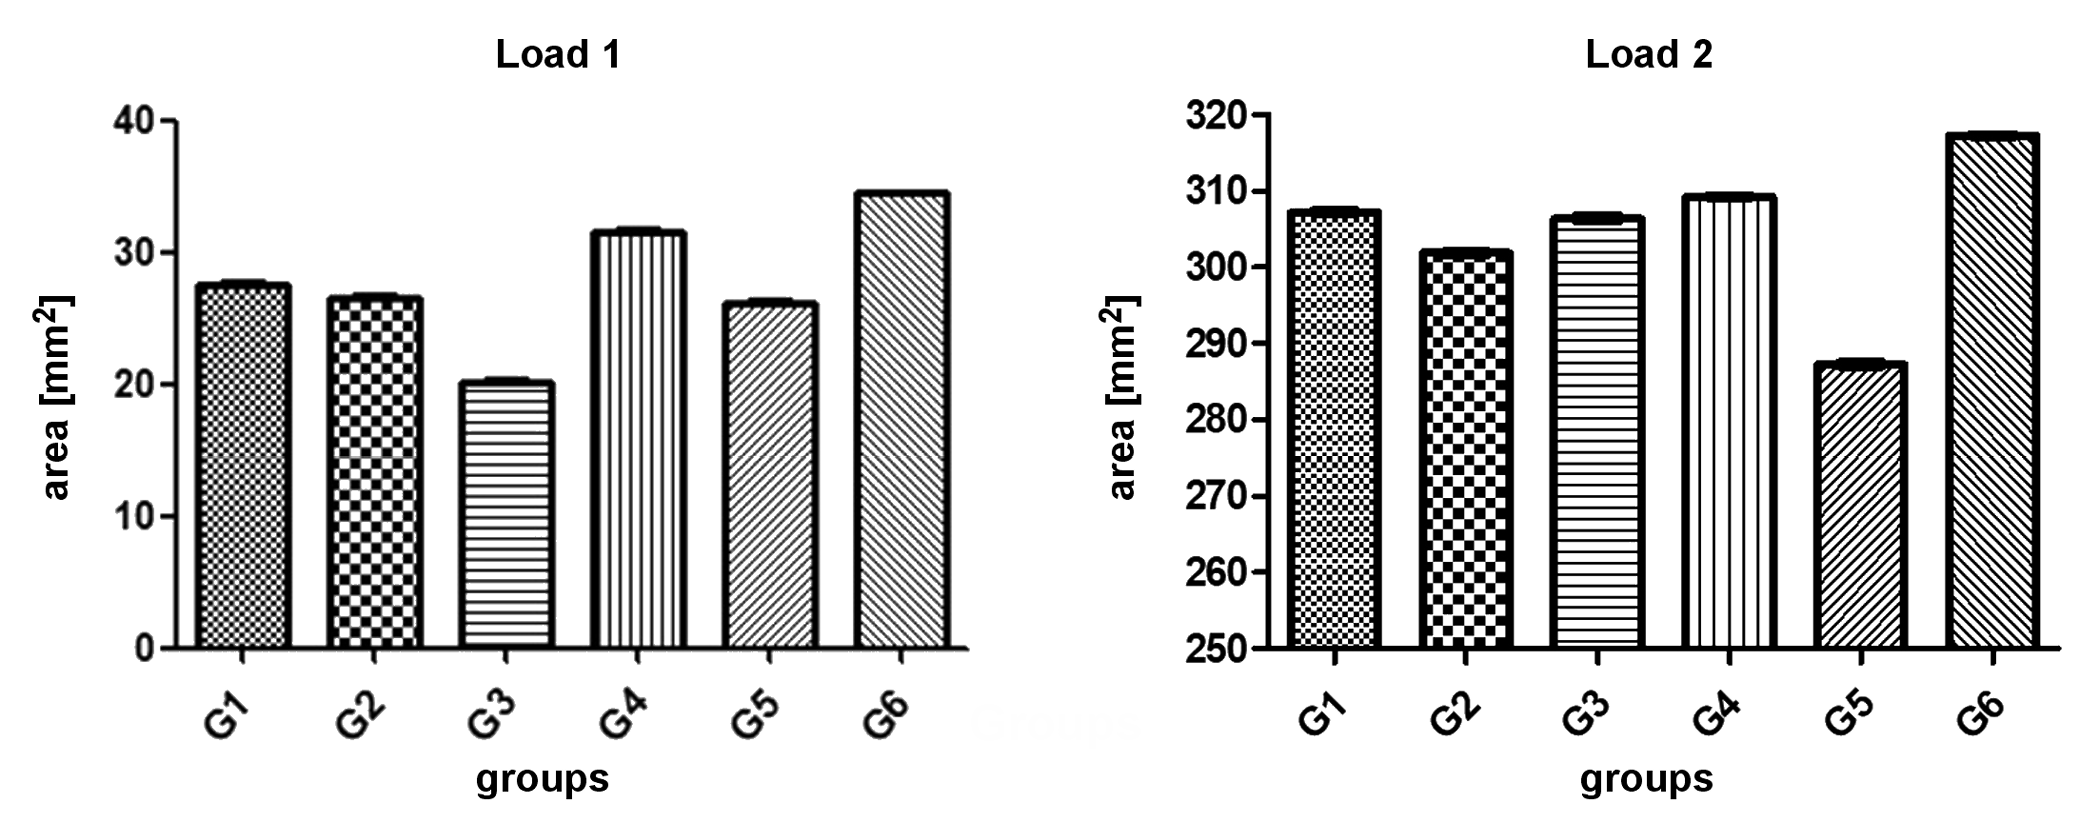
Load distribution in the resin base, which simulates the bone tissue, varied in the 6 groups, showing statistically significant differences between the values with regard to the tested load conditions (p < 0.0001). Under load 1, G3 showed the lowest stress dissipation around the implant, while under load 2, G5 showed the lowest stress dissipation around the implant. The values of the area of stress dissipation for each group are shown in Table 1. Figure 9 graphically shows the data for all groups with regard to the 2 loads.
The variation in the number of pixels measured for the colors was similar to the variation in the area of strain distribution measured for each group. According to the values of strain distribution, measured by counting the number of pixels of the colors in the total images, the sequence of the groups was G6 > G4 > G5 > G1 > G2 > G3 when load 1 was applied, showing a difference of 75.5% between the highest and the lowest values. When load 2 was applied, the sequence was G6 > G4 > G1 > G3 > G2 > G5, showing a 19.8% difference between the highest and the lowest values. In the evaluation of the crestal area, the obtained results were G4 > G5 > G1 > G3 > G2 > G6 when load 1 was applied, showing a 108.9% difference between the highest and the lowest values, and G5 > G1 > G2 > G6 > G4 > G3 when load 2 was applied, showing a difference of 5.6% between the highest and the lowest values. The values for each group are shown in Table 2.
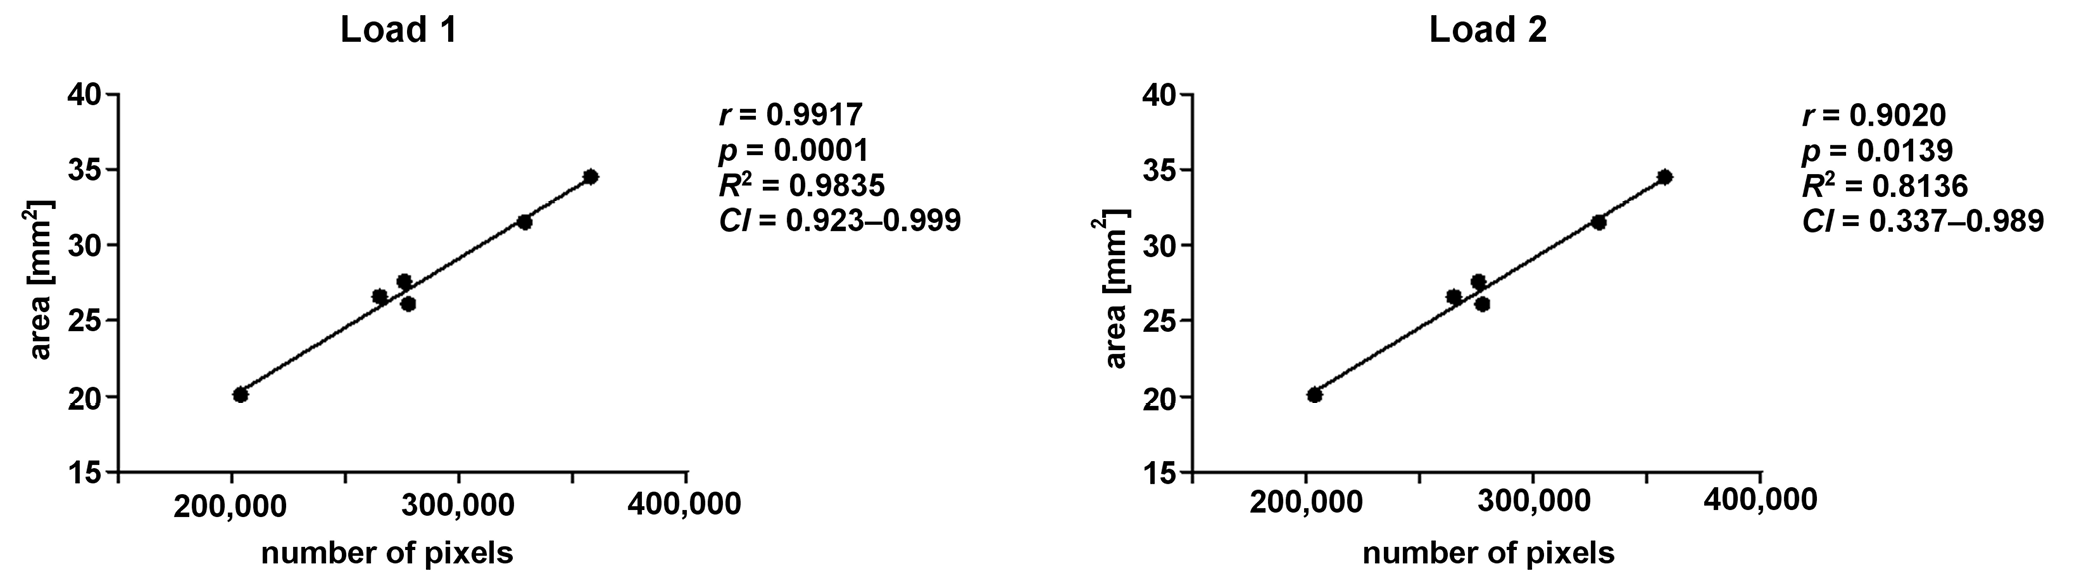
Applying Pearson’s correlation test, a positive correlation was detected between the data for the total area and the total number of pixels (Figure 10).
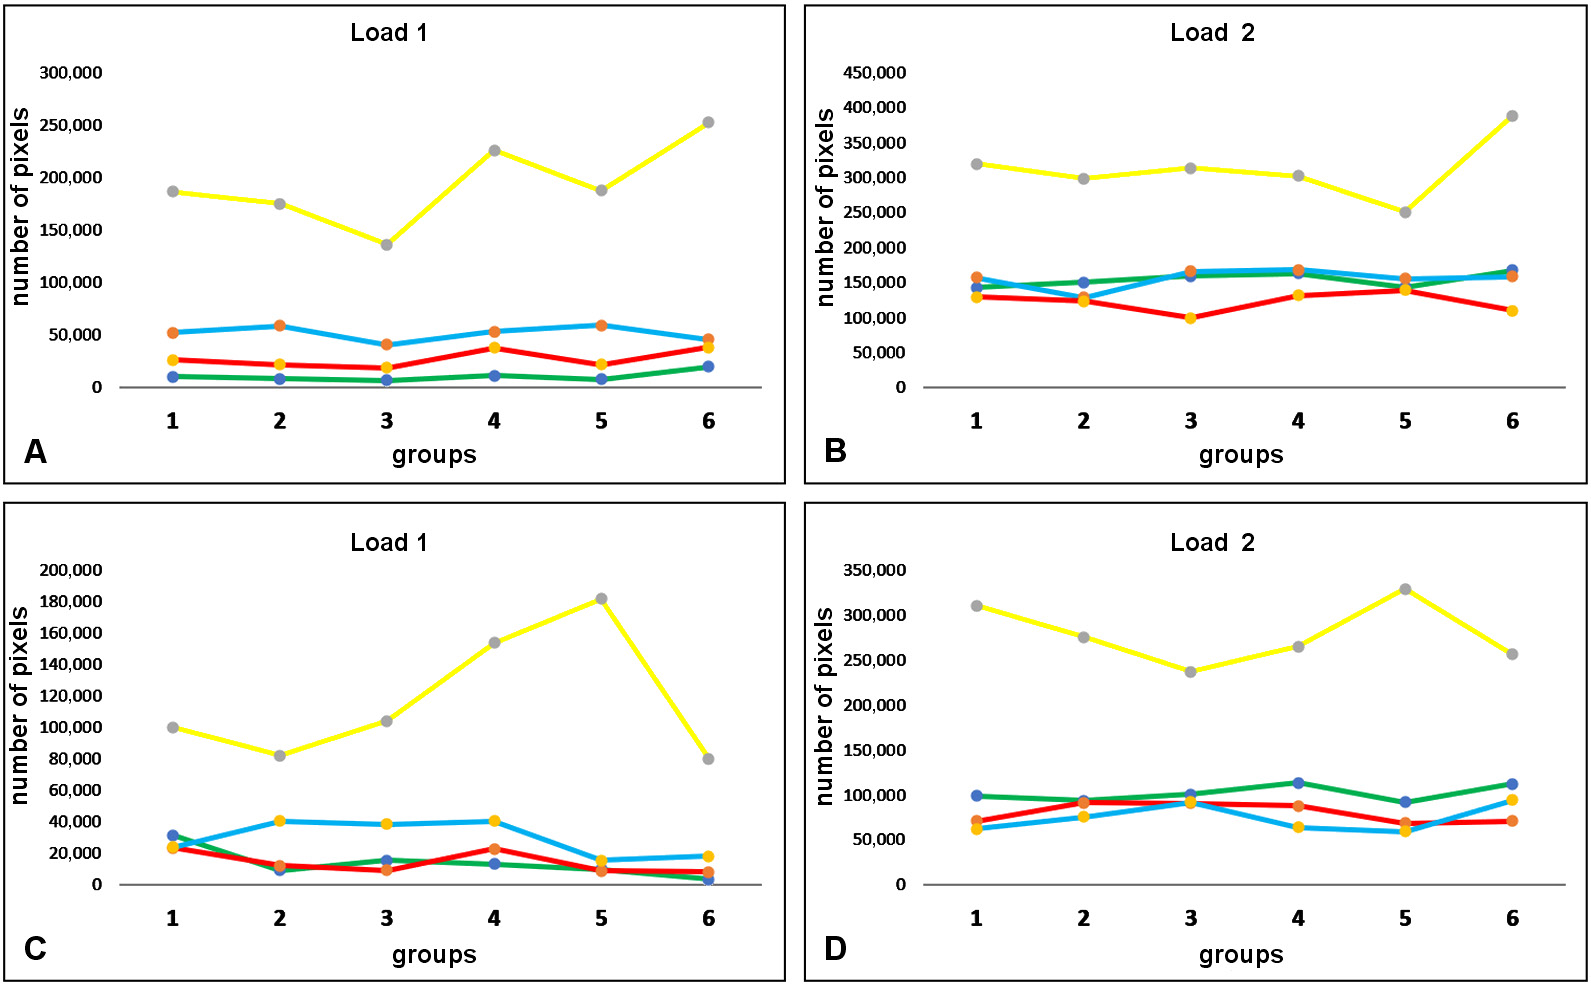
In assessing the number of pixels corresponding to each evaluated color tone, the yellow tone was the one that varied the most between the 2 load intensities in all groups and in both image sizes. Figure 11 shows the distribution of the total number of pixels measured for each color in both image sizes.
Thus, the number of pixels of the yellow tone was determined to assess the variation in strain distribution between the groups. Then, when analyzing the yellow tone, which was the one with the highest number of pixels and the greatest variation, in the total images with load 1, the difference between the highest value (G6) and the lowest value (G3) was 85.3%; for load 2, the difference between the highest value (G6) and the lowest value (G5) was 55.1%. In the evaluation of the crestal area for the yellow tone with load 1 (the highest value – G5 and the lowest value – G6), the difference was 126.4%; for load 2 (the highest value – G5 and the lowest value – G3), it was 38.9%. The number of pixels of the yellow tone was measured for each group for the 2 loads; the data is shown in Table 3.
Discussion
The application of ceramic materials in dental surgery and maxillofacial rehabilitation has increased significantly in recent years, and is receiving great attention from the scientific community.17, 18 The use of metal-free restorations has become popular in modern dentistry, mainly due to the improved cosmetic effect. In that sense, various materials with different chemical and mechanical characteristics have emerged. In the present study, 6 different materials used for the elaboration of single restorations were tested: feldspathic ceramic; metal-ceramic; polymer-filled ceramic; ceramic-stratified zirconia; monolithic zirconia; and lithium disilicate. The results revealed different behaviors in terms of strain distribution in the supporting structures under 2 load intensities applied to the samples. Thus, the initial hypothesis that there would be no important differences in the distribution of strain in the supporting tissues was discarded.
Several studies have shown that the use of conical connection implants (Morse-tapered implants) with switching platforms can contribute to reducing stress around the cervical portion of the implant.19, 20, 21, 22 Additionally, other studies have shown that Morse-tapered implants should be installed at a subcrestal level, which can improve the dissipation of stress in the bone tissue around the implants.23, 24 Therefore, in the present study, we opted for a Morse-tapered connection implant, positioning it at a subcrestal level of 2 mm.
In another finite element analysis study evaluating the influence of different types of cement on the distribution of stress in monolithic zirconia restorations, it was concluded that cements with a lower modulus of elasticity, such as resinous cements, distribute stress better than cements with a higher modulus of elasticity, like zinc phosphate-based cements.25 For this reason, in the present study, a resinous cement was used to cement the crowns. Rungsiyakull et al. compared in a finite element analysis study the pattern of load distribution in parts with different cusp inclinations and at different points of force application, and concluded that both the cusp inclination and the point of force application had a significant influence on the transmission of loads to the supporting structures.26 For this reason, in the present study, the loads were applied in the center of the crown, thus avoiding any possible variation due to differences in the anatomy of some of the cusps between the samples of each group.
Studies have shown contradictory results regarding the transmission of loads toward the supporting tissues by the different restorative materials used for crown manufacture.27, 28, 29, 30 Menini et al. performed a simulation in order to measure the occlusal forces transmitted by different materials to the peri-implant bone tissue and concluded that the use of softer materials, such as resin or acrylic, reduces the forces by up to 70.8% and 95.6%, respectively.27 However, in the present study, only materials for permanent restorations were compared, and the results showed a difference of 75.5% between the highest and the lowest values of the area of strain distribution around the implant with load 1, and 19.8% with load 2. The G6 crowns made of lithium disilicate presented the highest strain values in terms of area and number of pixels of the colors for both applied loads. Other authors compared stress distribution in lithium disilicate ceramic and other ceramic materials, and reported that lithium disilicate ceramic crowns showed higher stress values under vertical loading.31, 32
The loads received by the crown–abutment–implant sets during chewing are dissipated in greater intensity in the first millimeters of the interface between the bone tissue and the implant.33, 34 For this reason, this area has received a lot of attention from the scientific community. The thickness of the cortical bone as well as the quality of this tissue can directly influence the pattern of strain distribution. The cortical bone tissue, as it presents different characteristics and mechanical behavior in comparison with the medullary bone, mainly in terms of modulus of elasticity and viscosity, absorbs a greater amount of strain.35 For this reason, the crestal area of load dissipation in each group was analyzed separately. The results of the evaluation of the crestal images showed a significant difference between the groups, being that for load 1, the highest concentration of strain was observed in G4 (zirconia covered with ceramic), while for load 2, the highest concentration of strain was noted for G5 (the crown made of zirconia – Y-TZP). Corroborating results have been reported in other studies that compared different restorative materials.36
However, in a finite element analysis study, Assunção et al. showed that when combining different materials on the one hand and varying the fit of the restorations on the other, the different hardness of the materials did not affect stress distribution, but it did increase strain on the implant and the screws of the restorations.30 Other authors carried out an in vitro study to evaluate the wear of the tooth enamel produced by monolithic zirconia, lithium disilicate and composite, and reported that the wear produced by zirconia was similar to that produced by composite, but lower than in the case of lithium disilicate.6 Yet another study looked for ceramic materials with the wear values similar to that of human enamel.37 The wear produced by antagonistic teeth on human enamel and on different ceramics was evaluated. The authors concluded that leucite-reinforced glass, lithium disilicate glass and feldspathic porcelain had the wear values closer to that of human enamel as compared to yttria-stabilized zirconia.37
Factors such as implant macrogeometry, prosthesis design, material used, location and position of the implant as well as quantity and quality of the bone tissue directly influence the distribution of stress.38, 39, 40 Strain around the implant depends on the implant–bone interface and is influenced by its biomechanical aspects, such as the modulus of elasticity of the bone, the percentage of bone–implant contact (BIC), the spatial location of BIC, bone density, the degree of bone–implant bonding, etc.41 Thus, strain in the peri-implant bone area is an important factor to be evaluated, as it results in bone stress.42
The photoelasticity test is commonly used in engineering. This type of analysis, which generates fringes with different colors, has been widely used also in dentistry for determining the pattern of stress dissipation in structures that receive loads. However, there is significant variation in the methodologies applied to evaluate the results. In some studies, the fringes were evaluated, in others – the dissipation area, and yet others proposed the development of computer programs for the determination and analysis of the stress dissipation values.19, 33, 43, 44 In the present study, we proposed a new methodology for data evaluation, in which it was possible to find a pattern of stress distribution after load application to determine differences in behavior between the various materials tested. The variation found in the pattern of load distribution around the implant indicated the yellow color as the main element of analysis. However, new studies must be carried out to prove and corroborate these findings.
Limitations
As a limitation of this study, we can report that the loads were applied with an almost quasi-static movement in a single direction, and at only one position of the crown. Another limitation is the fact that resin blocks have the same density throughout the human body; thus, differences between the portions corresponding to the cortical and medullary bones could not be shown. Some differences in the shape and morphology of the crowns, especially those that received the manual addition of ceramics, should also be considered as a limitation of this study. Finally, the use of only one sample could be considered a limitation; however, most photoelasticity studies were conducted in this manner.19, 33, 43
Conclusions
Within the limitations of this study, differences in stress distribution were observed among the 6 materials tested. The greatest values were detected in the crowns made of zirconia and lithium disilicate. In assessing stress dissipation in the crestal region of the implant, the zirconia crowns showed the highest values in comparison with other groups.