Abstract
Background. Peri-implant soft tissue thickness (STT) is considered as an important factor influencing marginal bone stability and esthetic outcomes; however, the effectiveness of different augmentation materials and the impact of augmentation timing remain unclear.
Objectives. The aim of this study was to compare changes in peri-implant SST following augmentation with a subepithelial connective tissue graft (CTG) or a volume-stable collagen matrix (VCMX) vs. non-augmented control sites, and to explore the potential influence of augmentation timing.
Material and methods. In this randomized controlled clinical trial (RCT), 36 patients with 40 implant sites in the esthetic zone were allocated to the CTG (n = 16), VCMX (n = 16) or non-augmented control (n = 8) groups. Within the CTG and VCMX groups, implant sites were further subdivided according to augmentation timing (staged vs. simultaneous), with each subgroup consisting of 8 implant sites. Soft tissue augmentation was performed either prior to implant placement or simultaneously with implant insertion. Soft tissue thickness was assessed using standardized ultrasonographic measurements at baseline (T0), 3 months (T1) and 12 months (T2). Marginal bone loss (MBL) and complications were recorded as secondary outcomes.
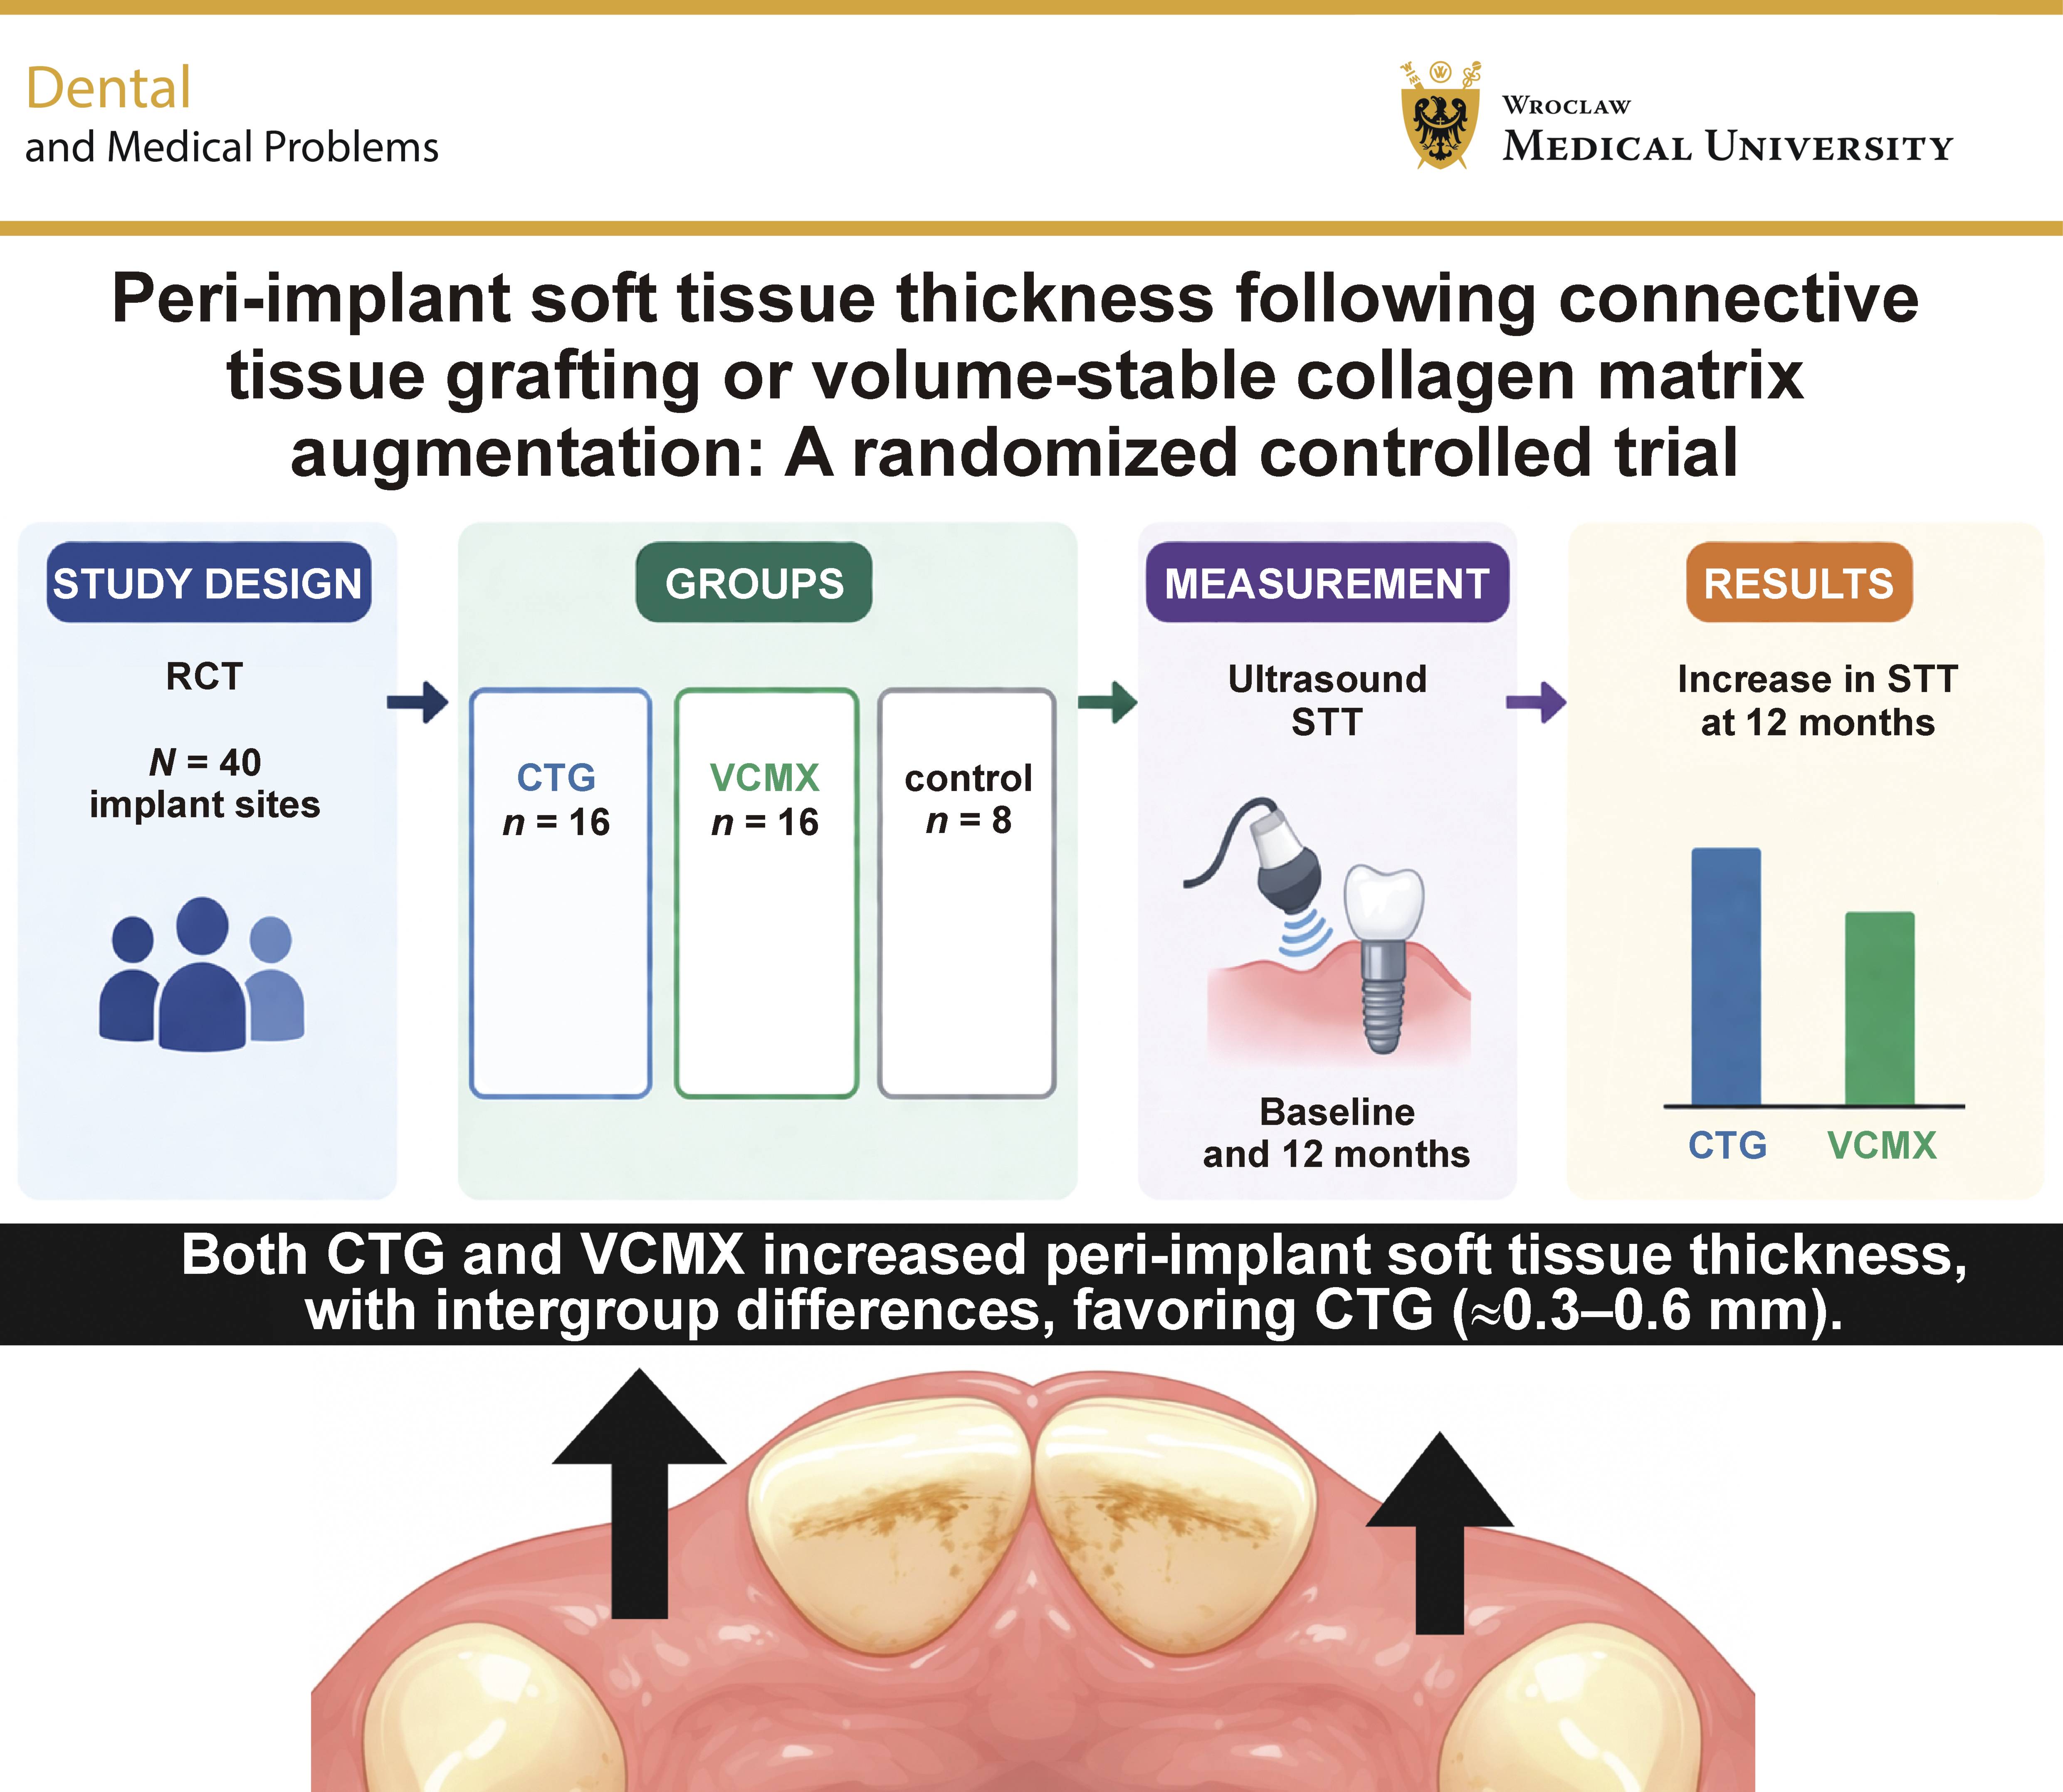
Results. Both augmentation methods resulted in significantly greater SST as compared to non-augmented sites (p < 0.001). At T2, CTGs tended to achieve greater final thickness than the collagen matrix (a difference of 0.3–0.6 mm in the final SST). All augmented sites exceeded 2 mm mucosal thickness. No statistically significant differences related to augmentation timing were detected. Marginal bone loss was low and comparable among the groups, and no biological or technical complications were observed.
Conclusions. Soft tissue augmentation results in clinically relevant and stable increases in peri-implant tissue thickness. Connective tissue grafts tended to provide greater final thickness, whereas the collagen matrix may represent a reliable and less invasive alternative. No statistically significant influence of augmentation timing on the final STT outcomes was detected over 12 months.
Keywords: randomized controlled trial, peri-implant soft tissue, soft tissue augmentation, connective tissue graft, collagen matrix
Introduction
Adequate peri-implant soft tissue dimensions play a crucial role in achieving the long-term stability of dental implants. Proper soft tissue quality facilitates predictable primary wound closure during bone augmentation procedures and supports the maintenance of stable peri-implant tissues over time.1, 2, 3 Moreover, sufficient soft tissue volume is essential for the development of a favorable emergence profile of implant-supported restorations, thereby contributing to satisfactory functional and esthetic treatment outcomes.4, 5
Peri-implant soft tissue thickness (SST) has been identified as a key determinant of crestal bone stability and long-term implant survival,6, 7, 8 as further emphasized in the 2024 Academy of Osseointegration/American Academy of Periodontology (AO/AAP) reports highlighting the clinical relevance of peri-implant soft tissue dimensions and keratinized mucosa.9 Moreover, the most recent 2026 Global Consensus for Clinical Guidelines (GCCG) initiatives have identified marginal bone loss (MBL) and peri-implant tissue conditions as core outcome domains in implant dentistry.10 In particular, insufficient peri-implant mucosal dimensions have been associated with increased plaque accumulation, inflammation and MBL.11 Evidence indicates that a mucosal thickness below 2 mm predisposes implant sites to additional crestal bone remodeling during the re-establishment of peri-implant biological width, potentially compromising implant longevity.12 Furthermore, reduced peri-implant SST has been linked to an increased risk of biological complications.13, 14
Consequently, interventions aimed at augmenting peri-implant mucosal thickness at the sites presenting with a thin soft tissue phenotype are indicated to optimize esthetic outcomes and maintain peri-implant health. Recent evidence also shows that hard and/or soft tissue grafting associated with immediate implant placement may help reduce peri-implant tissue loss, and improve mid-facial mucosa stability and facial bone thickness.15
Autogenous soft tissue grafting
Current scientific evidence supports the use of autogenous subepithelial connective tissue grafts (CTGs) as the grafting material of choice for peri-implant mucosal thickness augmentation. Connective tissue grafts are still considered the reference standard for peri-implant soft tissue augmentation due to their predictable clinical performance and long-term stability.12 Various surgical techniques employing CTG have been described, enabling reliable increases in soft tissue volume and favorable peri-implant tissue outcomes.
Despite their effectiveness, autogenous grafting procedures are associated with increased surgical complexity, donor-site morbidity and postoperative discomfort. Therefore, the selection of a soft tissue augmentation approach should balance the expected clinical benefits against patient-related morbidity, particularly in cases requiring multiple or staged surgical interventions.
Biomaterials as soft tissue substitutes
To improve peri-implant soft tissue conditions, various biomaterials have been introduced as alternatives to autogenous grafts. These biomaterials can be broadly classified according to their origin into allogeneic, xenogeneic and synthetic soft tissue substitutes. Among these categories, xenogeneic collagen-based matrices represent the most extensively investigated group of soft tissue substitutes in implant dentistry.16
Collagen matrices are designed to provide a three-dimensional (3D) scaffold supporting soft tissue integration and early volume stabilization while reducing surgical invasiveness and patient morbidity. Depending on their structural characteristics, collagen matrices may be further distinguished into native (non-cross-linked) matrices and cross-linked, volume-stable matrices, which differ in degradation behavior, mechanical properties and the capacity to maintain soft tissue volume over time.17, 18
Although collagen-based substitutes can achieve satisfactory clinical outcomes, the magnitude of soft tissue volume gain is generally lower as compared to subepithelial CTGs.2, 19, 20 Moreover, substantial heterogeneity exists among the available studies with respect to surgical protocols, follow-up periods, outcome definitions, and the methods used for SST assessment, limiting data comparability and evidence-based interpretation.
Timing of soft tissue augmentation in implant therapy
In addition to the choice of the augmentation material, the timing of soft tissue augmentation in relation to implant placement represents a critical clinical decision. Soft tissue augmentation may be performed either prior to implant placement as a staged procedure or simultaneously with implant insertion. Both approaches are commonly applied in clinical practice; however, their potential influence on peri-implant SST and long-term tissue stability has not been consistently clarified.
The available studies addressing the timing of soft tissue augmentation are characterized by substantial heterogeneity with respect to the study design, surgical protocols and outcome assessment methods. This lack of direct comparative clinical evidence represents an important gap in the current literature.
Aim of the study
The primary aim of this randomized controlled clinical trial (RCT) was to evaluate changes in peri-implant SST following augmentation with either a subepithelial CTG or a volume-stable collagen matrix (VCMX) (Fibro-Gide®), in comparison with non-augmented control sites, in the esthetic zone.
A secondary, exploratory aim was to assess the influence of augmentation timing. Additionally, the relationship between SST and MBL over a 12-month follow-up period was investigated.
Material and methods
Study design
This study was designed as a prospective, investigator-initiated RCT, conducted to evaluate the influence of the soft tissue augmentation material and to explore the potential influence of augmentation timing on peri-implant soft and hard tissue outcomes in the esthetic zone. The trial compared the peri-implant soft tissue augmentation performed using an autogenous subepithelial CTG or VCMX with non-augmented control sites.
The study protocol was reviewed and approved by the Bioethics Committee at Wroclaw Medical University, Poland (approval No. KB-863/2021; October 28, 2021), and the trial was conducted in accordance with the principles of the Declaration of Helsinki and the Good Clinical Practice guidelines. All participants were informed about the nature and objectives of the study, and provided written informed consent prior to enrollment. Patients were not involved in the design, conduct or reporting of the study. The trial was registered at ClinicalTrials.gov (NCT07324187).
Study population and eligibility criteria
Patients requiring single-tooth implant rehabilitation in the esthetic zone (incisors, canines or premolars) of the maxilla or the mandible were consecutively screened for eligibility. Adult patients aged 18–60 years, presenting with single-tooth edentulism or bilateral two-tooth edentulism in separate quadrants, with natural teeth adjacent to each implant site, were eligible for inclusion.
Eligible implant sites were required to present a minimum buccolingual bone width of 6.0 mm, as assessed by cone-beam computed tomography (CBCT), a baseline SST between 0.5 and 2.5 mm, and a minimum height of keratinized tissue of 2.0 mm. Adequate oral hygiene was mandatory and was defined as an approximal plaque index (API) below 25%.
Exclusion criteria included local and systemic conditions that could interfere with soft or hard tissue healing. Local exclusion criteria comprised previous bone augmentation at the intended implant site, severe periodontal disease, bruxism, and smoking. Systemic exclusion criteria included uncontrolled diabetes mellitus, metabolic disorders, a history of head and neck radiotherapy, previous bisphosphonate therapy, bleeding disorders, and other systemic conditions known to impair wound healing.
Patients presenting with a tooth at the intended implant site were eligible only after tooth extraction followed by unassisted socket healing for a minimum of 4 months. No ridge preservation or bone augmentation procedures were performed at extraction sites. Final eligibility was confirmed by CBCT after healing to ensure that baseline bone conditions reflected natural post-extraction healing.
A total of 36 patients fulfilling all eligibility criteria were enrolled. Overall, 40 dental implants were placed, as 4 patients received implants at 2 separate sites; in these cases, implants were located in different quadrants or in the opposing jaws, and were never placed adjacent to each other. Each implant site was therefore treated as an independent experimental unit for statistical analysis.
Randomization and study groups
After the confirmation of eligibility, implant sites were randomly allocated to one of 3 study groups according to the type of soft tissue augmentation protocol. Randomization was performed prior to the surgical intervention, using sealed, opaque allocation cards prepared by a team member not involved in patient recruitment or treatment, ensuring allocation concealment.
Based on the augmentation material, implant sites were assigned to one of the following groups: group G1 (CTG group), in which peri-implant soft tissue augmentation was performed using an autogenous subepithelial CTG (n = 16 implant sites); group G2 (VCMX group), in which peri-implant soft tissue augmentation was performed using VCMX (Fibro-Gide; Geistlich Pharma AG (Wolhusen, Switzerland) (n = 16 implant sites); and group G3 (control group), in which implants were placed without soft tissue augmentation (n = 8 implant sites).
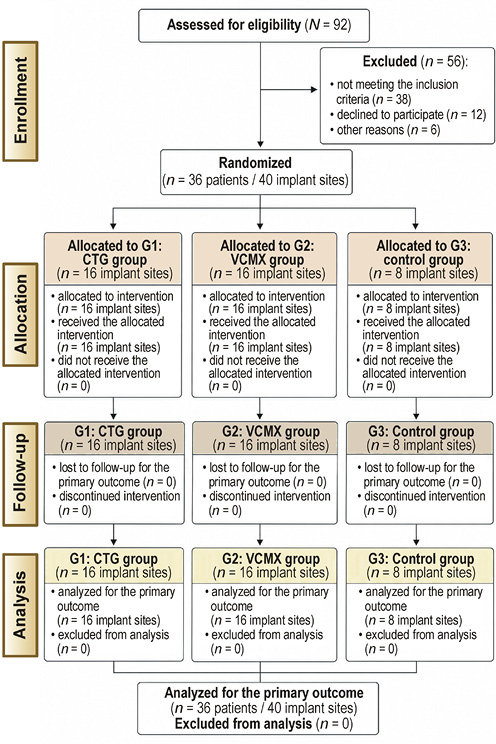
Within G1 and G2, implant sites were further allocated according to the timing of soft tissue augmentation. In the two-stage protocol, soft tissue augmentation was performed 3 months prior to implant placement (G1A and G2A; n = 8 implant sites per augmentation material), whereas in the one-stage protocol, soft tissue augmentation was performed simultaneously with implant insertion (G1B and G2B; n = 8 implant sites per augmentation material). This was a three-arm, parallel, exploratory RCT with a 2:2:1 allocation ratio, applied to increase the number of observations in the intervention groups, while maintaining a reference control group (Figure 1). This approach was consistent with the exploratory design of the study, with a focus on effect size estimation within the intervention groups rather than confirmatory comparisons with the control group.
Surgical and prosthetic procedures
Due to the nature of surgical interventions, neither participants nor operators were blinded to group allocation. All surgical and prosthetic procedures were performed by the same experienced clinician to ensure procedural consistency throughout the study.
Soft tissue augmentation procedures
Depending on group allocation, peri-implant soft tissue augmentation was performed using either an autogenous subepithelial CTG or VCMX.
In the CTG groups, subepithelial CTGs were harvested from the palatal donor site, using a standardized surgical technique. After de-epithelialization, the grafts were adapted to the recipient site and fully covered by the repositioned mucosal flap.
In the VCMX groups, the Fibro-Gide VCMX with a standardized thickness of 3 mm was trimmed to fit the recipient site and placed according to the manufacturer’s recommendations. The matrix was completely covered by the mucosal flap to allow submerged healing.
In the two-stage protocol, soft tissue augmentation was performed as a standalone procedure 3 months prior to implant placement. In the one-stage protocol, soft tissue augmentation and implant placement were performed simultaneously during the same surgical session.
Implant placement
Implant placement was performed following prosthetically driven planning, using a standardized crestal incision along the edentulous ridge in all study groups. Implant positioning was guided by a surgical template (Simplant®; Dentsply Sirona, Charlotte, USA) to ensure prosthetically driven 3D implant placement. All implants were placed at the crestal level or up to a maximum of 0.5 mm subcrestally relative to the buccal bone plate, under direct visual control.
A minimally invasive flap approach was applied at sites without soft tissue augmentation, allowing implant insertion and submerged healing. At the sites allocated to simultaneous soft tissue augmentation (the one-stage protocol), implant placement was combined with a split-thickness flap preparation on the buccal aspect to enable the insertion of the CTG or VCMX, and to allow the complete coverage of the augmented area.
All implants were placed according to the manufacturer’s surgical guidelines, using the same implant system (Astra Tech Implant System EV; Dentsply Sirona). Implants with diameters of 3.6 mm and 4.2 mm and lengths ranging from 8 to 11 mm were used, selected according to site-specific anatomical conditions.
All implants were placed using the submerged healing protocol. After a healing period of 3 months, the implants were surgically uncovered and standard healing abutments were placed for soft tissue conditioning.
Prosthetic rehabilitation
Following soft tissue conditioning, definitive prosthetic rehabilitation was performed. Implant positions were recorded using the digital impressions obtained with an intraoral scanner (Primescan®; Dentsply Sirona), and customized abutments were fabricated (Atlantis®; Dentsply Sirona).
The final restorations consisted of single-unit full-contour zirconia (ZrO2) crowns with individualized characterization, which were screw-retained on the customized abutments. All restorations were delivered according to standard clinical protocols to ensure the appropriate occlusion, emergence profile and esthetic integration.
All surgical and prosthetic procedures were performed by a single clinician who was also involved in the study design, to ensure procedural consistency and reduce operator-related variability, in accordance with a standardized study protocol.
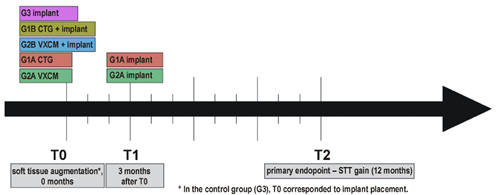
Figure 2 presents the study timeline for all groups.
Outcome measures
The primary and secondary outcome measures were defined a priori, while the analyses related to augmentation timing were considered exploratory. Ultrasonographic and radiographic assessments were performed by an independent examiner who was blinded to group allocation and the type of augmentation material used.
Primary outcome
The primary outcome of the study was peri-implant STT in the esthetic zone. Soft tissue thickness was assessed longitudinally, using a standardized, non-invasive ultrasonic measurement protocol, and served as the main parameter for evaluating the effects of the augmentation material and the potential influence of augmentation timing.
Primary outcome analyses included the absolute STT values at the 12-month follow-up, as well as changes in STT over time relative to baseline.
Secondary outcomes
The secondary outcomes of the study included the following: MBL around the dental implants, assessed radiographically over the observation period; implant survival, defined as the presence of clinically functional implants throughout follow-up; and biological complications, including peri-implant mucositis and peri-implantitis, diagnosed according to the established clinical and radiographic criteria. In addition, prosthetic complications, including the abutment- or crown-related technical events occurring during the follow-up period, were recorded. Implant stability was assessed using the resonance frequency analysis (RFA). The implant stability quotient (ISQ) values were recorded at implant placement and prior to the delivery of the definitive prosthetic restoration, using a handheld RFA device.
Soft tissue thickness measurements
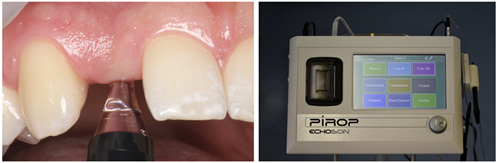
Peri-implant STT was assessed using a standardized, non-invasive ultrasonic measurement method and served as the primary outcome of the study. All longitudinal STT measurements were performed using an ultrasonic device (Pirop®; Echo-Son, Puławy, Poland) according to the manufacturer’s instructions.
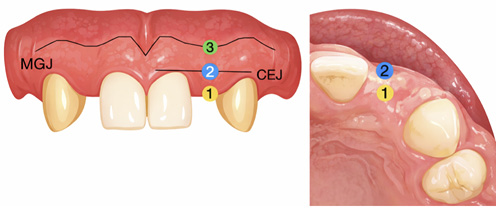
Soft tissue thickness was assessed at 3 predefined measurement points along the implant axis. The crestal measurement point (P1) was located at the crest of the alveolar ridge, corresponding to the future implant emergence profile. This point was accessible only during surgical procedures, and was therefore assessed exclusively at baseline (T0) and during the pre-prosthetic phase (T1). Longitudinal analyses focused on 2 buccal measurement points that remained accessible throughout the entire observation period. Measurement point P2 was positioned buccally at the midline connecting the cementoenamel junctions (CEJs) of the adjacent teeth, along the implant axis. Measurement point P3 was located buccally at the mucogingival junction (MGJ), along the same axis. These 2 points were used for all longitudinal STT analyses (Figure 3).
Soft tissue thickness was measured at baseline (T0), at 3 months (T1) and at the 12-month follow-up (T2), which represented the primary endpoint of the study. In the augmentation groups, baseline (T0) corresponded to the time of soft tissue augmentation, performed either as a standalone procedure in the two-stage protocol or simultaneously with implant placement in the one-stage protocol. In the control group, implant placement served as baseline (T0).
Longitudinal changes in SST were calculated relative to baseline (T0) for each implant site, allowing the evaluation of within-site STT changes over time according to the assigned treatment pathway.
The ultrasonic measurement method used in the present study has previously been validated against direct measurements performed after the crestal incision and against the clinical measurements obtained using a millimeter-scaled periodontal probe.21 Prior to the study, the examiner underwent calibration for the ultrasonic measurement protocol to ensure measurement consistency (Figure 4).
Radiographic assessment of marginal bone loss
Radiographic evaluation was performed to assess MBL around the dental implants. Standardized intraoral periapical radiographs were obtained using the long-cone paralleling technique with individualized positioning devices to ensure reproducible imaging conditions.
Baseline radiographs were acquired immediately after implant placement and served as the reference for the subsequent measurements. Follow-up radiographs were obtained at the 12-month evaluation. Marginal bone loss was defined as the vertical change in the crestal bone level between baseline and the 12-month follow-up.
Radiographic images were calibrated using the known length of the implant fixture. Measurements were performed using dedicated imaging software, and the vertical distance from the implant shoulder to the first bone-to-implant contact was recorded on both the mesial and distal aspects of each implant. The mean of the mesial and distal measurements was calculated and used for statistical analysis.
Handling of correlated data
In patients receiving 2 implants, implant sites were treated as separate experimental units. To account for within-patient dependency, the applied non-parametric repeated-measures models incorporated subject-level clustering, using resampling-based procedures. This approach explicitly accounts for clustering at the subject level and allows valid statistical inference without assuming independence of observations.
Statistical analysis
No formal a priori sample size calculation was performed. The sample size was determined pragmatically based on feasibility. The present study should therefore be considered exploratory with respect to effect size estimation, in line with recent methodological recommendations emphasizing transparent reporting and interpretation of effect sizes and sample size considerations in dental research.22 Although designed as an RCT, the study should be interpreted as exploratory due to the absence of a formal sample size calculation, and the findings should therefore be interpreted as hypothesis-generating rather than confirmatory.
No missing data was observed for the presented outcomes. Statistical analyses were performed at the implant site level. In patients receiving 2 implants, implant sites were treated as separate experimental units, and within-subject dependency was accounted for in the applied statistical models using a resampling-based non-parametric approach (MANOVA.RM).
Due to non-normal data distribution and small subgroup sizes, non-parametric statistical methods were applied. Quantitative variables are presented as medians (Me) with interquartile ranges (IQR) (Q1–Q3), and categorical variables as frequencies and percentages.
Longitudinal changes in peri-implant STT were analyzed using a non-parametric repeated-measures analysis based on ANOVA-type statistics (ATS), evaluating the associations between the treatment group, time, and their interaction. In addition, a multivariate non-parametric repeated-measures analysis for combined STT measurements at points P2 and P3 was performed using a resampling-based modified ANOVA-type statistic (MATS) with wild bootstrap inference.
Post hoc between-group and within-group comparisons were performed using the Wilcoxon rank-sum test and the Wilcoxon signed-rank test, respectively, with the Benjamini–Hochberg correction applied to control the false discovery rate.
Marginal bone loss was compared between the groups using the Kruskal–Wallis test.
All statistical tests were two-tailed, and the level of statistical significance was set at p < 0.05. All analyses were conducted using the R statistical computing environment (R Foundation for Statistical Computing, Vienna, Austria).
Results
Study population
A total of 36 patients (40 implant sites) were included in the final analysis. Patient recruitment, allocation, follow-up, and analysis are presented in the CONSORT (Consolidated Standards of Reporting Trials) flow diagram (Figure 1). No patients or implant sites were lost to follow-up during the 12-month observation period. Patient recruitment was conducted between April 2022 and October 2024. The last follow-up visit of the final enrolled patient took place in October 2025. The trial was completed as planned after the recruitment of the predefined number of implant sites, with no premature termination. Implant sites were allocated to 3 study groups: G1 (CTG; n = 16); G2 (VCMX; n = 16); and G3 (control; n = 8). In patients receiving 2 implants, implant sites were located in different quadrants or the opposing jaws, and were treated as independent experimental units.
Baseline demographic characteristics are summarized in Table 1. The analysis was conducted at the implant-site level (n = 40). The median age of the study population was 35 (IQR: 31.75–45.25) years, with comparable distribution across the groups.
Primary outcome – peri-implant soft tissue thickness (STT)
At 12 months, the absolute difference in STT between the CTG and VCMX groups ranged from approx. 0.3 to 0.6 mm.
Subgroup analysis of STT at the crestal point (P1)
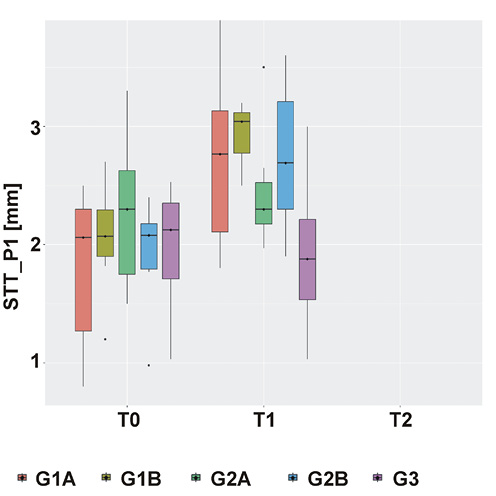
At the crestal measurement point (P1), peri-implant STT was assessed exclusively during the pre-prosthetic period, at baseline (T0) and at the 3-month follow-up (T1). The non-parametric repeated-measures analysis demonstrated a statistically significant main effect of time (p < 0.001) and a significant time × group interaction (p < 0.001), whereas the main effect of group was not statistically significant (p = 0.27).
At baseline (T0), no statistically significant differences in crestal STT were observed between the study subgroups, indicating comparable baseline conditions. The median STT values at T0 were 2.06 (1.17–2.30) mm in G1A, 2.07 (1.82–2.36) mm in G1B, 2.30 (1.50–2.75) mm in G2A, 2.08 (1.79–2.19) mm in G2B, and 2.13 (1.64–2.40) mm in the control group (G3). Post hoc analyses confirmed the absence of statistically significant between-group differences at baseline.
At the pre-prosthetic follow-up (T1), increases in STT were observed in all augmentation subgroups (G1A, G1B, G2A, and G2B), whereas no increase was observed in the control group (G3). The median STT increased from 2.06 (1.17–2.30) mm to 2.77 (2.05–3.14) mm in the two-stage CTG subgroup (G1A), from 2.07 (1.82–2.36) mm to 3.04 (2.75–3.13) mm in the one-stage CTG subgroup (G1B), and from 2.08 (1.79–2.19) mm to 2.69 (2.20–3.26) mm in the one-stage VCMX subgroup (G2B). In contrast, the median STT in the two-stage VCMX subgroup (G2A) remained unchanged (2.30 (1.50–2.75) mm at T0 vs. 2.30 (2.09–2.65) mm at T1), while a slight numerical decrease was observed in the control group (from 2.13 (1.64–2.40) mm to 1.88 (1.49–2.31) mm) (Figure 5).
After adjustment for multiple testing, a statistically significant between-group difference at T1 was identified exclusively between the one-stage CTG subgroup (G1B) and the control group (G3). Within-group post hoc analyses demonstrated statistically significant increases in STT from T0 to T1 in both CTG subgroups and in the one-stage VCMX (G2B) subgroup, whereas changes in the two-stage VCMX subgroup (G2A) and in the control group (G3) were not statistically significant (Table 2).
Longitudinal STT analysis at measurement points P2 and P3 (primary endpoint)
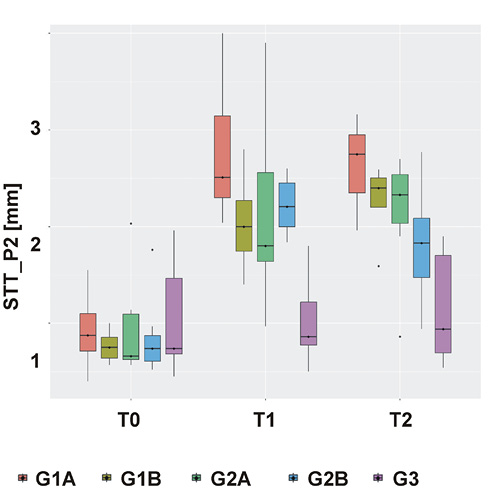
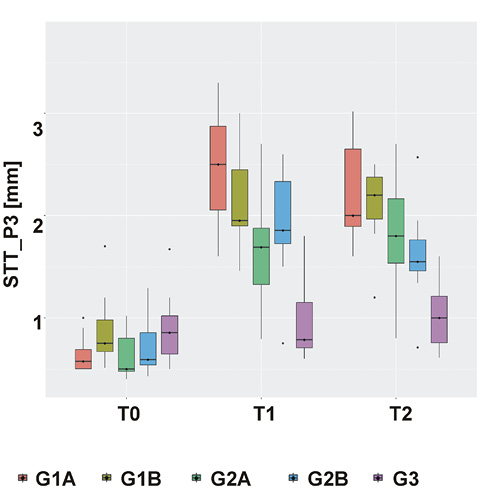
At measurement points P2 and P3, peri-implant STT was assessed longitudinally at baseline (T0), at 3 months (T1) and at the 12-month follow-up (T2). A multivariate non-parametric repeated-measures analysis demonstrated statistically significant main effects of time and group, as well as a significant time × group interaction (all p < 0.001; MANOVA.RM with wild bootstrap MATS).
Across all augmentation subgroups (CTG and VCMX), a statistically significant increase in STT was observed between T0 and T1 at both measurement points.
At measurement point P2, the median STT values increased in the CTG subgroups from 0.88 (0.70–1.10) mm in G1A and 0.75 (0.61–0.87) mm in G1B at baseline to 2.51 (2.30–3.26) mm and 2.00 (1.70–2.34) mm at T1, respectively. In the VCMX subgroups, the median STT increased from 0.66 (0.60–1.14) mm in G2A and 0.74 (0.59–0.91) mm in G2B at T0 to 1.80 (1.60–2.80) mm and 2.21 (2.00–2.49) mm at T1, respectively.
A comparable pattern was observed at measurement point P3, where the median STT values increased from the baseline levels of approx. 0.5–0.8 mm to approx. 1.7–2.5 mm at T1 in all augmentation subgroups.
In contrast, the control group (G3) demonstrated no statistically significant changes in STT at either P2 or P3, with the median values remaining close to baseline at all time points. Post hoc analyses revealed statistically significant differences between all augmentation groups and the control group already at T1.
In the CTG subgroups, the STT values remained stable between T1 and T2. At P2, the median STT values at T2 amounted to 2.75 (2.30–3.00) mm in G1A and 2.40 (2.20–2.51) mm in G1B. At P3, the median STT values at T2 were 2.00 (1.89–2.70) mm and 2.20 (1.82–2.49) mm, respectively.
In the VCMX subgroups, changes between T1 and T2 differed according to augmentation timing. At P2, the median STT at T2 amounted to 2.33 (1.90–2.58) mm in the two-stage subgroup (G2A), whereas in the one-stage subgroup (G2B), the median STT decreased from 2.21 (2.00–2.49) mm at T1 to 1.83 (1.30–2.13) mm at T2. At P3, the median STT values at T2 were 1.80 (1.37–2.53) mm in G2A and 1.55 (1.42–1.83) mm in G2B.
At the 12-month follow-up (T2), the STT values in all augmentation subgroups remained significantly higher than in the control group at both measurement points. Between-group comparisons at T2 demonstrated higher STT values in the CTG subgroups as compared to the VCMX subgroups in several comparisons, whereas other CTG–VCMX comparisons did not reach statistical significance.
The data is presented in Figure 6 and Figure 7, and in Table 3.
Secondary outcomes
Implant stability
Implant stability was assessed using RFA. The median ISQ values were high at implant placement and remained stable prior to prosthetic loading, indicating adequate primary and secondary implant stability across all study groups. All implants reached ISQ values considered suitable for prosthetic loading.
Marginal bone loss
Radiographic evaluation demonstrated low MBL values across the study population during the 12-month follow-up period. When all implants were analyzed collectively, the median MBL was 0.2 (0.0–0.6) mm, with a maximum observed value of 1.5 mm.
The analysis of the main study groups revealed low median MBL values in all groups, amounting to 0.1 mm in the CTG group (G1), 0.5 mm in the VCMX group (G2) and 0.3 mm in the control group (G3). Subgroup analysis stratified by the augmentation material and timing similarly demonstrated low MBL values, with median bone loss not exceeding 0.7 mm in any subgroup.
Intergroup comparison using the Kruskal–Wallis rank-sum test revealed no statistically significant differences in MBL between the analyzed subgroups (χ2 = 3.88; df = 4; p = 0.42).
Biological and prosthetic complications
Biological and prosthetic complications were assessed at each follow-up visit, using the predefined clinical and radiographic criteria. No biological complications, including peri-implant mucositis or peri-implantitis, were observed at any implant site during the 12-month follow-up period. Similarly, no prosthetic complications, such as abutment loosening, screw fracture or crown-related technical events, were recorded throughout the observation period.
Discussion
Principal findings
The principal finding of this RCT was that peri-implant soft tissue augmentation was associated with a significant and clinically relevant increase in STT as compared to non-augmented control sites, irrespective of the augmentation material used. While both augmentation approaches were associated with increased SST, subepithelial CTGs tended to achieve significantly higher final peri-implant SST than VCMX, with differences in the range of approx. 0.3–0.6 mm at the 12-month follow-up.
Importantly, no statistically significant differences related to augmentation timing were detected in either the CTG or the VCMX groups with respect to the final STT outcomes.
Taken together, these findings suggest that while CTG appeared to be associated with a greater and more stable increase in peri-implant STT, VCMX may provide a clinically meaningful alternative capable of improving soft tissue conditions as compared to non-augmented sites.
Comparison with previous studies
Recent systematic reviews and RCTs provide a consistent clinical framework for the present findings. A recent systematic review and meta-analysis by Ramanauskaite et al. demonstrated that autogenous CTGs provide greater mucosal thickness gain as compared to soft tissue substitutes, while differences in patient-reported esthetic outcomes appear to be less pronounced.23 In a network meta-analysis, Tommasato et al. ranked CTGs as the most effective approach for increasing peri-implant STT, while VCMXs, including Fibro-Gide, achieved slightly lower but clinically relevant thickness gains with reduced patient morbidity.12 Similarly, a meta-analysis by Ríos-Osorio et al. demonstrated that the reported inferiority of collagen matrices was primarily driven by non-cross-linked materials, whereas volume-stable cross-linked matrices achieved mucosal thickness gains comparable to CTG, with pooled intergroup differences close to zero.2 This pattern appears consistent with the present findings, in which CTG tended to achieve greater final STT than VCMX, while both modalities resulted in clinically meaningful tissue augmentation.
Long-term randomized clinical data further supports these observations. In a 5-year follow-up study, Thoma et al. reported STT gains of approx. 0.5–0.6 mm for both CTG and VCMX, with no clinically relevant intergroup differences in volumetric outcomes.24 Using ultrasonographic measurements, the present study showed a comparable order of magnitude of soft tissue augmentation, despite differences in the study design, augmentation timing and assessment methodology.
In contrast, a large multicenter RCT by Hämmerle et al. reported inconclusive evidence regarding the non-inferiority of VCMX as compared to CTG for crestal mucosal thickness, with differences of approx. 0.5 mm favoring CTG.25 Notably, these differences appear consistent with the magnitude of intergroup differences observed in the present study, and may be partly explained by variations in the anatomical focus and outcome assessment. Nevertheless, comparisons between studies should be interpreted cautiously due to differences in the study design, augmentation timing protocols and outcome assessment methodologies.
Differences between autogenous grafts and collagen matrices may be explained by distinct patterns of vascularization and remodeling, as CTGs demonstrate greater vascular integration, whereas VCMXs are characterized by reduced perfusion and a denser connective tissue architecture, as demonstrated in both preclinical and human histological studies.26, 27, 28
Preclinical and histological studies provide a biological rationale for the clinically observed behavior of VCMXs. Experimental investigations demonstrated rapid vascularization, progressive tissue integration and greater volumetric stability of VCMXs in comparison with non-cross-linked collagen matrices, accompanied by the absence of a chronic foreign-body reaction. These observations have been consistently reported in preclinical models by Caballe-Serrano et al.,27 Naenni et al.28 and Imber et al.,29 supporting the favorable biological performance of VCMXs.
Importantly, human histological data reported by Smirani et al. showed that the sites augmented with Fibro-Gide exhibited a denser connective tissue architecture with reduced vascularization as compared to CTG, despite achieving comparable clinical soft tissue dimensions.26 Collectively, these findings support the present clinical observations and suggest distinct remodeling patterns rather than differences in the magnitude of the achieved clinical effect.
Timing of soft tissue augmentation
Despite extensive research on peri-implant soft tissue augmentation, the influence of augmentation timing has not been systematically investigated. Previous clinical trials applied augmentation either at implant placement or at later surgical stages, without formally comparing timing-related effects.
Limited randomized evidence by Hadzik et al.30 and Puzio et al.31, 32 suggests more pronounced and stable increases in SST when augmentation is performed prior to implant placement, using CTGs or a non–volume-stable collagen matrix. However, these findings cannot be directly extrapolated to volume-stable cross-linked collagen matrices due to fundamental differences in material properties and remodeling behavior.
In the present TCT, augmentation timing was prospectively evaluated for both CTG and VCMX, using standardized ultrasonographic measurements. While timing appeared to influence early remodeling patterns, the final peri-implant STT values exceeded 2 mm in all augmented sites, and were comparable between the one-stage and two-stage protocols. These findings should be interpreted with caution, as the study may be underpowered to detect small but clinically relevant differences. Within these limitations, the absence of statistical significance should not be interpreted as the evidence of equivalence. These findings suggest that augmentation timing may affect early healing dynamics, whereas long-term soft tissue dimensions may be less dependent on the surgical stage at which augmentation is performed.
Hard tissue stability and safety
Peri-implant hard tissue stability appeared to be preserved regardless of the augmentation modality or timing, with stable marginal bone levels observed across all groups. This finding is of particular clinical relevance, as MBL and peri-implant tissue conditions have been identified as core outcome domains in contemporary consensus frameworks for implant dentistry.10 These findings are consistent with long-term clinical observations indicating that inadequate peri-implant soft tissue conditions, including insufficient keratinized mucosa, are associated with an increased risk of peri-implant disease and greater MBL over time.33 No statistically significant association between STT and MBL was detected. Importantly, following soft tissue augmentation, all augmented study sites exhibited a peri-implant mucosal thickness exceeding 2 mm.
The clinical relevance of achieving an adequate SST has been previously highlighted by Linkevicius et al., who demonstrated significantly greater MBL around the implants placed at sites with a mucosal thickness ≤2 mm.13, 34 Similarly, a recent systematic review and network meta-analysis by Tommasato et al. reported that both keratinized mucosa width ≥2 mm and STT > 2 mm were associated with reduced inflammation, recession and peri-implant bone loss, suggesting a protective role of increased soft tissue dimensions.12 However, despite this growing body of evidence, no clear consensus exists regarding a definitive threshold, and the 2-mm value should not be interpreted as a strict biological cutoff, but rather as a clinically derived reference point reflecting a transition toward more favorable tissue stability conditions. In this context, the absence of significant differences in MBL observed in the present study may partly be explained by the achievement of a sufficiently thick peri-implant soft tissue envelope across the augmented treatment groups, thereby minimizing the influence of the baseline tissue thickness on bone-level changes.
In addition, no biological or technical complications, implant losses, or adverse tissue reactions were recorded, supporting the clinical safety of the applied augmentation procedures within the limitations of the present follow-up period.
Clinical implications
The present findings suggest that both autogenous CTGs and xenogeneic VCMXs may be considered clinically viable options for peri-implant soft tissue augmentation when the primary clinical objective is to achieve an adequate final STT. From a clinical perspective, the choice of the augmentation modality may therefore also be guided by patient-related factors, surgical morbidity and operator preference rather than by the expectations of differences in long-term soft tissue dimensions, which is consistent with the reports highlighting variability in clinicians’ knowledge, awareness and decision-making regarding peri-implant soft and hard tissue management.35 Although patient-reported outcomes and esthetic perception may also contribute to clinical decision-making, the present study was primarily designed to evaluate biological and dimensional peri-implant soft tissue outcomes. The observed intergroup difference in STT between CTG and VCMX (0.3–0.6 mm) may nevertheless be clinically relevant in specific clinical scenarios, particularly at sites with an initially thin soft tissue phenotype.
Furthermore, as augmentation timing primarily influenced early healing dynamics, without statistically significant differences in the final STT being detected, clinicians may consider individualizing the sequencing of soft tissue augmentation according to the clinical situation, surgical workflow and prosthetic requirements. Importantly, achieving a peri-implant STT exceeding clinically relevant thresholds appears sufficient to maintain peri-implant hard tissue stability, supporting a pragmatic and patient-centered approach to soft tissue management. Emerging evidence indicates that genetic and epigenetic factors may modulate the peri-implant tissue response, bone remodeling and implant success. These observations support the future development of personalized, genomics-based approaches in implant therapy aimed at improving treatment predictability and long-term outcomes.36 These findings are aligned with the 2026 GCCG,10 representing the first globally developed evidence-based guideline framework in implant dentistry, which emphasizes standardized outcome domains and peri-implant tissue management strategies.37, 38
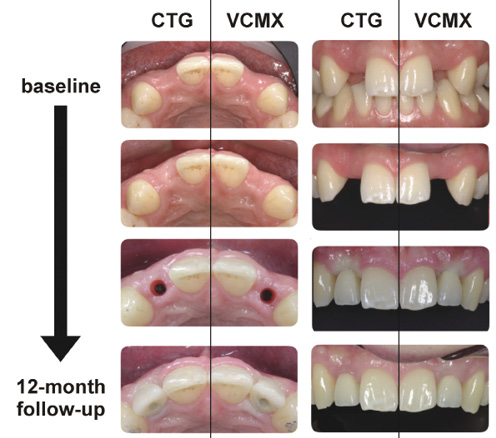
Representative clinical cases illustrating soft tissue changes following augmentation with CTG and VCMX are presented in Figure 8.
Limitations
Several limitations of the present study should be acknowledged. Patient-reported outcome measures (PROMs) and esthetic outcomes were not included among the predefined study endpoints. First, the sample size was limited and no formal a priori sample size calculation was performed, which might affect the statistical power and increase the risk of type II error, particularly in subgroup analysis related to augmentation timing. Second, the trial was conducted at a single clinical center and all surgical procedures were performed by a single operator, which might limit the external generalizability of the findings. In addition, due to the nature of the interventions, operator blinding was not feasible, which might introduce potential bias. Third, the follow-up period was limited to 12 months; therefore, potential long-term differences in soft tissue behavior beyond this observation period cannot be excluded. Finally, soft tissue assessment was based on ultrasonographic measurements at the predefined points, which did not permit a comprehensive volumetric analysis of peri-implant soft tissue changes. Although this approach provided standardized and reproducible measurements of STT, it might not fully capture the 3D volumetric and contour alterations of peri-implant soft tissues.
Conclusions
Peri-implant soft tissue augmentation was associated with a significant and clinically relevant increase in STT as compared to non-augmented control sites. While subepithelial CTGs tended to achieve greater final STT than VCMX, both approaches provided clinically meaningful improvement in peri-implant soft tissue dimensions.
The timing of soft tissue augmentation, performed either prior to implant placement or simultaneously with implant insertion, was not associated with statistically significant differences in the final STT outcomes within the limitations of this exploratory study and the 12-month follow-up, despite differences in early remodeling patterns. Moreover, stable marginal bone levels, and the absence of biological or technical complications support the short-term clinical safety of both augmentation modalities and protocols.
Within the limitations of the present study, VCMXs may represent a reliable alternative to autogenous CTGs for peri-implant soft tissue augmentation, potentially allowing clinicians to individualize treatment strategies based on clinical conditions and patient-related factors.
Trial registration
The trial was registered at ClinicalTrials.gov (NCT07324187).
Ethics approval and consent to participate
This randomized controlled clinical trial was approved by the Bioethics Committee at Wroclaw Medical University, Poland (approval No. KB-863/2021; October 28, 2021), and conducted in accordance with the Declaration of Helsinki and the Good Clinical Practice guidelines. Written informed consent was obtained from all participants prior to enrollment in the study.
Data availability
The datasets supporting the findings of the current study are available from the corresponding author on reasonable request.
Consent for publication
Not applicable.
Use of AI and AI-assisted technologies
The original data was not generated, processed or analyzed using AI technologies. The authors take full responsibility for the content of the manuscript.