Abstract
Background. The accuracy of intraoral scanners (IOSs) has been widely reported. However, studies comparing their performance under different clinical conditions are lacking.
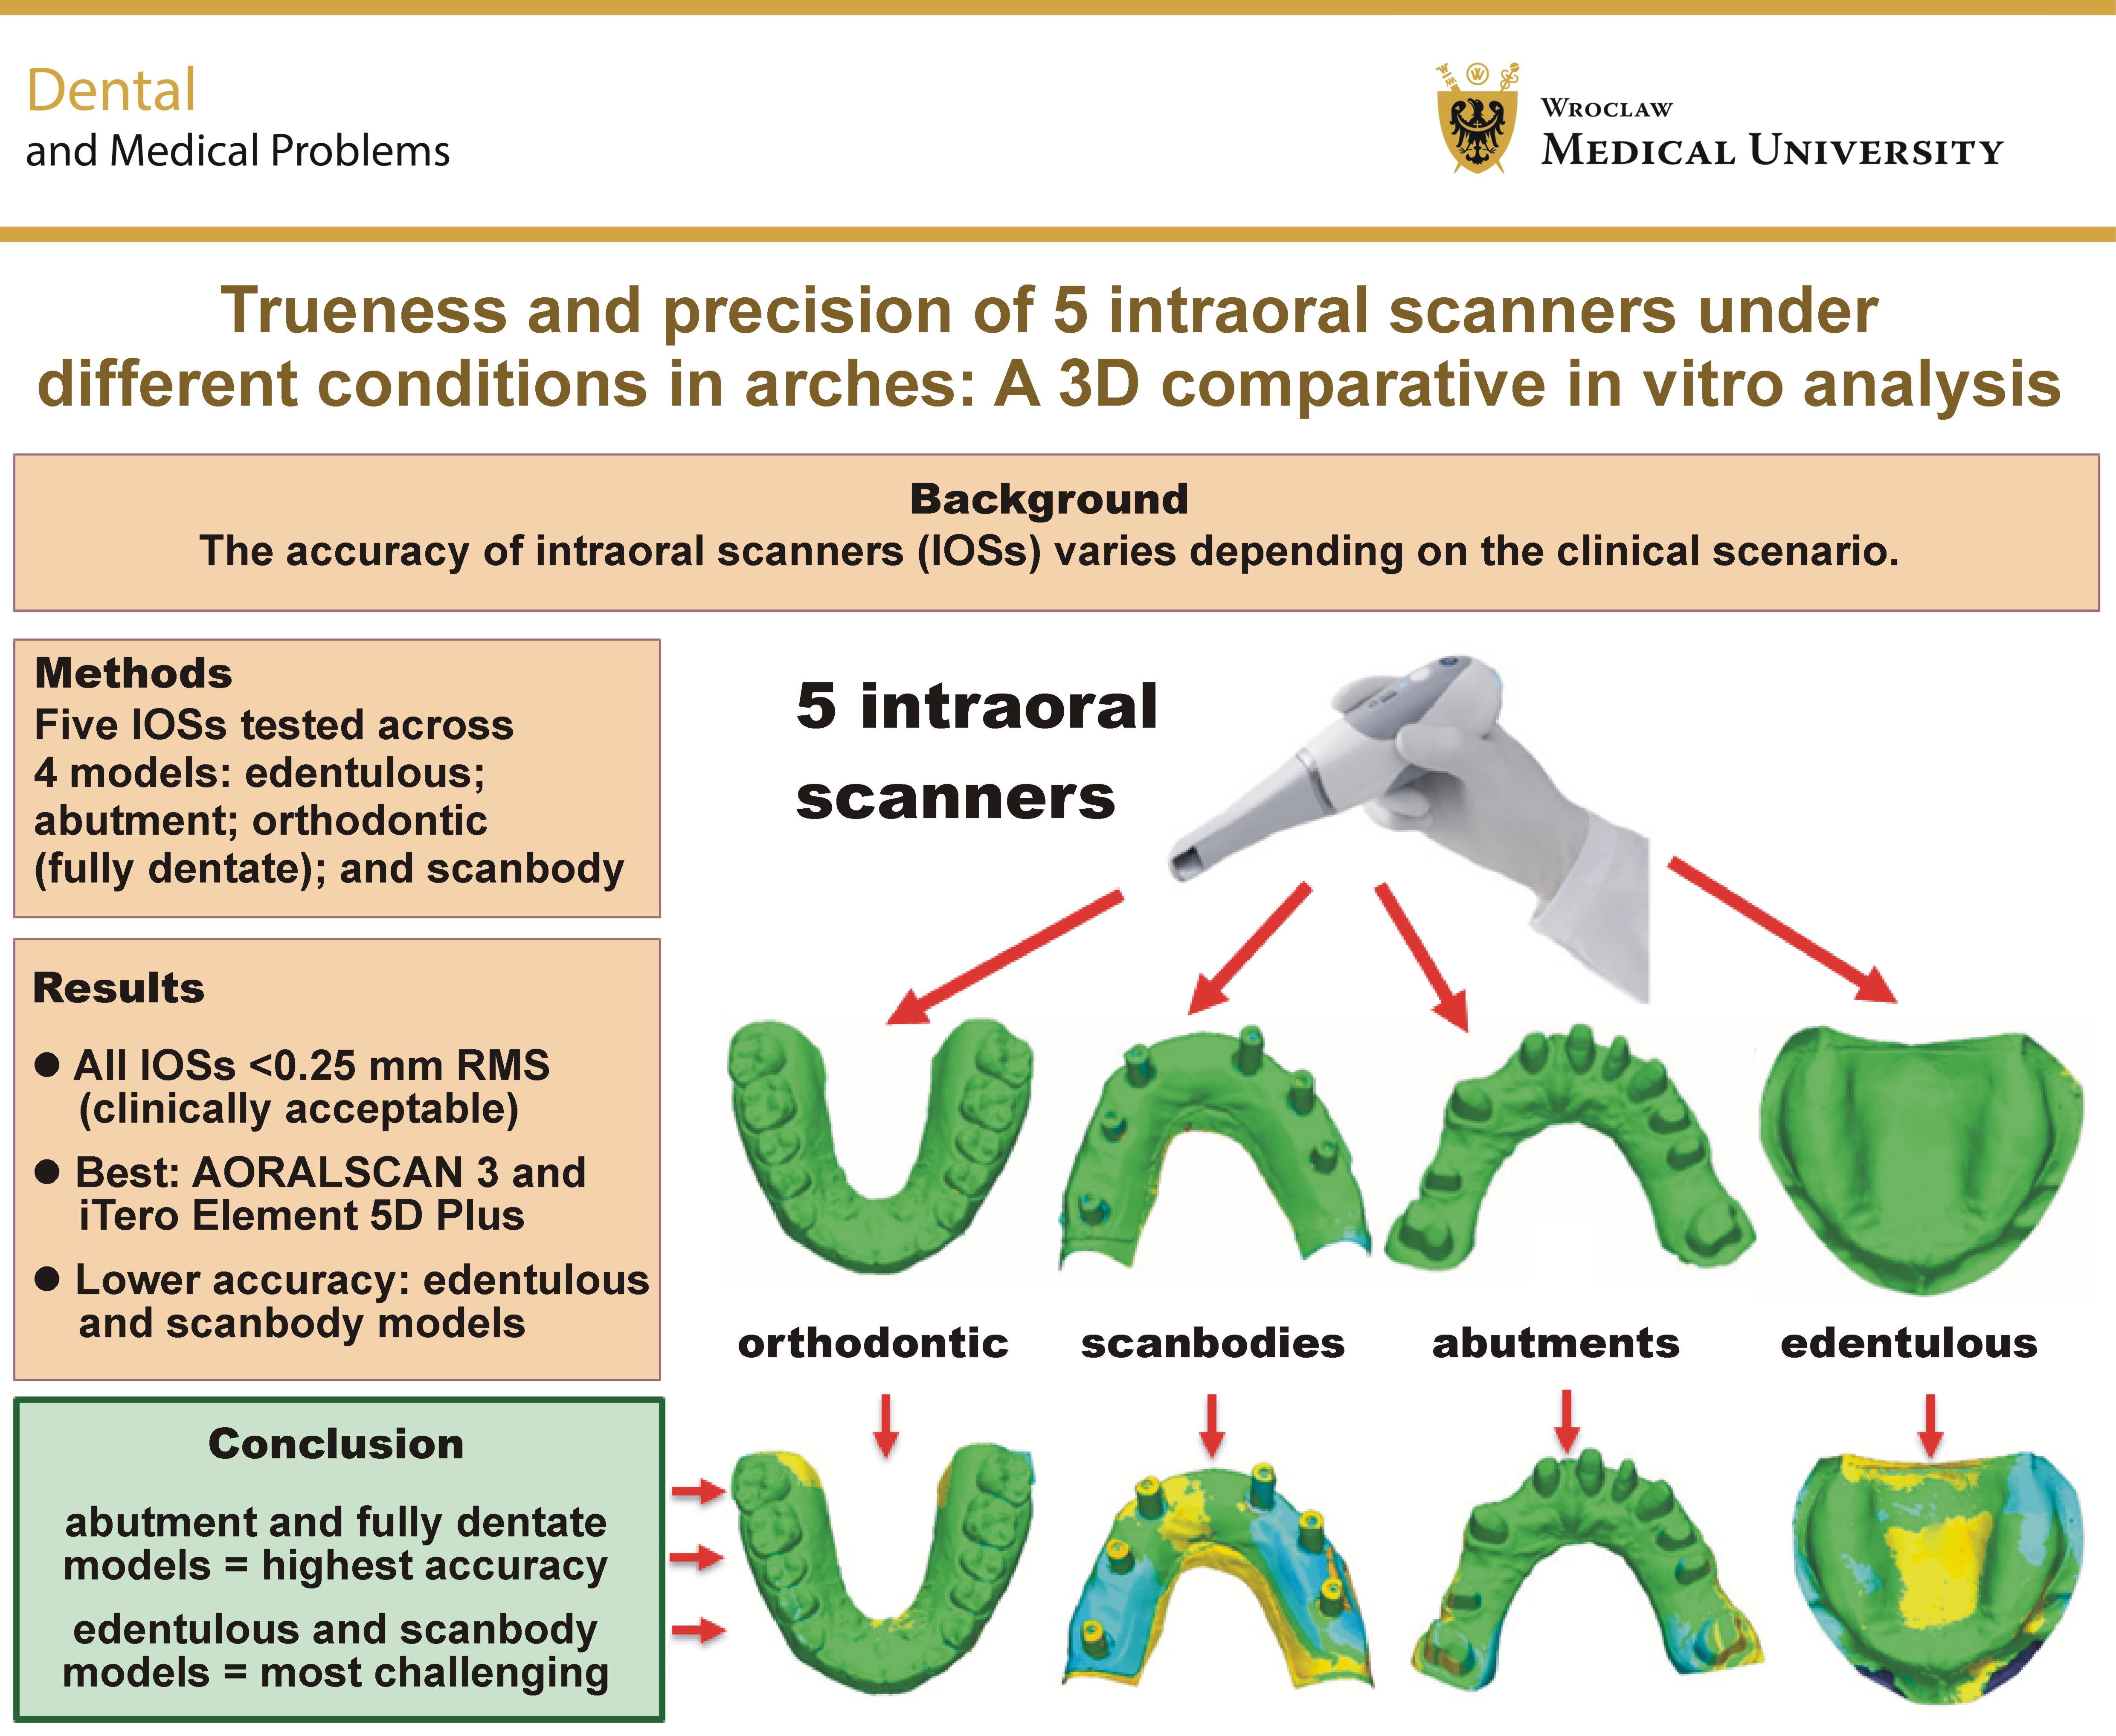
Objectives. The aim of the present study was to compare the trueness and precision of 5 IOSs across 4 anatomically distinct models simulating common clinical conditions: edentulous; abutment; orthodontic (fully dentate); and scanbody scenarios.
Material and methods. An in vitro study was conducted using 4 maxillary models representing different clinical configurations. Five IOSs (AORALSCAN 3, TRIOS 5, ViSIOScan WL, iTero Element 5D Plus, and DEXIS IS 3800) were evaluated. Each model was scanned 10 times with each scanner, and a laboratory desktop scanner was used as the reference for trueness. Accuracy was quantified using the root mean square (RMS) deviation values, with a clinical acceptability threshold of 0.25 mm. Superimposition and deviation analyses were performed using three-dimensional (3D) software, and statistical comparisons were conducted using ANOVA and Scheffé’s post hoc test.
Results. Except for ViSIOScan WL in the scanbody model, all tested scanners demonstrated accuracy values below 0.1 mm. Significant differences in trueness and precision were observed both between the scanners and across the clinical scenarios (p < 0.05). Overall, AORALSCAN 3 and iTero Element 5D Plus consistently demonstrated the best performance. The abutment and fully dentate models showed the highest accuracy, whereas the edentulous and scanbody models exhibited greater deviations, particularly for ViSIOScan WL and DEXIS IS 3800.
Conclusions. Despite most IOSs achieving accuracy below 0.1 mm, substantial variability was observed depending on the scanner type and the anatomical context. AORALSCAN 3 and iTero Element 5D Plus consistently demonstrated superior trueness and precision across most models. While the fully dentate model showed no significant differences in trueness among the scanners, it, along with the abutment model, yielded the highest overall accuracy. The edentulous and scanbody models posed greater challenges.
Keywords: precision, digital dentistry, trueness, intraoral scanners, dental impressions
Introduction
The introduction of intraoral scanners (IOSs) into daily dental practice has brought a major shift in digital workflows, offering a fast, non-invasive and efficient alternative to conventional impression techniques.1 Their integration into fully digital workflows has transformed various fields, including prosthodontics, orthodontics, implantology, and oral surgery.2, 3, 4 By eliminating the need for impression materials and physical models, IOSs offer several advantages, including reduced chairside and laboratory time, increased patient comfort, enhanced communication between clinicians and technicians, and the potential for streamlined computer-aided design/computer-aided manufacturing (CAD/CAM) fabrication.1, 2, 5, 6 However, the clinical reliability of digital impressions still relies heavily on scan accuracy.
According to ISO 5725-1:1994,7 the accuracy of a measurement method comprises trueness, defined as the closeness of agreement between the test result and the true value, and precision, which refers to the closeness of agreement between repeated measurements.1, 7, 8 In the context of intraoral scanning, trueness determines how faithfully the digital model reflects the actual geometry of the arch or preparation, whereas precision reflects the reproducibility of the scan when repeated under the same conditions.
Numerous factors can influence IOS accuracy, including the type of scanner, its underlying technology (e.g., confocal microscopy, triangulation, or structured light), the operator’s experience, the scanning strategy, and, most importantly, the clinical scenario in which the scan is performed.1, 4, 9, 10, 11, 12 While excellent results have been reported for short-span prostheses and single-tooth restorations, challenges persist when scanning complete dental arches, edentulous regions or implant-supported restorations, where anatomical landmarks may be sparse or absent.9, 13, 14, 15
One particularly demanding situation is the edentulous alveolar process, where smooth mucosal surfaces and a lack of topographic details often hinder the ability of the scanner to capture and accurately stitch three-dimensional (3D) data.4, 10 Several studies have reported a marked reduction in scan trueness and precision in such cases, with root mean square (RMS) deviations significantly exceeding acceptable thresholds.16 Anatomical features, such as palatal rugae, have been proposed as useful reference structures to guide image alignment and stitching; however, their effectiveness remains debatable. In some cases, these structures may even introduce localized distortions due to surface irregularities.12, 17
Similarly, implant-supported prosthetic scenarios, particularly those involving scanbodies, pose unique challenges. The optical properties of titanium or polyetheretherketone (PEEK) scanbodies, potential misfit, and soft-tissue interference may all contribute to errors in scan alignment and interpretation.18, 19 A high degree of accuracy is critical in these conditions, as even minor deviations can affect the passive fit of the prosthetic superstructure, potentially compromising osseointegration or leading to mechanical complications.20
Conversely, fully dentate arches, such as those typically encountered in orthodontic cases, provide more favorable topography for intraoral scanning.21 The abundance of anatomical details – cusps, fissures and contact points – enhances the ability of the software to accurately process and align the acquired data. As a result, such cases are often considered ideal for IOS use. However, even in these contexts, scanner performance can vary significantly depending on its optical system, the image acquisition rate, and software algorithms.10, 21
Despite the growing body of evidence on IOS performance,22, 23 many available studies compare only a small number of scanners, focus on one or two clinical scenarios, or use simplified models that do not reflect the complexity of actual oral anatomy.4, 24, 25, 26 Moreover, comparisons are often based on outdated technologies that may not be representative of current-generation IOS systems. This limits the generalizability of the findings to everyday clinical decision-making. Hence, to provide clinicians with practical insights, broader evaluations are needed to assess the performance of multiple IOSs across a wide range of clinically relevant conditions.
Therefore, the aim of the present study was to compare the trueness and precision of 5 modern intraoral scanners (AORALSCAN 3, TRIOS 5, ViSIOScan WL, iTero Element 5D Plus, and DEXIS IS 3800) across various clinical scenarios. The operating principles and manufacturer specifications of the scanners are presented in Table 1.
Material and methods
Reference models and study design
Four different gypsum models were prepared to represent various clinical conditions. The 1st model was a completely edentulous maxilla (the edentulous group). The 2nd model was a maxilla with 10 abutments in positions #11, #13, #15, #16, #21, #22, #23, #24, #25, and #27 (the abutment group). The distribution of the abutments reflected a real clinical case, with its irregular pattern intentionally preserved to better simulate realistic conditions. The 3rd model was a complete maxillary dental arch (the orthodontic group). The final model was a partially edentulous maxilla with implant analogs in positions #12, #14, #16, #22, #23, and #25 (the scanbody group).
The 5 IOSs evaluated and compared in terms of trueness and precision were as follows: (1) AORALSCAN 3 (SHINING 3D Tech Co., Ltd., Hangzhou, China); (2) TRIOS 5 (3Shape, Copenhagen, Denmark); (3) ViSIOScan WL (NewTom, Imola, Italy); (4) iTero Element 5D Plus (Align Technology, Inc., Tempe, USA); and (5) DEXIS IS 3800 (DEXIS, Quakertown, USA).
The following laboratory reference scanner was used to assess trueness: the DOF Freedom UHD desktop scanner (DOF Inc., Seoul, South Korea).
Each gypsum model was first scanned using the industrial optical desktop scanner. Subsequently, 10 scans of each model were acquired using each of the 5 IOSs. All IOSs were used under the same conditions and by the same expert operator in digital dentistry. The operator had more than 15 years of experience in digital workflows and had previously performed at least 30 full-arch scans with each of the 5 IOSs tested, ensuring comparable familiarity with each device and minimizing the influence of the learning curve. The same scanning technique was used for each scan, and the scanning sequence was randomized to reduce the influence of operator fatigue.
All scans were performed using a zig-zag scanning approach with each IOS. Although each manufacturer recommends a specific scanning protocol, the same zig-zag strategy was intentionally applied to all IOSs to standardize the methodology and ensure that differences in performance reflected device characteristics rather than variations in the scanning technique. The scanning process started in the 1st quadrant (upper right), where the scanner tip followed an arc from the vestibular to the palatal side and then returned. The scanner was advanced slowly to capture the teeth, the scanbodies and the gingiva, moving from the vestibular to the palatal side and back while crossing the occlusal plane/the alveolar ridge.
Superimposition and deviation analysis
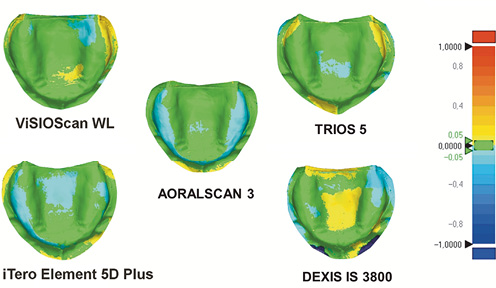
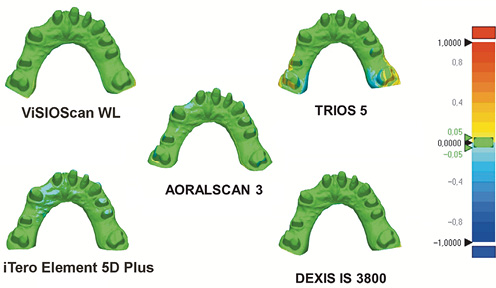
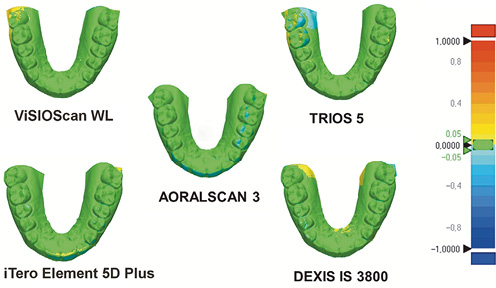
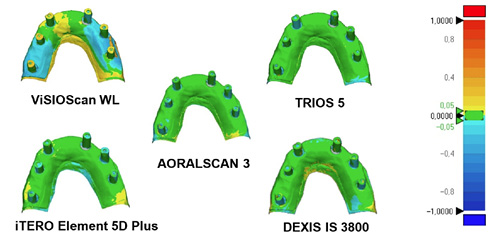
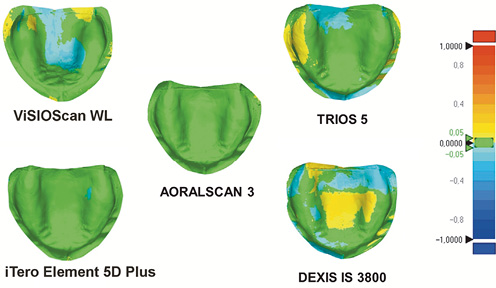
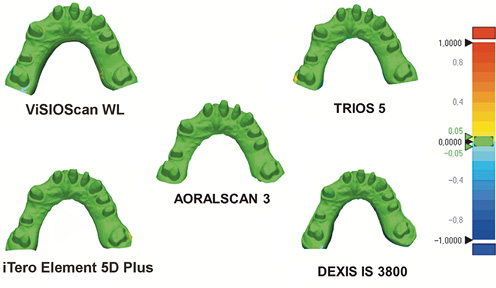
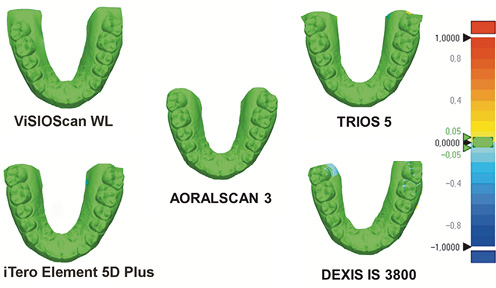
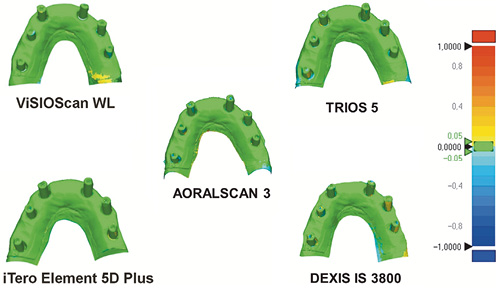
The primary outcome of this study was accuracy, defined in terms of trueness and precision. To remove surplus surfaces, each STL file obtained using the 5 IOSs was imported into the 3-matic Research software, v. 13.0.0.188 (Materialise, Leuven, Belgium) and superimposed on the digital master model obtained using the industrial desktop scanner. All trimmed STL files were then imported into the Geomagic Control X software, v. 2018.1.1 (3D Systems, Rock Hill, USA). The 3D deviation function was used to visualize the results using a color-coded 3D map, with yellow-to-red areas indicating positive deviations exceeding the upper tolerance limit and turquoise-to-dark-blue areas indicating negative deviations exceeding the lower tolerance limit. The tolerance range, represented in green, was set at ±0.05 mm.
Superimposition was performed using a three-point registration approach, followed by the best-fit alignment function for final alignment and trueness calculation. A similar procedure was used to evaluate precision. For each scanner, the scan with the highest trueness was selected as the reference model. The distances between the corresponding surface points of the two digital models were expressed as RMS values, representing trueness or precision, depending on the reference model used.
Statistical analysis
The trueness and precision RMS values were expressed as means and standard deviations (M ±SD). The normality of data distribution was assessed for each group using the Shapiro–Wilk test. As all datasets met the assumption of normality (p > 0.05), the one-way analysis of variance (ANOVA) was used to compare trueness and precision among the IOSs within each group, and across groups for each scanner. Scheffé’s method was used for post hoc multiple comparisons. Data were analyzed using IBM SPSS Statistics, v. 25.0 (IBM Corp., Armonk, USA).
Results
Statistically significant intergroup differences (among IOSs within each clinical condition) and intragroup differences (among clinical conditions for each scanner) were assessed using ANOVA followed by post hoc comparisons.
The RMS values for trueness across the different groups and IOSs are presented in Table 2. To facilitate interpretation, a ranking system was introduced to highlight the relative performance of each scanner across different models (Supplementary Table 1, available from the corresponding author upon request). Statistically significant differences were found among the scanners for all model types (p < 0.05), except for the orthodontic group (p > 0.05) (Table 2).
In the edentulous group, AORALSCAN 3 and iTero Element 5D Plus exhibited the highest trueness (i.e., the lowest RMS values), with values of 0.045 ±0.001 mm and 0.045 ±0.003 mm, respectively. In contrast, ViSIOScan WL and DEXIS IS 3800 showed the largest deviations in this group, with RMS values of 0.067 mm and 0.066 mm, respectively (Table 2, Figure 1).
In the abutment group, iTero Element 5D Plus showed the lowest deviation (0.030 ±0.002 mm), followed by AORALSCAN 3 (0.037 ±0.002 mm). In contrast, TRIOS 5 exhibited the highest RMS value (0.057 ±0.006 mm) (Table 2, Figure 2).
In the orthodontic group, the RMS values ranged from 0.036 ±0.002 mm for iTero Element 5D Plus to 0.054 ±0.008 mm for ViSIOScan WL. However, no statistically significant differences were observed between iTero Element 5D Plus and the other IOSs (p > 0.05) (Table 2, Figure 3).
In the scanbody group, all IOSs showed higher RMS values, particularly ViSIOScan WL (0.134 ±0.006 mm), which performed significantly worse than all the other IOSs (p < 0.001). The lowest RMS value was recorded for TRIOS 5 (0.071 ±0.003 mm) (Table 2, Figure 4).
The RMS values for precision are summarized in Table 3. Statistically significant differences were observed among the IOSs in the edentulous, abutment and orthodontic groups (p < 0.05) (Figure 5, Figure 6, Figure 7), but not in the scanbody group (p > 0.05) (Figure 8). Overall, AORALSCAN 3 and iTero Element 5D Plus consistently exhibited higher precision across the different models.
For the edentulous model, AORALSCAN 3 exhibited the lowest RMS value (0.018 ±0.002 mm), followed by iTero Element 5D Plus (0.023 ±0.001 mm), whereas DEXIS IS 3800 showed the highest RMS value (0.076 ±0.004 mm). In both the abutment and orthodontic groups, the highest precision was observed for AORALSCAN 3 (0.016 ±0.001 mm) and iTero Element 5D Plus (0.014 ±0.004 mm), respectively. These values were significantly lower than those obtained with ViSIOScan WL and DEXIS IS 3800 (p < 0.05). In the scanbody group, all IOSs showed higher RMS values, with no statistically significant differences among them (range: 0.056–0.070 mm; p > 0.05) (Table 3).
Both for trueness and precision, pairwise comparisons revealed statistically significant differences between specific scanners and conditions, as indicated in Table 2 and Table 3.
Discussion
The present in vitro investigation aimed to evaluate the trueness and precision of 5 IOSs across 4 clinically relevant scenarios: edentulous arches; dentate models with abutments; fully dentate orthodontic models; and implant-supported scanbodies. The findings revealed significant differences in scanner performance depending on both the device and the clinical context, although most deviations remained below 0.1 mm. These results provide insights into the clinical applicability of different IOSs and highlight the importance of scenario-specific evaluation when selecting a digital impression device.
One of the most relevant findings was the variation in both trueness and precision according to the anatomical features of the scanned models. The orthodontic model, representing a fully dentate arch, consistently yielded the best performance across all IOSs. This was expected, as previous studies have shown that the presence of well-defined anatomical landmarks, such as cusps, incisal edges and interproximal contacts, facilitates the alignment and stitching of digital scan images.4, 12 These findings are consistent with those of Braian and Wennerberg, who also reported higher accuracy in dentate models than in edentulous models.27
The convergence of trueness among the scanners based on different optical principles (confocal microscopy and triangulation) in the fully dentate model is a noteworthy finding of the present study. This suggests that, in ideal, low-complexity scanning scenarios, the influence of the fundamental hardware may be partly offset by sophisticated software processing and algorithms designed to compensate for error accumulation.28 Therefore, in routine orthodontic and simple restorative applications, operator proficiency and software refinement may be more decisive factors in determining scanning performance than the underlying optical technology alone.
In contrast, edentulous models, particularly those with flat mucosal surfaces and few anatomical landmarks, represented the most challenging scanning scenario. All devices exhibited reduced accuracy under these conditions, although the measured values remained within the accepted clinical threshold. The lack of distinct reference points may impair the image-matching algorithms of IOSs, leading to increased cumulative error during scanning.29 These results are consistent with previous findings indicating that IOS accuracy decreases in the absence of teeth, as fewer morphological features are available for software alignment.4, 30, 31, 32
Interestingly, this observation partially contrasts with the findings of Zarone et al., who reported that scans of smooth edentulous typodonts exhibited higher trueness than those of typodonts with wrinkled surfaces, which may introduce localized distortions.33 However, their study focused on a single scanner and specific scanning techniques, whereas the present study evaluated multiple IOSs across a broader range of clinical scenarios. Furthermore, in the present study, the RMS values were used to quantify geometric deviations and assess trueness, whereas the corresponding SD values described variability across repeated scans and were used to assess precision. Thus, the RMS values reflect the magnitude of geometric deviation, while the SD values characterize the consistency of scanning performance across repeated acquisitions.
One of the most clinically sensitive applications of intraoral scanning is the acquisition of implant scanbody data, as even minor deviations may result in the misfit of prosthetic components, increased mechanical stress, or biological complications.20 In the present study, the scanbody model yielded the highest RMS values for trueness with several scanners, particularly ViSIOScan WL and DEXIS IS 3800. ViSIOScan WL exhibited the greatest deviation in this group, with an RMS value of 0.134 mm. Such a deviation may be clinically concerning, particularly in the fabrication of long-span restorations, where accurate implant position transfer is essential to achieving a passive fit of the superstructure. Inaccuracies in implant position transfer may increase stress at the implant–abutment interface, potentially contributing to screw loosening, abutment fracture, or biological complications, such as marginal bone loss.34, 35 These findings highlight the optical and mechanical challenges associated with scanbody scanning, particularly those related to scanbody geometry, surface reflectivity, and potential micromovements during image acquisition.18, 26
Previous studies have emphasised that the optical properties of scanbodies, which are often made of reflective or semi-transparent materials like titanium or PEEK, may affect light-based acquisition methods.9, 36 In addition, factors such as the accuracy of the scanbody–implant interface, material composition, surface condition, and geometric design may influence scanning trueness and precision.37, 38 In the present study, all tested IOSs except ViSIOScan WL achieved trueness RMS values below 0.1 mm in the scanbody model. Nevertheless, differences in performance were observed among the devices, highlighting the importance of scanner selection for implant workflows.
Among other relevant findings, the dual evaluation of trueness and precision in the present study provides a deeper understanding of IOS performance. While trueness reflects the accuracy of a scan compared with a reference model, precision reveals the consistency of repeated scans under identical conditions.1, 7, 8 These two metrics do not always correlate. For example, a scanner may exhibit high trueness (i.e., the scan is close to the reference), but low precision (i.e., high variability across repeated scans), which could undermine its clinical reliability, particularly in workflows involving multiple scans or the merging of scans acquired during different sessions.
According to the present findings, AORALSCAN 3 and iTero Element 5D Plus demonstrated excellent trueness and precision across the different models, suggesting robust performance. In contrast, ViSIOScan WL and DEXIS IS 3800 exhibited greater deviations, particularly in edentulous and implant-related scenarios. Our results also highlighted specific scenarios in which high trueness coexisted with low precision, as observed with the TRIOS 5 scanner in the abutment group. This finding is important to consider, as it suggests that, although the mean deviation of the scanner from the reference standard may be relatively low (high trueness), individual scans may show considerable variability (low precision). These differences may be particularly relevant in complex rehabilitations or full-arch workflows, where reproducibility is essential for achieving prosthetic accuracy and fit. Importantly, the present findings support the notion that no single IOS performs optimally under all conditions, reinforcing the importance of selecting a scanner according to the specific clinical indication.
Limitations
This study has several limitations that should be acknowledged. First, as an in vitro study, the experimental environment does not fully replicate complex intraoral conditions, such as the presence of saliva, patient movement, soft tissue dynamics, or the natural reflectivity of wet enamel. Furthermore, the use of gypsum models, although standard practice in in vitro comparisons, provides a high-contrast, non-reflective surface that may simplify the scanning task compared with natural dentition. Second, our protocol relied on a single, highly experienced operator to minimize random error and improve consistency. Consequently, the results do not account for inter-operator variability or the learning curve associated with less experienced users, both of which may affect clinical outcomes. Other real-world variables, such as scanning time, were not measured, although this is a relevant factor in clinical efficiency. Furthermore, some devices may have been disadvantaged by the zig-zag scanning approach applied to all IOSs, as the specific scanning protocols recommended by each manufacturer were not taken into account. Finally, the deviation analysis was performed using a single, standardized best-fit alignment procedure in the evaluation software. Different alignment strategies could potentially yield slightly different deviation values. Future research should focus on in vivo validation, particularly in complex scenarios involving edentulous and implant patients, while also investigating how factors such as operator variability, different scanning strategies, and integration with CAD/CAM workflows influence the reported accuracy.
Conclusions
AORALSCAN 3 and iTero Element 5D Plus consistently demonstrated the highest accuracy and reproducibility. Although no significant differences in trueness were observed among the scanners in the fully dentate models, these models, together with the abutment models, yielded the highest overall accuracy. Scanbody and edentulous models posed greater challenges. Although modern IOSs generally achieved trueness and precision RMS values below 0.1 mm, understanding their limitations in specific clinical scenarios is essential for optimizing treatment outcomes. These results were obtained under standardized in vitro conditions and require further validation through clinical investigations, particularly in vivo studies, to better establish their applicability in routine clinical practice.
Ethics approval and consent to participate
Not applicable.
Data availability
The datasets supporting the findings of the current study are available from the corresponding author on reasonable request.
Consent for publication
Not applicable.
Use of AI and AI-assisted technologies
Not applicable.