Abstract
Background. Accurate periodontal diagnosis is the cornerstone of effective treatment planning and disease management; however, the clinical application of diagnostic criteria often remains inconsistent. Despite the availability of established international guidelines, dental professionals frequently encounter difficulties in clinical judgment, radiographic assessment and the interpretation of diagnostic parameters. Understanding global patterns of these diagnostic errors across regions and professional groups is crucial for identifying gaps in dental education and improving evidence-based periodontal care worldwide.
Objectives. The aim of the study was to develop a 5-item questionnaire assessing basic periodontal knowledge among dentists, dental students, dental hygienists, and specialists in periodontics worldwide, as well as to understand global patterns and clinical standards.
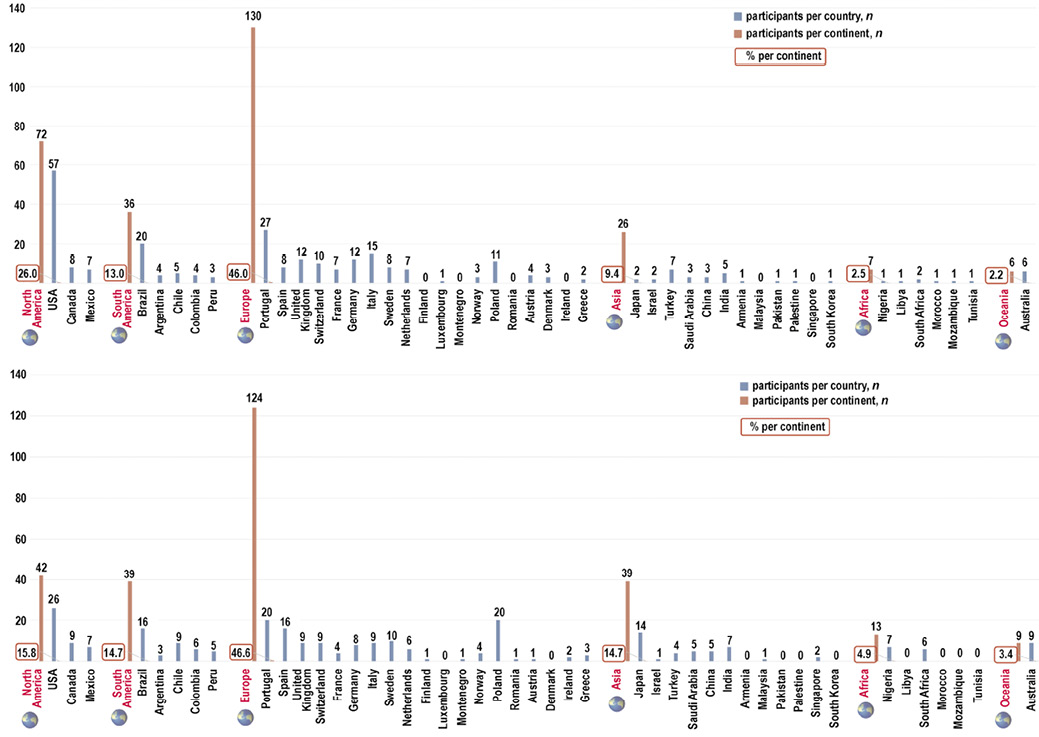
Material and methods. A total of 3,328 professionals from over 60 countries were invited to participate in the questionnaire between September 1 and October 23, 2025. The invitees received e-mails with a link to access the survey. The questions were developed to assess basic periodontal knowledge, such as diagnostic parameters in periodontology, probing and its significance, evidence-based questions, and radiographic assessment. The data was weighted and statistically analyzed.
Results. A total of 543 participants from 46 countries completed the questionnaire (response rate: 16.32%), comprising 266 specialists in periodontics/dental hygienists (S-DHs) and 277 dentists/dental students (D-Ds). Overall, the first group demonstrated superior performance across most questions. The error rates varied markedly across continents. Despite this geographic variation, continents displayed similar internal patterns of errors, as shown by positive intercontinental correlations across most questions. Conversely, question 3 – addressing the balance between clinical judgment and evidence-based guidelines – demonstrated weak or negative correlations with the remaining items, behaving as an independent construct. The observed patterns demonstrated that diagnostic errors cluster within a largely cohesive technical domain, while judgment-based decision-making forms a distinct dimension of performance.
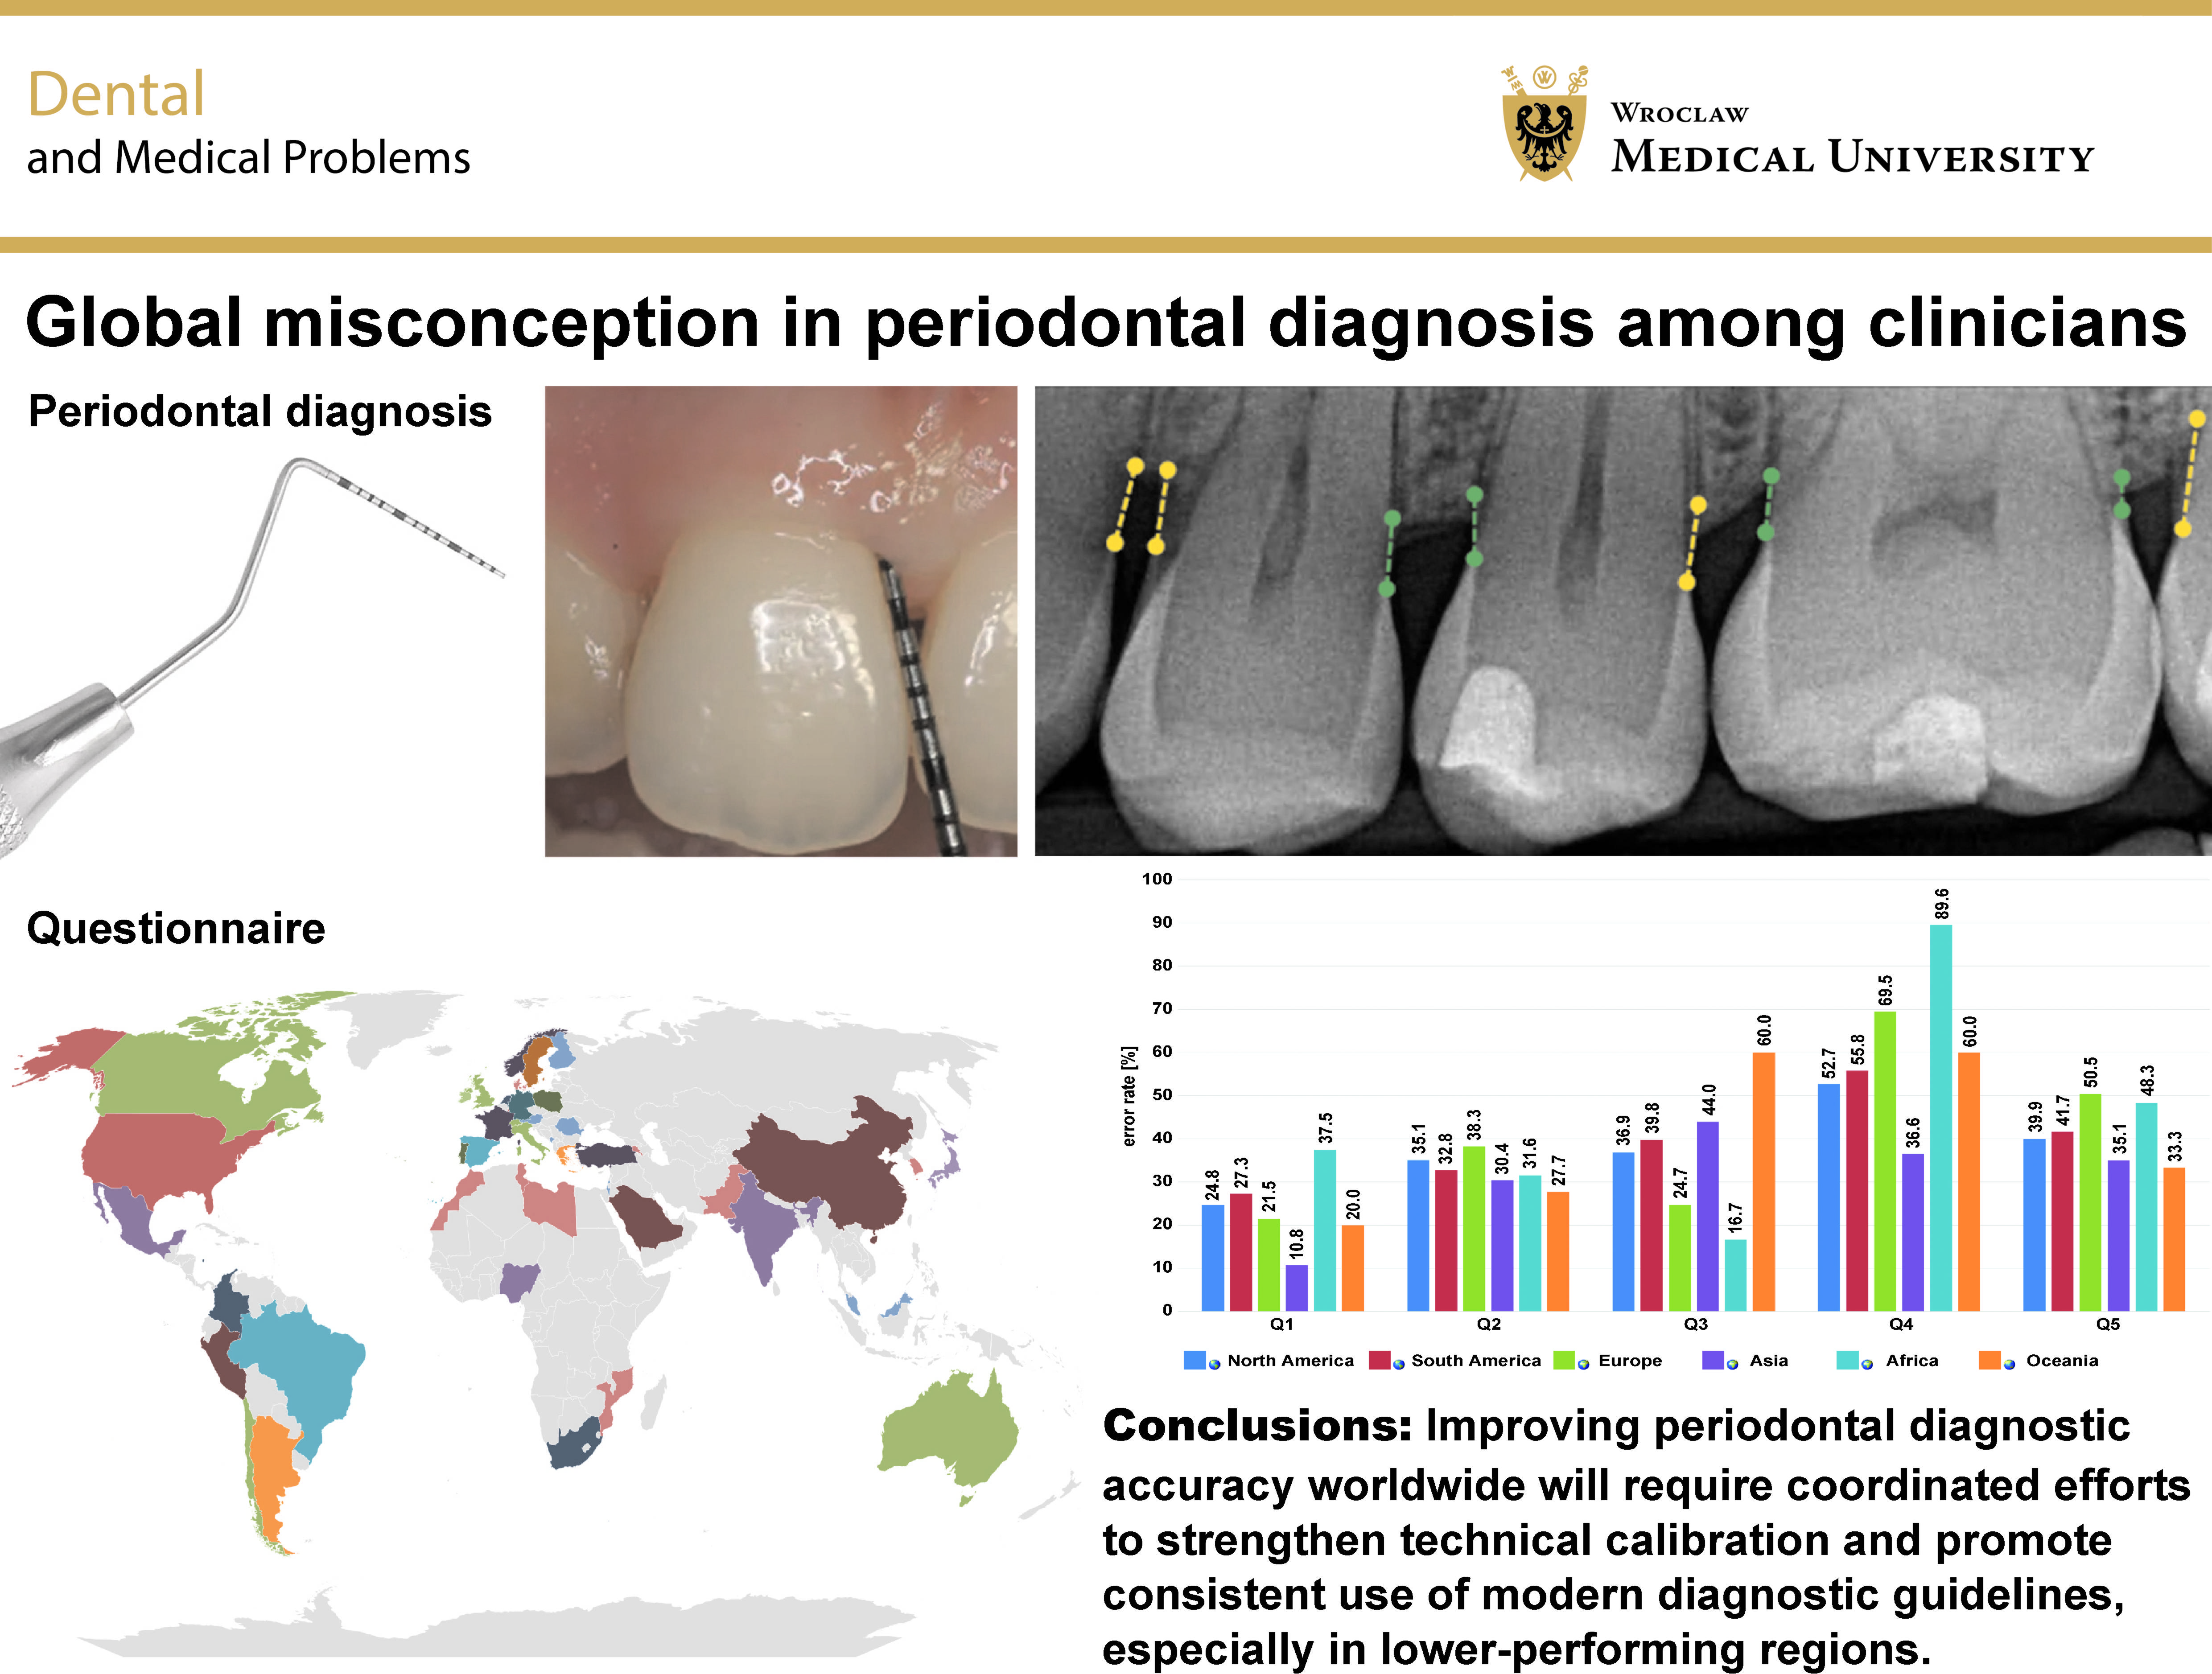
Conclusions. This global analysis revealed substantial differences in periodontal diagnostic performance across continents, countries and professional groups. However, the errors followed a consistent and structured pattern. Specialists and dental hygienists outperformed general dentists and students, especially in the more interpretive questions. The findings suggest that improving periodontal diagnostic accuracy worldwide will require coordinated efforts to strengthen technical calibration and promote consistent use of modern diagnostic guidelines, especially in lower-performing regions.
Keywords: periodontics, questionnaire, diagnosis, survey
Introduction
In the context of periodontal disease, parameters such as clinical attachment level (CAL), radiographic bone loss (RBL) and periodontal probing depth (PD) are essential for both diagnosis and treatment planning.1, 2 However, inaccuracies in measuring these parameters can lead to significant ethical issues, including potential insurance fraud. This phenomenon occurs when clinicians intentionally present exaggerated or falsified clinical data to secure unnecessary procedural reimbursements. The precision in assessing these parameters is paramount, as it directly influences patients’ perceived severity of periodontal disease. Numerous studies have highlighted the significance of accurate measurements, noting that discrepancies can arise from factors such as examiner experience, the type of radiographic technique and measurement precision.1, 3, 4
The utilization of advanced imaging techniques, particularly panoramic radiographs and artificial intelligence (AI)-assisted analyses, has been evaluated for their efficacy in assessing RBL.5 Research suggests that while this technique provides valuable insights, it is still susceptible to errors. Panoramic radiographs can often underestimate bone loss due to the presence of distortions, leading to a misrepresentation of a patient’s periodontal status and possibly resulting in fraudulent claims for treatments that may not be necessary.6, 7 Conventional intraoral radiographs, particularly bitewing radiographs, have been recognized to outperform panoramic views in certain assessments, emphasizing the importance of selecting appropriate imaging methods to ensure accurate diagnostics.7, 8 Editorial guidelines for accurate periodontal and radiographic evaluation have been recently published.9, 10, 11
The measurement of periodontal PD, while essential, involves an intrinsic margin of error dependent on the clinician’s technique and the measurement tools used. Some clinicians consider PD to be the only parameter for evaluating periodontitis, underestimating the relevance of pseudopockets, CAL and RBL. Studies on PD highlight that variability can occur, impacting the accuracy of the data collected.7, 12 For example, excessive probing force can distort readings, leading to inflated PD values and further complicating the clinical picture. This inherent variability can be exploited for fraudulent purposes. Clinicians may misrepresent the severity of periodontal disease based on inflated PD readings to justify costly interventions,13, 14 highlighting the need for patient-centered assessment.
Clinical attachment level is considered one of the most important parameters for the evaluation of periodontal health, often utilized alongside PD. This parameter quantitatively reflects the periodontal support around teeth, offering insights into disease progression.15, 16 Inaccurate CAL readings caused by methodological discrepancies can culminate in misleading assessments of a patient’s periodontal condition, rendering diagnoses susceptible to manipulation for unethical financial gain. An editorial guiding clinicians on how to accurately assess CAL has been recently published.11 Radiographic bone loss represents the second most essential parameter, which normally confirms and matches the results obtained for CAL. In specific cases, however, concordance between CAL and RBL may not be observed. This discrepancy can occur, for example, when more than 3 teeth are affected in the buccal area, in the presence of 5-mm PD, or furcation involvement without interdental bone loss. Such practices highlight the need for vigilant clinical protocols that incorporate multiple periodontal parameters rather than relying exclusively on PD measurements.12, 17
Furthermore, the implications of insurance fraud related to periodontal assessment extend beyond fraudulent claims. They have the potential to erode trust in healthcare providers, cause iatrogenesis, and impair the integrity of clinical data used in research and public health decision-making. The 2017 World Workshop for Classification of Periodontal and Peri-implant Diseases and Conditions emphasized the importance of accurate endpoint determination in periodontal therapy, underscoring the importance of accurate clinical measurements for ethical treatment provision.18 A critical review was published recently, revisiting parameters for periodontitis, and a recent editorial provided guidelines for a more accurate evaluation.1, 11
To address the prevalence of inaccuracies and potential fraud in periodontal measurements, integrating technology, such as computer-assisted diagnostic systems,19 can be pivotal. Innovative methods, including new algorithms, deep learning and AI, are increasingly used to enhance the precision of RBL assessments as they minimize human error inherent in manual interpretations.6, 20 These systems could help standardize measurements to facilitate automatic diagnostic support, thus elevating the reliability of clinical data and reducing opportunities for unethical practices.
Hence, the assessment of fundamental periodontal parameters is a critical aspect of periodontal diagnosis and treatment. However, inaccuracies in measuring PD, CAL and RBL can lead to significant consequences. Periodontal practitioners must adhere to standardized methodologies and leverage advances in technology to ensure precise assessments, ultimately protecting the ethical standards of periodontal practice and the well-being of patients. In this context, the aim of this study was to develop a questionnaire to assess basic periodontal knowledge among dentists, dental students, dental hygienists, and specialists in periodontics worldwide, in order to identify patterns and clinical standards around the globe.
Material and methods
A total of 3,328 dentists, dental students, dental hygienists, and specialists in periodontics from more than 60 countries were invited to participate in the study between September 1 and October 23, 2025. The invitees received e-mails containing a link (http://tiny.cc/perio) to access the survey. A questionnaire comprising 5 simple periodontal questions was developed using Google Forms (Google LCC, Mountain View, USA). The average time required to complete the survey was 2–5 min. The participants were divided into 2 groups: specialists in periodontics and dental hygienists (S-DHs); and dentists and dental students (D-Ds).
Sample size calculation
The sample size was calculated for a single proportion estimate. Means were compared using standardized effect sizes. Considering the population of 3,328 professionals who were invited to participate, an α level of 0.05 (two-sided), standard Z-values (Zα/2 = 1.96; Zpower ≈ 0.84 for 80% power), and a 95% confidence interval (CI) with p = 0.5 for worst-case proportion estimates, the required sample size was estimated using a margin of error of ±5%. The minimum required sample size was approx. 344 responses. Therefore, to estimate proportions with a 95% CI and a precision of ±5%, at least 344 valid responses were required. In practical terms, for approx. 3,300 invitations, the target sample size was set at ≥350 completed responses, corresponding to an expected response rate of about 10.5%.
Questionnaire
The following questions, some of which allowed multiple responses, were developed for the survey based on basic periodontal knowledge:
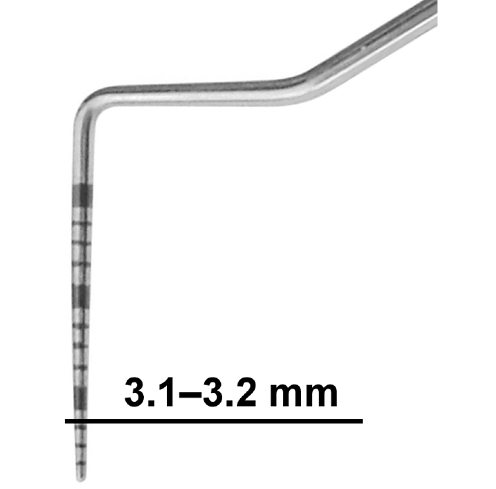
• Question 1 – probing measurements8, 21: When you are recording periodontal probing depths, what is your approach if the measurement falls between two marks on the probe, with the gingival margin close to the 3-mm mark (in this case, 3.1 mm/3.2 mm) (Figure 1)? (one answer could be selected; however, both B and C were accepted as correct answers)
A. Always round up to the next millimeter;
B. Always round down to the lower millimeter;
C. Always record exactly as seen (to the nearest millimeter mark on the probe).
• Question 2 – diagnostic parameters9, 10, 11, 21, 22: Which of the following parameters do you consider essential for diagnosing periodontitis in daily practice? (select all that apply; correct answers – A,B,C)
A. Radiographic bone level;
B. Periodontal probing depth;
C. Clinical attachment level;
D. Patient risk factors (e.g., smoking, diabetes, family history);
E. Bleeding on probing;
F. Tooth mobility.
• Question 3 – clinical experience vs. guidelines1, 23, 24: How do you balance clinical experience/judgment with evidence-based guidelines (e.g., 2017 AAP/EFP Periodontal Classification) when making a periodontal diagnosis? (correct answer – A)
A. Primarily follow standardized guidelines;
B. Primarily rely on clinical experience.
• Question 4 – importance of PD1, 9, 10, 11, 21, 22, 25, 26: In your opinion, how important is probing depth in the diagnosis and staging of periodontal disease compared with other parameters? (correct answer – C)
A. The most important parameter;
B. Not critical;
C. Helpful, but secondary to other factors;
D. Equally important as CAL and radiographs.
• Question 5 – radiographic assessment1, 11, 22, 26, 27, 28: When evaluating radiographs for periodontal diagnosis, which approach best reflects your practice? (select all that apply; correct answers – B,C,E)
A. Use panoramic radiographs for screening, with periapicals for detailed diagnosis;
B. Combine radiographic findings with probing data before reaching a diagnosis;
C. Evaluate horizontal and vertical bone loss patterns;
D. Assess the alveolar bone crest relative to the cementoenamel junction (CEJ) on periapical radiographs;
E. Assess alveolar bone crest relative to the CEJ on bitewing radiographs.
Internal validity of the questionnaire
Three main aspects of validity were considered:
• Content validity: Do the questions cover the domain being investigated?
• Construct validity: Do the questions effectively measure the intended concepts (e.g., diagnostic approaches, clinical reasoning)?
• Face validity: Do the questions appear logical and relevant to respondents (dentists, specialists in periodontics, dental students, and dental hygienists)?
Question 1 (probing measurements) demonstrated high content validity, as it directly addressed a controversial yet clinically relevant issue (rounding vs. exact recording). It reflects an important aspect of daily clinical practice and calibration among professionals from different countries. Question 2 (diagnostic parameters) exhibited strong content and construct validity by covering the essential diagnostic elements used internationally in periodontal assessment. Moreover, the multiple-response format enabled to capture different diagnostic approaches. Question 3 (clinical experience vs. guidelines) demonstrated strong construct validity because it directly evaluated how clinicians balance personal experience with evidence-based standards. The responses provided insight into global variability in the adoption of the 2017 American Academy of Periodontology/European Federation of Periodontology (AAP/EFP) classification (current classification). Question 4 (importance of PD) demonstrated good validity, considering that PD is central, although debated, parameter compared with CAL and RBL. This question captured the importance clinicians attribute to PD in periodontal diagnosis. Question 5 (radiographic assessment) exhibited high validity because it reflected current diagnostic practices worldwide and differentiated between approaches (panoramic vs. periapical vs. bitewing, bone crest vs. CEJ, etc.).
The overall validity of the questionnaire was robust and highly valid for exploratory research into periodontal diagnostic standards and education worldwide. The questions were relevant to the study subject and understandable to the target audience. Content validity was supported by adequate coverage of PD, diagnostic parameters, clinical reasoning, and radiographic evaluation. Construct validity was also strong, with each question targeting a measurable construct, such as diagnostic accuracy, reliance on PD or adherence to clinical guidelines.
Data preparation (weighted scores)
Weighted scoring was employed. The primary weighting factor was the total number of participants from each country, acknowledging that estimates derived from larger sample sizes are more precise and should be accorded greater weight in the analysis than those obtained from smaller and more volatile samples. The initial approach for calculating the weighted overall score was considered using the following formula:
weighted overall score = Σ (s × n) / Σ × ntotal
where:
s – score obtained for a specific country;
n – number of participants from that country;
ntotal – total number of participants.
However, this formula calculates a grand mean across all responses, which is optimal for characterizing an overall global performance but less suited for ranking individual countries based on their own demonstrated proficiency. Therefore, to enable country-level comparisons while still accounting for data reliability, an alternative method was implemented. This procedure involved calculating a country-level weighted percentage according to the following steps:
• Calculation of the average question score: For each country and each of the 5 questions (Q1–Q5), a single score was calculated as the arithmetic mean of the corresponding D-Ds and S-DHs scores:
QAvg = (D-Ds score + S-DHs score)/2
• Estimation of total wrong responses: The average question score was interpreted as the proportion of incorrect responses. The total number of incorrect responses for each country across all 5 questions was calculated as follows:
Total_Wrong = (Q1Avg + Q2Avg + Q3Avg + Q4Avg + Q5Avg) × n
• Calculation of total possible responses: The total number of possible responses for each country was calculated according to the following formula:
Total_Possible = 5 × n
• Derivation of the overall weighted percentage: The final performance metric for each country was computed as the ratio of the estimated total number of wrong responses to the total number of possible responses:
weighted overall score = Total_Wrong/Total_Possible
= (Q1Avg + Q2Avg + Q3Avg + Q4Avg + Q5Avg)/5
The final metric mathematically corresponds to the arithmetic mean of the 5 average question scores. Although arithmetically equivalent to a simple average, this metric remains conceptually grounded in the underlying participant-level data. This approach takes into consideration the weight of the evidence from each country, providing a solid foundation for subsequent comparative ranking. Countries with a participant count below a predefined threshold (n < 16) were excluded from the final ranking of the 10 lowest-performing countries to mitigate the influence of estimates with high variability.
Statistical analysis
Normality of percentage distributions for each question (Q1–Q5) and professional group (dentists vs. specialists) was assessed using the Shapiro–Wilk test. Since most of the datasets failed the normality test (p < 0.05), non-parametric tests were employed. Comparisons between dentists/dental students and specialists/dental hygienists for each question were conducted using the Wilcoxon signed-rank test (paired by country). Within-group differences among the 5 questions were analyzed using the Friedman test, followed by Wilcoxon pairwise post hoc test with Bonferroni correction. Differences between the countries for each question were evaluated using the Kruskal–Wallis test, followed by Dunn’s post hoc test with Holm’s correction. Median values and interquartile ranges (IQRs) were used to describe central tendency and dispersion. All analyses were conducted in Python (SciPy 1.13.0 and scikit-posthocs 0.9.0).
Results
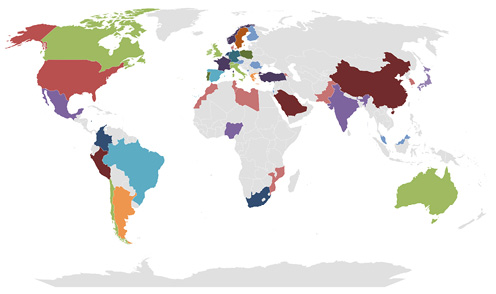
A total of 543 participants from 46 countries (Figure 2) completed the survey (response rate: 16.32%). The sample comprised 266 individuals in the S-DHs group, including 231 specialists in periodontics and 35 dental hygienists, and 277 participants in the D-Ds group, including 185 dentists and 92 dental students (Figure 3). Overall, specialists and dental hygienists demonstrated better performance across the majority of the questions.
Error rates across continents
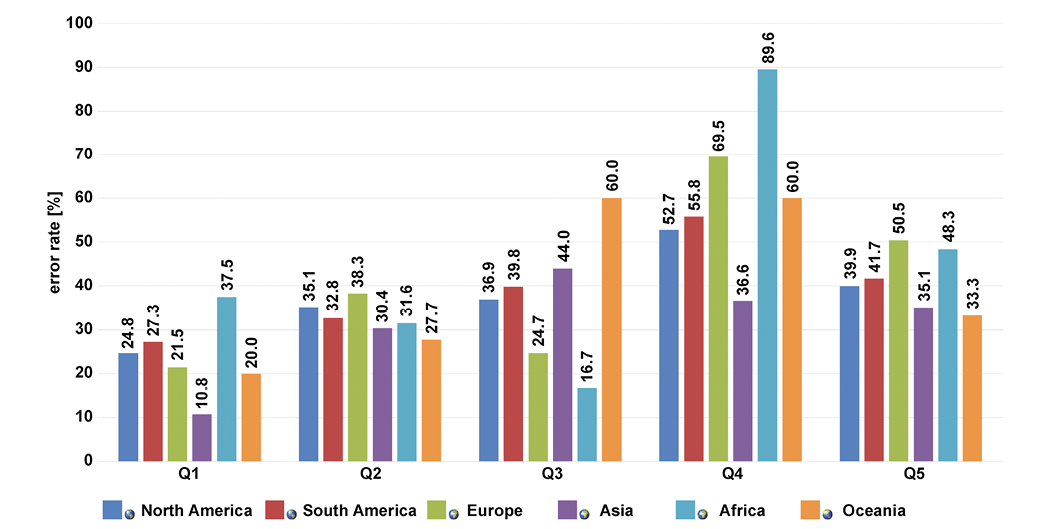
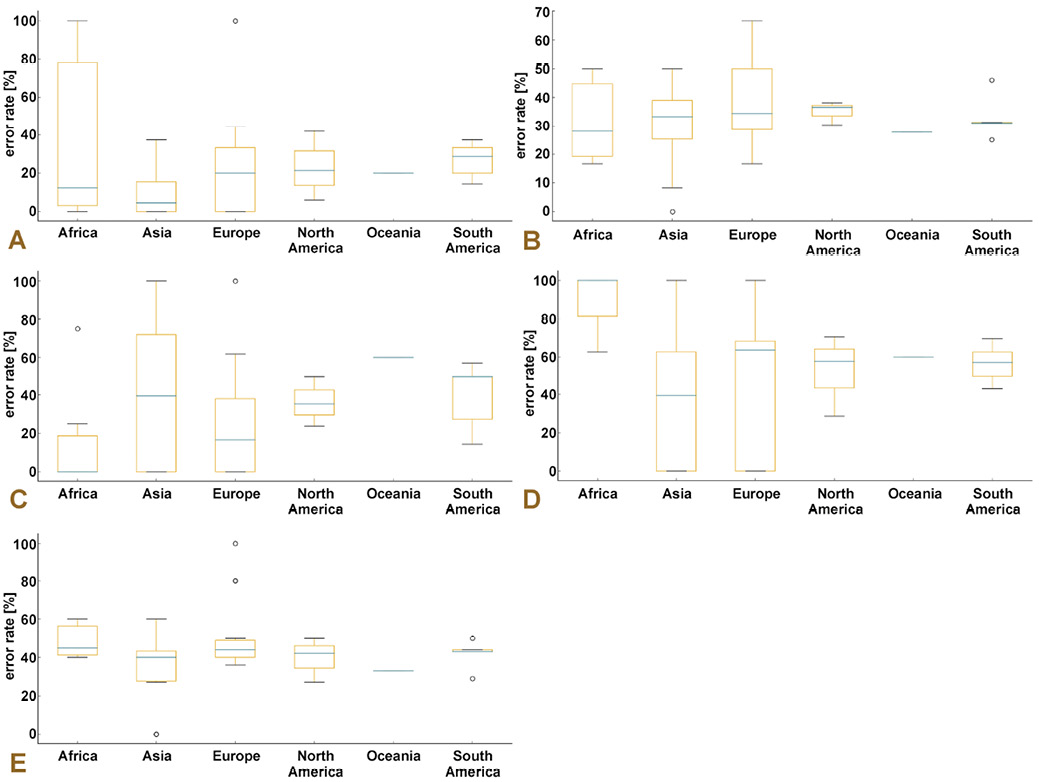
Continental comparisons revealed substantial variability in diagnostic accuracy across all 5 questions (Figure 4, Figure 5, Figure 6). Overall, 2 consistent patterns emerged from the data: (1) the distribution of errors varied markedly across continents; (2) Oceania and Africa repeatedly exhibited elevated error rates, in some cases doubling those observed for Europe or Asia. These broad trends reflect the heterogeneity identified in the global statistical analyses. The strongest geographic heterogeneity was observed for Q1 and Q5, both highly significant at p < 0.001, confirming marked intercontinental differences in error rates. Questions 2 (p = 0.004) and 3 (p = 0.008) also showed significant intercontinental variation, although with smaller effect sizes.
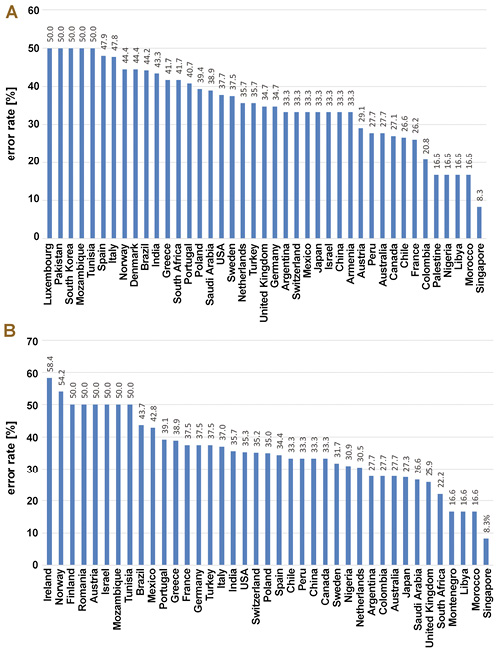
For Q1, error rates ranged from 10.8% in Asia to 37.5% in Africa, with Europe (21.5%) and Oceania (20.0%) showing comparatively lower proportions of incorrect responses. This nearly 27-percentage-point spread illustrates pronounced continental divergence and visually reinforces the highly significant Kruskal–Wallis result for this question (p < 0.001).
Question 2 showed more moderate variation, with error rates ranging from 27.7% in Oceania to 38.3% in Europe. North America (35.1%) and South America (32.8%) occupied intermediate positions. This pattern closely mirrored the moderate but statistically significant heterogeneity identified by the Kruskal–Wallis analysis (p = 0.004).
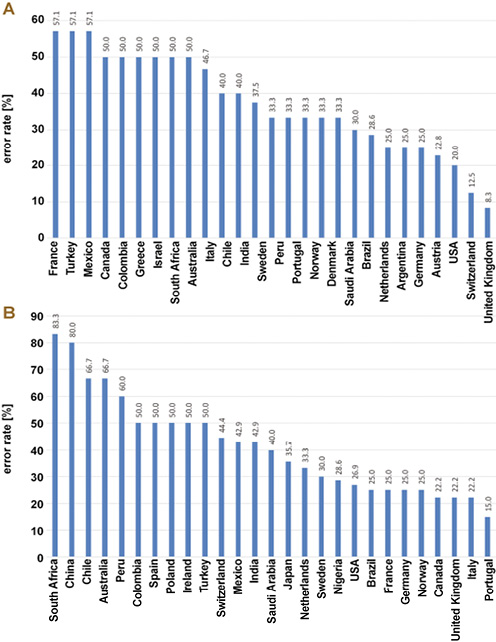
Question 3 demonstrated one of the greatest intercontinental differences, with error rates ranging from 16.7% in Africa to 60.0% in Oceania, and Europe remaining relatively low at 24.7%. North America and South America displayed intermediate error rates of 36.9% and 39.8%, respectively. This wide dispersion of over 40 percentage points aligned with the significant cross-national variability observed for Q3 in the larger sample and mirrored the moderate heterogeneity (p = 0.008) found in the global statistical analysis.
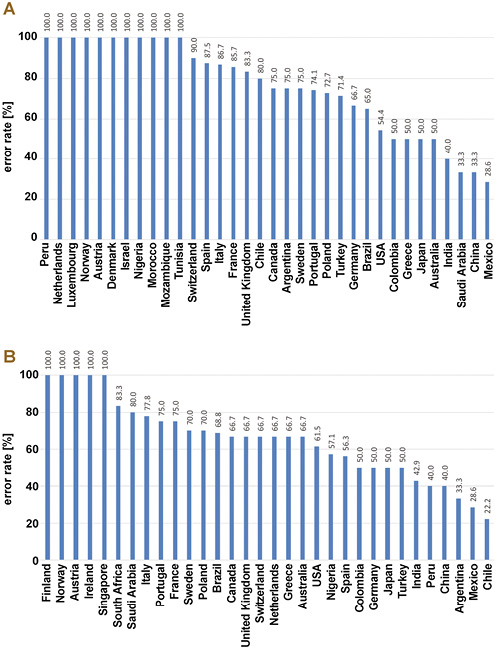
The greatest regional divergence was observed for Q4, with error rates of 89.6% in Africa, 69.5% in Europe, 60.0% in Oceania, 55.8% in South America, 52.7% in North America, and only 36.6% in Asia. Although these differences are striking visually, Q4 did not reach statistical significance globally (p = 0.063), presumably because high within-country variability diluted continent-level contrasts.
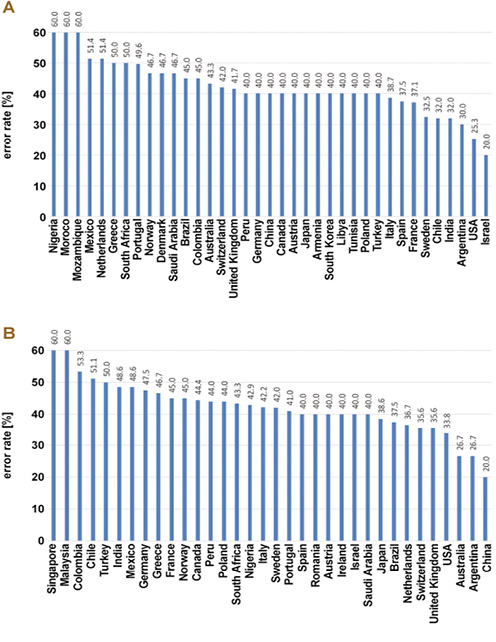
For Q5, error rates ranged from 33.3% in Oceania to 50.5% in Europe, with North America (39.9%), South America (41.7%) and Africa (48.3%) occupying intermediate positions. The distribution reflected moderate but clear variation and corresponded well with the highly significant Kruskal–Wallis result (p < 0.001). Although Q5 demonstrated moderately high error rates across all continents, regions that performed poorly on other questions, particularly Oceania and Africa, also tended to show elevated error rates on this question. Across all 5 questions, Europe and Asia formed the most stable, low-error clusters, whereas Oceania and Africa more frequently occupied the upper extremes of incorrect response frequencies.
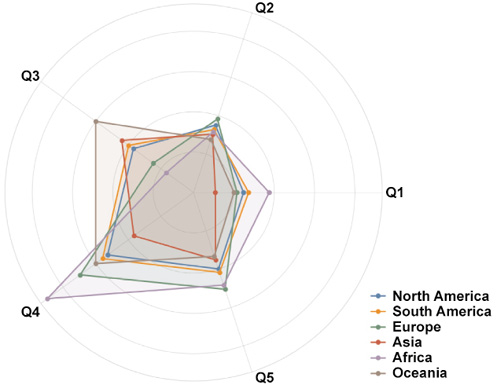
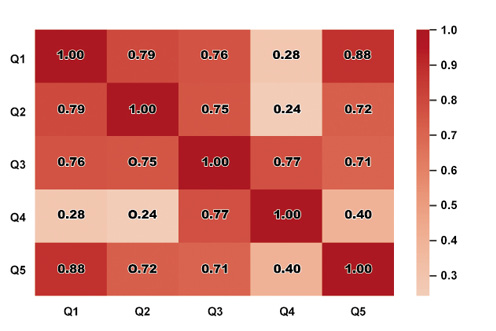
Intercontinental correlation of error rates
The intercontinental correlation matrix revealed substantial consistency in the pattern of incorrect response frequencies across questions (Figure 7). Most question–pair correlations were high and positive (r ≈ 0.70–0.90), indicating that continents that performed poorly on one question also tended to perform poorly on several others. The strongest associations were observed between Q1 and Q5 (r = 0.88) and between Q1 and Q2 (r = 0.79), indicating a shared underlying pattern of difficulty across regions. These items emphasize foundational aspects of clinical measurement and diagnostic interpretation, specifically probing measurement (Q1), essential diagnostic criteria (Q2) and radiographic assessment practices (Q5). The strong alignment across continents implies that misunderstandings or inconsistencies in these fundamental diagnostic elements may represent a globally shared challenge among clinicians.
One notable deviation from this overall trend was Q4, which showed markedly weaker correlations with Q1 (r = 0.28) and Q2 (r = 0.24). This finding suggests that Q4 assessed a distinct knowledge domain or cognitive skill, in which the clinician’s perspective on the importance of PD varied independently of their performance on more technical or procedural questions. Nevertheless, Q4 exhibited a moderately strong correlation with Q3 (r = 0.77), suggesting partial alignment with the cluster of items demonstrating higher cross-regional error synchrony and partial overlap with the domain of clinical judgement and guideline interpretation.
Overall, the correlation structure indicates that global differences in performance were not random but instead followed a coherent pattern. Distinct types of knowledge gaps or misconceptions may explain variations in incorrect response rates across continents.
Specialists/dental hygienists vs. dentists/dental students
When comparing the number of incorrect responses between D-Ds and S-DHs (Table 1), the S-DHs group demonstrated significantly fewer errors in 3 of the 5 questions (Q1, Q3 and Q5). These differences reached statistical significance in the Wilcoxon paired tests (p = 0.032, p = 0.012 and p = 0.041, respectively). Questions 2 and 4 displayed non-significant trends favoring the S-DHs group. This pattern indicates greater diagnostic accuracy among S-DHs, particularly on items with greater conceptual or interpretive demands.
Within-group analyses revealed distinct response patterns between the 2 groups (Table 2). The D-Ds group showed pronounced internal variability, with significantly higher error rates for Q1 compared with Q3 (p = 0.014) and Q5 (p = 0.021). Consequently, it can be implied that the clinical content of Q1 posed particular challenges for D-Ds. In contrast, the S-DHs group demonstrated fewer internal differences across questions, although a modest but significant difference emerged between Q2 and Q5 (p = 0.038), indicating a narrower range of perceived question difficulty within this group.
Cross-national comparisons
Cross-national comparisons demonstrated substantial heterogeneity in error rates across most questionnaire items (Table 3). The Kruskal–Wallis test showed highly significant differences among countries for Q1 and Q5 (both p < 0.001), as well as moderate but statistically relevant variation for Q2 and Q3. Question 4 exhibited a non-significant trend (p = 0.063), suggesting a relatively similar level of performance across countries. These findings indicate that contextual factors, such as differences in educational curricula, clinical exposure or diagnostic philosophies, may meaningfully influence diagnostic accuracy among respondents.
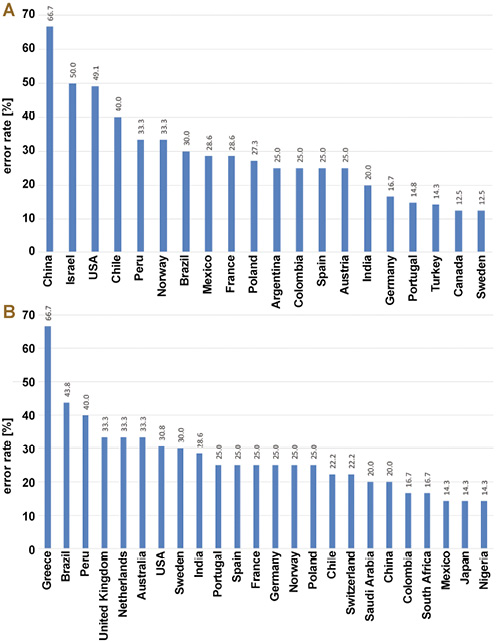
Top-10-country subset (highest error rates)
The global pattern remained consistent when the analysis was restricted to the top 10 countries with the highest mean percentages of incorrect responses. In this subset, S-DHs continued to outperform D-Ds, with statistically significant differences identified for Q1, Q3 and Q5 in the Wilcoxon analyses (Table 4). The within-group Friedman tests confirmed that dentists and dental students from these high-error countries showed significant variation across questions, whereas the S-DHs group did not reach statistical significance, suggesting more uniform performance (Table 5).
The Kruskal–Wallis analyses across the top 10 countries confirmed the presence of cross-national variability (Table 6). Questions 1 and 5 continued to demonstrate the strongest heterogeneity (p = 0.001 and p < 0.001, respectively). Question 2 presented moderate differences, and questions 3 and 4 showed no significant variability. These patterns mirror the overall dataset and confirm that certain diagnostic items elicit markedly different interpretations across country-level contexts.
Table 7 presents the 10 countries with the highest overall error rates among all possible responses. The mean overall error rate was 39.8 ±3.8%. Question 4 was the most challenging among the top 10 countries, with incorrect response rates ranging from 58.0% to 82.2%. Even the most robust countries encountered significant challenges in addressing this particular question. Question 3 was considered a key differentiator, and Poland (#1 rank) was heavily influenced by its score performance in Q3 (65.9%). Overall, the 10 countries demonstrated consistently high average error rates across all questions, without a single strong area, with the exception of Italy and Canada in question 1.
To better visualize the results, the percentages of incorrect responses for each question were categorized by country and presented in descending order in Figure 8, Figure 9, Figure 10, Figure 11, Figure 12. The outliers were removed from the figures.
Pearson correlation coefficients (r) between question scores are presented in Table 8. This coefficient ranges from −1 (perfect negative correlation) to 1 (perfect positive correlation), with 0 indicating no linear relationship. The correlation matrix revealed distinct clustering patterns and relationships among the questions, as follows:
• strong positive correlations:
– Q1 & Q2 (r = 0.73): countries with high error rates for Q1 also tended to have high error rates on Q2, suggesting that these questions may reflect similar underlying knowledge domains or cognitive skills;
– Q2 & Q5 (r = 0.68): performance on Q2 was a good predictor of the performance on Q5, and vice-versa;
– Q4 & Q5 (r = 0.71): the strongest correlation among the latter questions. Countries with high error rates for Q4 also tended to demonstrate high error rates for Q5, indicating that the questions were closely linked in terms of required knowledge;
• moderate positive correlations:
– Q1 & Q5 (r = 0.52): a moderate link exists between the first and final questions;
– Q1 & Q4 (r = 0.44) and Q2 & Q4 (r = 0.42): these results suggest a tentative connection between the knowledge tested in the first 2 questions and that in Q4;
• weak or no correlations:
– Q3 & all other questions (r < 0.4): Q3 demonstrated the weakest relationships with all other questions, with r-values of 0.31, 0.25, 0.18, and 0.37. This critical finding indicates that Q3 measured a distinct and independent knowledge domain. A country’s performance on Q1, Q2, Q4, or Q5 is a very poor predictor of its performance on Q3.
Inter-question correlation
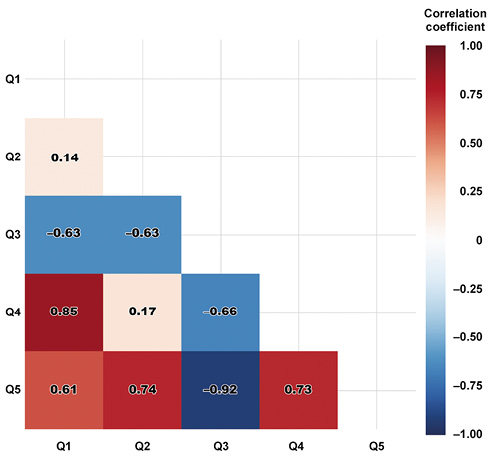
The inter-question correlation matrix demonstrated a more complex interaction among questionnaire items when analyzed at the participant level (Figure 13). Unlike the continent-level analyses, several question pairs produced negative correlations, indicating that participants who answered one question incorrectly were more likely to answer another correctly.
Negative associations were especially prominent for Q3, which correlated inversely with Q2 (r = –0.63), Q4 (r = –0.66) and Q5 (r = –0.92). These strong negative relationships suggest that Q3 assesses a concept or skill fundamentally distinct from the others, such that misunderstanding in that domain may coincide with greater accuracy elsewhere. This pattern indicates that participants who struggled with Q3 often performed better on questions more closely linked to procedural or technical diagnostic components.
Conversely, Q4 showed a strong positive association with Q1 (r = 0.85), as well as moderate positive relationships with Q2 (r = 0.17) and Q5 (r = 0.73). This pattern indicates that Q4 clustered with items relying on similar reasoning patterns or conceptual frameworks. Questions 1, 4 and 5 formed a distinct, positively correlated cluster (r ≈ 0.61–0.85), reflecting alignment among precision-probing practices, the perceived importance of PD and radiographic interpretation strategies. Collectively, these items represent technical aspects of diagnosis. Their positive associations imply that competence or conceptual clarity in one of these domains tends to coincide with similar accuracy in the others.
Taken together, these results reveal 2 major latent structures: cluster involving Q1, Q2, Q4, and Q5, which tend to rise and fall together; and another cluster centered on Q3, which behaves inversely relative to the remaining questions. This two-cluster structure suggests that the questionnaire captured at least 2 distinct underlying competencies or misconception profiles.
Overall, the observed patterns indicate the presence of at least 2 latent constructs underlying clinician diagnostic behavior: a technical/procedural dimension involving probing measurement, parameter prioritization and radiographic interpretation; and a cognitive-judgment dimension involving integration of clinical experience with formal guidelines.
Discussion
The present study explored basic concepts of periodontal assessment, aiming to evaluate global baseline knowledge in periodontics and to identify common diagnostic patterns and clinical standards. Overall, the survey indicates that, despite substantial variability in training backgrounds and practice settings, clinicians largely adopt guideline-concordant, evidence-based approaches to periodontal diagnosis. Respondents favored conservative, reproducible probing strategies – either rounding measurements up or down or recording them as read – rather than overestimating disease severity (Q1), and consistently prioritized the triad of RBL, PD and CAL as essential diagnostic parameters (Q2). Most participants reported following contemporary classification systems, particularly the 2017 AAP/EFP framework (Q3),22 while recognizing PD as relevant but not a standalone or primary metric for detecting periodontitis (Q4), instead placing it within a broader diagnostic context. Interestingly, Q4 elicited the highest proportion of incorrect responses, with many participants rating PD as equally important as CAL and RBL. Radiographic assessment (Q5) was also approached in an integrated and systematic manner, combining imaging with probing data and emphasizing the evaluation of bone loss patterns and the relationship between the alveolar crest and CEJ, especially on bitewing radiographs. However, about half of the participants did not correctly interpret radiographic images for the diagnosis of periodontitis.
Although the survey response rate of 16.32% exceeded the target sample size required for the desired margin of error, it raises important considerations regarding selection bias and the generalizability of the results. The low response rate suggests that the 543 participants who completed the survey may represent a random sample of the 3,328 invited professionals. This introduces the potential for selection bias, which can impact the generalizability of the findings. In voluntary surveys, professionals who choose to participate are often those with greater interest in the subject matter (periodontics) or higher confidence in their knowledge. Consequently, respondents may have been more familiar with contemporary guidelines, such as the 2017 AAP/EFP classification system, and more competent in their diagnostic skills. In the presence of competence bias, the overall error rates observed (e.g., a mean overall score of 39.8%) may underestimate the actual global knowledge deficits and technical inconsistencies among the broader population of invited practitioners. Moreover, the impact on group comparisons, demonstrating that S-DHs consistently outperformed D-Ds, might be amplified if, for example, the D-Ds who responded were the least engaged in their group, while the S-DHs were the most engaged. Furthermore, influences on observed heterogeneity can introduce substantial variability in error rates across continents, countries and professional groups, and these differences are likely genuine. Still, their magnitude may differ in the overall population. The structured nature of the observed error patterns suggests that the underlying issues are real; however, the precise percentage differences may shift if a larger, more representative sample were obtained. In summary, while the sample size was statistically sufficient for the study’s primary goal (descriptive prevalence estimates at ±5% margin of error), the low response rate indicates that the results are most accurately generalizable to the subset of globally invited, more engaged professionals who chose to complete the questionnaire, rather than to the entire population of invited experts. Future studies should, therefore, aim to achieve higher participation rates to validate these findings.
Taken together, the findings of the present study suggest that current periodontal diagnostic behavior among most respondents is broadly in line with accepted practices. At the same time, they highlight the need to reinforce, disseminate and implement standardized diagnostic protocols globally and to build upon the existing foundation to refine future educational and calibration efforts.1, 11, 19
A critical dual-level analysis provided further insight into how clinicians conceptualize and apply diagnostic principles. The strong positive correlations among continents demonstrate that, across widely disparate educational systems and clinical cultures, shared difficulties in basic diagnostic tasks exist. The clustering of questions 1, 2 and 5 suggests that uncertainty in probe-based measurements, selection of essential diagnostic parameters, and radiographic evaluation are not isolated problems but interconnected elements of a global diagnostic pattern. These results indicate that technical inconsistencies in basic clinical procedures remain an entrenched problem. For example, the high intercontinental concordance in responses to Q1 indicates that uncertainty regarding probe markings, such as interpretation of 3.1–3.2-mm readings, is common worldwide. Similarly, the linked responses to questions 2 and 5 suggest persistent confusion regarding the diagnostic parameters clinicians consider most important and the interpretation of radiographic findings in relation to those parameters. This global synchrony indicates that efforts to standardize education might have a far-reaching impact.1
In contrast, the weaker association of Q4 with the other items introduces an important nuance: although PD is an important clinical variable, it should remain subordinate to CAL and RBL in the classification of periodontitis.1 The data suggests that clinicians do not uniformly conceptualize PD in this hierarchical manner and may underestimate the influence of gingival inflammation, which could lead them to overestimate PD and, by extension, the severity of the disease. Supporting this interpretation, questions 3 and 4 are moderately related, suggesting that perceptions regarding the importance of PD are partly determined by broader diagnostic philosophy – that is, how clinicians trade off reliance on formal guidelines against personal clinical judgment. This relative independence may reflect the current debate surrounding the interpretation of PD in relation to CAL and RBL.1, 23
At the individual level, the negative correlations involving Q3 further underscore this philosophical divide. Respondents who found the question about balancing clinical judgment with evidence-based guidelines challenging tended to perform better on the more technical questions. This could indicate a subgroup of clinicians who confidently apply procedural skills but whose diagnostic practice is less aligned with normative diagnostic frameworks, including the 2017 classification system.22, 23, 26 In contrast, those who demonstrated conceptual clarity on Q3 may have been more critical or nuanced in interpreting the technical items, thereby creating different response patterns.
This divergence underscores a central tension in modern periodontal diagnosis: the integration of fine-grained clinical reasoning with standardized, guideline-driven pathways. Diagnostic competence cannot easily be placed along a single continuum; rather, the findings suggest a bifurcation into procedural competence and conceptual reasoning. Consequently, strategies for improving periodontal education should address both domains simultaneously.11 Training that enhances measurement precision but does not place the measurements within an appropriate conceptual framework cannot be expected to ameliorate the variability described in this study.
Taken together, these results suggest that clinicians’ diagnostic performance is the product of related but separable competencies. Correlation analyses support a two-construct model of diagnostic performance and underscore the need for focused training that aligns technical accuracy with evidence-based decision-making. Such findings have implications for more integrated education strategies that harmonize worldwide clinical practice with current periodontal standards while minimizing residual diagnostic disparities.
Geographical patterns further contextualize these observations. Questions 1, 3 and 4 demonstrated the greatest intercontinental dispersion. Africa and Oceania were consistently among the highest-error regions, while Europe and Asia were continuously in the mid-range. These trends suggest that diagnostic performance depends not only on individual training level but also on wider geographic and educational contexts, reinforcing the global heterogeneity identified at the country level. Clear differences were also observed between professional groups. The median error rates for S-DHs were consistently lower across countries, while those for D-Ds were more dispersed and exhibited more extreme outliers. Intercountry heatmaps revealed clusters of higher- and lower-performing countries. The results support the notion that national educational backgrounds shape diagnostic decision-making. Three principal patterns emerged from this data: S-DHs tended to outperform D-Ds across most diagnostic tasks; specific questions, particularly Q1 and Q5, highlighted striking educational or conceptual gaps; and diagnostic performance varied markedly across countries, reflecting the influence of varied training models, clinical guidelines and professional cultures.
Several factors limit this study. The number of participants per country was limited, potentially affecting the generalizability of comparisons at the country level. Moreover, the reliability and self-reported nature of the responses could not be fully verified. These limitations should be considered when interpreting findings and planning future, more comprehensive investigations.
This global analysis has demonstrated striking variation in periodontal diagnostic performance across continents, countries and professional groups; however, the observed pattern of errors was structured rather than random. Specialists and dental hygienists consistently outperformed general dentists and students, especially on questions requiring deeper interpretation. Correlation analyses indicated that most mistakes clustered within a shared technical domain – PD precision, selection of diagnostic parameters and radiographic interpretation – while the item addressing the balance between clinical judgment and evidence-based guidelines emerged as a separate, judgment-based construct. Collectively, these findings support a dual-competency model in periodontal diagnosis in which both technical/procedural skills and interpretive, guideline-based reasoning require reinforcement through education and calibration programs.
At the country level, the lowest-performing countries combined strong core knowledge, as reflected in Q1, Q2, Q4, and Q5, with a more independent domain assessed by Q3. The lowest 10 performances tended to accumulate errors across multiple technical items and showed weaker integration of contemporary classification systems and evidence-based frameworks into the participants’ responses, suggesting systemic gaps in training, dissemination of clinical guidelines or calibration opportunities.
Conclusions
Within the limitations of this study, the findings suggest that improving global knowledge of periodontal diagnosis will require coordinated efforts that balance technical calibration with the consistent adoption of modern diagnostic guidelines, especially in lower-performing regions.
To address the observed global disparities and the dual-competency gap in periodontal diagnosis, future educational strategies must simultaneously harmonize technical skills with conceptual reasoning. Several core areas warrant particular attention:
• enhancing technical calibration (procedural competence) with simulation-based training for PD precision: implementing “gold standard” calibration workshops using periodontal manikins with predefined measurements. Clinicians should repeatedly perform assessments until their readings consistently fall within a narrow tolerance range relative to the reference values, focusing on conservative strategies such as rounding down or recording exact measurements;
• standardized radiographic protocol training: implementing training modules focused on bitewing radiographs as the preferred method for the assessment of the alveolar bone crest relative to the CEJ, and further utilization of computer-assisted diagnostic systems and AI algorithms to provide instant feedback on manual RBL interpretations, minimizing human error and standardizing the process;
• technology integration for accuracy: integrating digital periodontal probes with pressure sensors to provide real-time feedback on correct probing force, thereby reducing the risk of inflated PD readings. Advanced software or 3D imaging (cone beam computed tomography (CBCT)) may further assist clinicians in visualizing vertical and horizontal bone loss patterns and furcation involvement that are difficult to interpret on 2D images;
• hierarchical case-based reasoning: education must shift toward using real-world case studies to demonstrate the hierarchical importance of diagnostic parameters explicitly. Clinical attachment level should be considered the most essential metric, followed by RBL, and then PD. Training should emphasize diagnosis primarily based on CAL and RBL, while positioning PD mainly as a monitoring parameter rather than a standalone metric for periodontitis;
• conceptual and philosophical integration: seminars should be used to facilitate discussion and help clinicians reconcile their personal clinical experience and judgment with formal evidence-based guidelines, such as the 2017 AAP/EFP classification system. The goal should be to contextualize clinical judgment within the standardized framework, bridging the central tension between technical confidence and guideline adherence;
• mandatory global dissemination: standardized continuing education programs focused on contemporary classification systems should be promoted internationally, especially in lower-performing regions identified in the present study. Implementing train-the-trainer models can accelerate the dissemination of consistent, evidence-based knowledge through local professional organizations worldwide.
Collectively, these coordinated efforts may strengthen both technical/procedural competence and interpretive, guideline-based reasoning, ensuring a more reliable and ethically sound global standard for periodontal practice.
Ethics approval and consent to participate
Not applicable.
Data availability
Not applicable.
Consent for publication
Not applicable.
Use of AI and AI-assisted technologies
Not applicable.