Abstract
Photogrammetry is a method of acquiring three-dimensional (3D) models by superimposing two-dimensional images. Since the publication of the last systematic review, many new articles concerning its use in dental practice have been published. This study aims to evaluate the accuracy and reproducibility of photogrammetry based on the available literature. Four databases (PubMed®, Web of Science, Google Scholar, and Embase) were searched using the following keywords: “photogrammetry”; “stereophotogrammetry”; “dentistry”; and “tooth implants”. The following eligibility criteria were applied: the study had to be published in a reliable journal, specify the type of measurements performed, and describe their accuracy or reproducibility. The Quality Assessment of Diagnostic Accuracy Studies (QUADAS-1) tool was used for the assessment of the risk of bias. The collected data was tabularized and classified into 3 groups based on the type of measurements performed and into 2 subgroups according to accuracy and precision. Forty-four articles were included in the final analysis. The reviewed articles showed that cephalometric measurements based on photogrammetry have high correlation coefficients and are accurate, with measurement errors below 1 mm. Photogrammetry was highly reproducible and more accurate than intraoral scanners (IOS) for assessing implant positions. Measurements of dental arches showed high intraclass correlation coefficients (ICCs) and high accuracy, with errors below 0.5 mm. The main limitation of this review is that most of the included studies were conducted in vitro; therefore, it was difficult to evaluate the applicability of photogrammetry in clinical practice. Photogrammetry appears to be a precise and accurate method for performing cephalometric measurements, assessing dental implant positions and measuring dental dimensions. However, further clinical studies are needed to evaluate its practical relevance.
Keywords: dental implants, dental measurements, cephalometry, stereophotogrammetry, three-dimensional models
Introduction
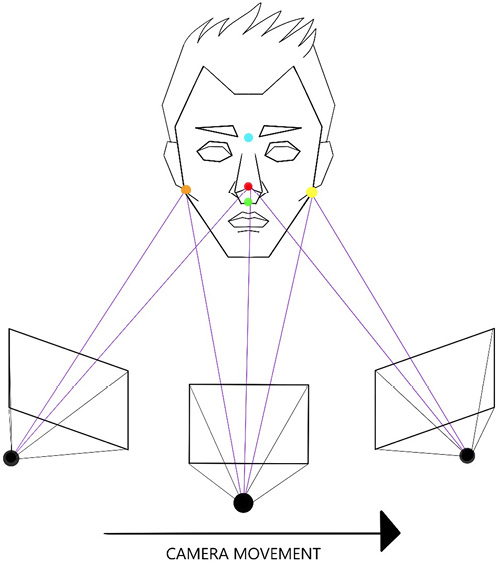
Photogrammetry is an innovative method of obtaining three-dimensional (3D) models that is constantly being developed.1, 2 It has been used in geography and architecture,3, 4 but has now become a part of medicine.5, 6 This technique enables the creation of 3D models from two-dimensional photographs. Images of particular objects are processed using dedicated software, which superimposes photographs taken from different perspectives and creates a 3D mesh with a realistic texture based on the mathematical principle of triangulation (Figure 1).2 Such 3D models can later be used to perform measurements or produce 3D prints.7, 8, 9
The main differences between conventional scanning methods, such as intraoral and extraoral scanners, and photogrammetric methods lie in the process of capturing and processing 3D models. Intraoral scanners (IOS) mainly use laser scanning technology that irradiates an object with a laser beam, which is then reflected back to the scanner, and calculate the angle and distance between the laser, sensor and the scanned object, allowing it to generate a 3D point cloud of the object.10 Extraoral scanners are based on structured light technology and project a geometric pattern onto the scanned object. A camera then captures the distorted pattern, on the basis of which a 3D model is generated.11 Photogrammetry, on the other hand, is based solely on photographs captured from multiple angles, which, as mentioned above, are processed to generate a 3D model.9
In dentistry, conventional methods, such as IOS, laser scanners and dental impressions obtained using impression trays, are commonly used for taking measurements of the oral cavity and face.12, 13, 14, 15 Photogrammetry has the potential to become a useful tool for the digitization of patients’ oral cavity data or an alternative to IOS for determining dental implant positions. Numerous studies have shown that it can be a less expensive alternative to IOS while being as accurate as conventional methods.16, 17, 18 Furthermore, the use of abutments that are screwed onto a patient’s implants, functioning as markers for photogrammetric machinery, allows their positions to be captured. Because the abutments are elevated above the gingiva, photogrammetry is not limited by the presence of blood or saliva, as is the case with IOS.19, 20 It is worth noting that this technology, although it has greater potential for capturing dental implant positions, is unable to capture adjacent structures, unlike IOS, which provide direct imaging of the patient’s oral cavity and do not require additional steps.21, 22
Photogrammetry can also be helpful in the digitization of patient information. Studies have shown that the use of photogrammetric techniques can accelerate the process of loading full dental arch prostheses by integrating photogrammetric 3D models of dental impressions with models obtained from cone beam computed tomography (CBCT).23, 24
Photogrammetry, when used to measure cephalometric parameters, can accurately predict the values obtained using traditional cephalometric methods, potentially limiting their use to areas of specific interest.25, 26, 27 It also provides a viable approach for objectively assessing changes in facial appearance following dental reconstruction.28
There has been a noticeable increase in the number of articles describing the use of photogrammetry in dentistry and maxillofacial surgery in recent years. Authors tend to focus on its application in prosthetic dentistry and anthropological measurements.16, 17, 18
Since the last systematic review assessing the accuracy and precision of photogrammetry in dentistry was published, many articles on this subject have emerged. Hence, a decision was made to conduct a systematic review that evaluates the use of photogrammetry in dentistry with the aim of improving the understanding and validation of its relevance in dental medicine. This review was structured based on the following PICO question: “How accurate and reliable are photogrammetric techniques, either used alone or compared with traditional methods, in dentistry?”
Material and methods
Eligibility criteria
Based on the Preferred Reporting Items for Systematic reviews and Meta-Analyses (PRISMA) guidelines,29 a description of the criteria used to assess the eligibility of each study for inclusion in our systematic review was prepared. To be included, an article had to:
• be an original study published in a scientific, peer-reviewed journal;
• be published in English;
• describe the type of dental, prosthodontic or cephalometric measurements performed using a photogrammetric technique;
• describe the accuracy or reproducibility of the abovementioned measurements.
This systematic review did not include articles for which full study data was unavailable, such as conference abstracts, or articles of uncertain publication status, for example, non-peer-reviewed preprints. Case studies and technical notes were also excluded.
Information sources
At the beginning of December 2023, 4 databases were searched: Embase; Google Scholar; PubMed®; and Web of Science. The first 2,000 articles sorted by relevance in Google Scholar were scoped, as this number has been shown to be sufficient for a systematic review.30 Although the cited study refers to only the first 200 results, the decision was made to extend the search in order to include studies that might not have been indexed in other databases, considering the novelty of the topic.
Due to the over 12-month time period between the primary search and manuscript submission, additional searches were conducted at the end of February 2025 to incorporate newly reported findings. Re-running searches before manuscript submission is necessary, according to the Cochrane Handbook for Systematic Reviews of Interventions – C37, to identify and incorporate the latest studies into the systematic review.31
Search strategy
During the database search, the following queries were used:
• PubMed®:
– (“photogrammetry”[MeSH Terms] OR “photogrammetry”[All Fields]) AND (“dentistry”[MeSH Terms] OR “dentistry”[All Fields] OR “dentistry s”[All Fields]);
– (“photogrammetry”[MeSH Terms] OR “photogrammetry”[All Fields]) AND “dental implants”[All Fields];
– (“photogrammetry”[MeSH Terms] OR “photogrammetry”[All Fields] OR “stereophotogrammetry”[All Fields]) AND (“dentistry”[MeSH Terms] OR “dentistry”[All Fields] OR “dentistry s”[All Fields]);
– (“photogrammetry”[MeSH Terms] OR “photogrammetry”[All Fields] OR “stereophotogrammetry”[All Fields]) AND “dental implants”[All Fields].
• Embase:
– (‘photogrammetry’/exp OR ‘photogrammetry’) AND (‘dentistry’/exp OR ‘dentistry’);
– (‘photogrammetry’/exp OR ‘photogrammetry’) AND (‘dental implants’/exp OR ‘dental implants’);
– (‘stereophotogrammetry’/exp OR ‘stereophotogrammetry’) AND (‘dentistry’/exp OR ‘dentistry’);
– (‘stereophotogrammetry’/exp OR ‘stereophotogrammetry’) AND (‘dental implants’/exp OR ‘dental implants’).
• Web of Science:
– Photogrammetry AND Dentistry (All Fields);
– Photogrammetry AND Tooth implants (All Fields);
– Stereophotogrammetry AND Dentistry (All Fields);
– Stereophotogrammetry AND Tooth implants (All Fields);
• Google Scholar:
– Photogrammetry AND Dentistry;
– Photogrammetry AND Tooth implants;
– Stereophotogrammetry AND Dentistry;
– Stereophotogrammetry AND Tooth implants.
Searches were not limited by language. We did not use any filters during the database search. For the re-run searches, a publication date filter was applied to include studies published since January 2024.
Considering the novelty of this review’s subject and PICO question, “photogrammetry” and “stereophotogrammetry” were used as keywords that would ensure the identification of articles regarding this specific topic, and “dentistry” was used as a broad MeSH and Emtree term allowing the identification of articles within this entire specialty. The keyword “dental implants” was introduced to identify studies regarding dental implant measurements. Although it is included in the “dentistry” MeSH tree, it is not included in the corresponding Emtree hierarchy; therefore, its use was necessary. This search strategy, along with the inclusion of the first 2,000 results from Google Scholar, although more time-consuming, was intended to increase sensitivity by using very broad terms.
Selection process
Four authors (OWP, JG, KM, WT) were responsible for title screening. Each of the 4 authors searched an assigned database: Google Scholar (OWP); Web of Science (JG); Embase (KM); and PubMed® (WT). All authors performed their searches independently. The articles with titles related to the use of photogrammetry in dentistry as a measurement method were collected. Duplicates among the retrieved articles were then removed using Mendeley software (Elsevier, London, UK). Articles retrieved by the other authors were reviewed by OWP, and articles retrieved by OWP were reviewed by JG.
Four authors (OWP, KM, WT, JG) were responsible for screening the abstracts of articles identified in the first step. Each author independently reviewed an equal number of articles, which were assigned in alphabetical order. Using Mendeley software, articles were marked with the tags “included” if accepted and “excluded” if rejected. After the initial evaluation of the abstracts was completed, OWP reviewed the articles assessed by the other authors, and articles assessed by OWP were reviewed by JG.
Data collection
Three authors (KM, WT, JG) were responsible for collecting data from the initially included articles. For this step, we used an Excel spreadsheet in which each paper was evaluated according to the eligibility criteria. Each author collected data independently from an equal number of articles assigned in alphabetical order. The initially collected data was then reviewed by OWP.
Data items
The following data was extracted from each study: population, understood as the group of patients or the type of artificial model used in the study; type of measurements – cephalometric measurement, implant position measurement or dental arch measurement; method of measurement, understood as the technique used to generate the models from which measurements were taken or the technique used to perform direct measurements; and the software used to process photogrammetric data. The accuracy and reproducibility of the measurements were considered the outcomes of the reviewed studies.
Assessment of the risk of bias
Three authors (KM, WT, DP) were responsible for the risk-of-bias assessment of the studies. Each author independently assessed an equal number of studies, which were assigned alphabetically. Each data source was evaluated for risk of bias using the original Quality Assessment of Diagnostic Accuracy Studies (QUADAS-1) tool, which consists of 14 items (Table 1). QUADAS-1 is a validated, evidence-based quality assessment tool.32, 33 Each item was rated as “+”, indicating a positive response, or “−”, indicating a negative response. The initial assessment was reviewed by OP, and any disagreements were resolved through discussion between the authors.
Effect measures
For the accuracy and reproducibility outcomes, the extracted data showed considerable heterogeneity in the types of effect measures reported. Therefore, all effect measures related to the reproducibility or accuracy of photogrammetric measurements were taken into consideration. Effect measures for reproducibility outcomes included the intraclass correlation coefficient (ICC), Pearson’s correlation coefficient, root mean square (RMS), mean deviation, and interquartile range. For accuracy, the effect measures included RMS deviation, percentage of measurements within a specified error range, mean deviation, and standard deviation of distances.
Data synthesis
The collected data from each article was then assigned to one of the 3 categories depending on the type of measurement performed: cephalometric measurement (n = 12), dental implant position measurement (n = 18), or dental arch measurement (n = 14), and was further classified according to whether accuracy or reproducibility was assessed.
The data was then sorted and divided into 6 independent groups to properly visualize and describe the synthesized information: cephalometric studies that measured reproducibility; cephalometric studies that measured accuracy; dental implant studies that measured reproducibility; dental implant studies that measured accuracy; dental arch studies that measured reproducibility; and dental arch studies that measured accuracy. A narrative synthesis was performed for each group. Due to the considerable variation in the types of measured effects, a statistical analysis of heterogeneity was not conducted.
Results
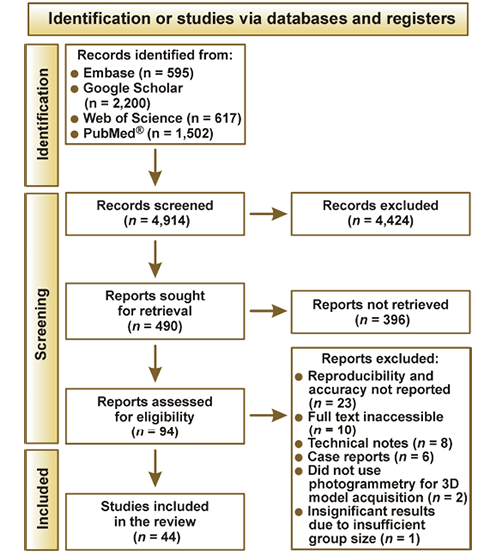
During the database searches, 4,914 records were initially identified. After title screening for studies describing the use of photogrammetry in dentistry and the removal of duplicates, 490 articles remained. Abstract screening was then conducted, during which 396 papers were excluded, leaving 94 articles. Subsequently, the full texts of the remaining articles were evaluated according to the eligibility criteria. During this phase, 50 articles were excluded, and 44 articles were included in the final review (Figure 2). Despite meeting the eligibility criteria, 1 study was excluded because of its insufficient sample size – a sample of 6 men and 6 women – which resulted in statistically non-significant findings with high p-values for all but one outcome.34 Therefore, this study, despite meeting the eligibility criteria, did not provide sufficiently informative data regarding the accuracy or reliability of photogrammetric measurements and was excluded, in accordance with the PRISMA explanation and elaboration paper.29
Risk of bias
For each study included in this review, the assessment of the risk of bias was conducted and presented graphically, with “+” indicating a positive response and “−”indicating a negative response (Table 2). Most studies received positive ratings for items related to the reference standard and the execution of the index and reference tests (D3–D9), with low-risk ratings ranging from 79.5% for D7 to 97.7% for D4. In contrast, high-risk ratings were more frequent in domains D1 (79.5%), D2 (68.2%), D10 (68.2%), D11 (54.5%), and D12 (52.3%). The highest proportions of high-risk ratings were observed in D13 (95.5%) and D14 (97.7%).
Reproducibility of cephalometric measurements
Seven studies described the reproducibility of photogrammetric measurements in the context of cephalometric measurements (Table 3). All studies described this technique as reproducible, with the exception of a single measurement reported in 1 study – the distance from the incisal edge to the distal canine.25, 28, 35, 36, 37, 38, 39
The highest Pearson’s correlation coefficient was reported in a study evaluating cephalometric measurements in relation to dental measurements. The mean value was 0.94 for interexaminer reliability and 0.92 for intraexaminer reliability, indicating excellent reliability of all measurements made.25
Two studies assessed changes in the vertical dimension of occlusion and showed that the photogrammetric technique achieved correlation coefficients above 0.80 for all measurements, indicating good reliability.28, 37
One study of cephalometric measurements described photogrammetry as having lower precision. Although facial measurements showed inter- and intraoperator ICCs ranging from 0.732 to 0.976, indicating good to excellent reliability, the ICC values for measurements of the dental corridor ranged from 0.598 to 0.914, indicating lower repeatability. The lowest ICC reported for measurements of the dental corridor was observed for the incisal edge – right premolar segment and was 0.732, with a 95% confidence interval (95% CI) ranging from 0.285 to 0.915.36
Ambient light has a significant influence on the reliability of photogrammetry-based facial models. Keil et al. showed that the photogrammetric method achieved the highest precision at 5,000 lx, slightly lower precision at 20,000 lx, and the lowest precision at 500 lx.38
For measurements in a pediatric population, with and without orofacial clefts, 95% of the distances were 0.80 mm or less for intraobserver measurements and below 1.10 mm for interobserver measurements. Statistical analysis showed that the age of the infants and the presence of orofacial clefts did not significantly affect the measurements, indicating that photogrammetry can be a reliable method for soft tissue assessment in infants with and without orofacial clefts.35
The 3D Scanner App (v. 2.1.2; Laan Consulting Corp., New York, USA) was also shown to be a reliable method for generating facial 3D models. It demonstrated good to excellent ICC values for linear and volumetric measurements. Additionally, photogrammetry-based models showed higher ICC values than models generated using TrueDepth camera of an iPhone 14 Pro (Apple Inc., Cupertino, USA).39
Accuracy of cephalometric measurements
Seven different studies described the accuracy of photogrammetric measurements in the context of cephalometric measurements (Table 4).38, 39, 40, 41, 42, 43, 44
A comparative testing study showed photogrammetry to be significantly less accurate than methods such as facial moulage and CBCT scans.41 The study reported mean percentage differences of 1.067 for photogrammetry, 0.622 for CBCT and 0.482 for facial moulage, indicating that photogrammetry had the largest measurement error among these 3 methods.41 The results of another comparative study indicated that even though photogrammetry was less accurate than the abovementioned methods, its accuracy was still acceptable, as more than 99% of the measured points in the photogrammetric model specimen were within the clinically acceptable limit of 1 mm compared with the CT scan.40
External factors such as ambient light and patient cooperation may influence the accuracy of photogrammetric facial model acquisition. At a light intensity of 5,000 lx, the results were most accurate, whereas at 20,000 lx they were slightly less precise, with the least accurate results observed at 500 lx.38 Interestingly, patient head positioning affected the accuracy of photogrammetry only slightly. Regardless of head position, all measurements were within the clinically acceptable limit of 1 mm except for the trago.43
Two comparative studies tested different methods of acquiring photogrammetry-based facial 3D models. One showed that there were no significant differences between models generated using a smartphone-based TrueDepth camera and those generated using photogrammetry, whereas all of them exhibited overall landmark-to-landmark distances of ≤2 mm.39 The other study analyzed discrepancies between models generated using different photogrammetry-based smartphone applications and showed no significant differences between them.44
Majid et al. proposed a novel photogrammetric technique based on characteristic points of the face, namely the natural features technique.42 Its accuracy was measured using the root mean square error (RMSE) and was 0.351 mm on the x-axis, 0.381 mm on the y-axis, and 0.843 mm on the z-axis. The method was more accurate than conventional photogrammetry.42
Reproducibility of dental implant position measurements
Twelve different studies described the reproducibility of photogrammetric measurements in the context of dental implant positions (Table 5). All of them characterized the technique as reproducible.45, 46, 47, 48, 49, 50, 51, 52, 53, 54, 55, 56
Five studies comparing the precision of photogrammetry, intraoral scanning and conventional impression techniques for complete arch implant rehabilitation showed photogrammetry to be significantly more precise than the other methods. In the first study, the median precision was 2.00 μm.46 Another study showed that, in terms of precision, the mean RMS values for 3D deviations of both the entire scan body and the flat angled surface were significantly smaller with photogrammetry. Comparison of the mean global angular deviations yielded similar results.50 A previous study by the same author compared photogrammetry with IOS and found no differences in angular deviations or the mean RMS values of 3D deviations between the 2 techniques.51 The most recent studies further demonstrated the superior precision of photogrammetry compared with IOS and conventional impressions.52, 53, 54
No significant differences in terms of precision were found in a study investigating the impact of changes in scanning distance on the accuracy and reproducibility of photogrammetry.48
In a study involving a coordinate-measuring machine (CMM), it was demonstrated that the precision of photogrammetry was similar to that of the CMM.45 For the groups that used the photogrammetry method, the grand mean for linear measurements was 26.8 μm; however, 2 groups – AvgR-MaxO and MaxR-MaxO – were not included in the calculation due to the limitation of the typodont in simulating living tissues. The precision of angular measurements also showed no significant differences between the groups, with grand means of 0.129° for the x angle and 0.221° for the y angle.45
Pinto et al. evaluated the repeatability of various digital acquisition methods for capturing implant positions in prostheses with 4 and 6 implants.47 The study findings suggested that photogrammetry demonstrated superior repeatability compared with IOS for recording implant locations in complete arch prostheses supported by both 4 and 6 implants, but were less repeatable than laboratory scanners.47 The most recent findings confirmed that the number of implants did not influence the precision of photogrammetry and that its precision remained very high, with an RMS of 12.42 µm.55 Additionally, a study by Estibalez-Recasens et al. showed that the in vivo precision of photogrammetry in patients with 6 implants was similarly high.56 The linear and angular measurements were 14.71 ±12.21 µm and 0.072 ±0.064°, respectively.56
Accuracy of dental implant position measurements
Fourteen studies described the accuracy of photogrammetric measurements of dental implant positions (Table 6).45, 46, 48, 50, 51, 52, 53, 54, 57, 58, 59, 60, 61, 62
In 5 comparative studies, photogrammetry was shown to have high accuracy.46, 51, 52, 53, 54 All of them showed photogrammetry to be more accurate in terms of 3D and angular discrepancies than IOS.51, 53 Additionally, three of them reported higher trueness for photogrammetry than for conventional impressions.46, 52, 54
Two studies compared photogrammetry with conventional impression techniques. In the study by Bergin et al., the mean linear measurement error was 26.2 µm for the conventional impression technique and 28.8 µm for photogrammetry, with no statistically significant difference between the methods.60 In contrast, Zhou et al. reported greater linear and angular discrepancies for photogrammetry, with mean values of 145 ±196 µm and 0.82 ±0.88°, respectively, which were significantly greater than those obtained with the conventional impression technique.59
Interestingly, the study by Örtorp et al. showed that cylinder center-point distortion was smaller with the photogrammetric technique than with the conventional impression technique, whereas angular cylinder distortion was greater with photogrammetry.61
Four articles regarding dental implant position measurements described photogrammetry as having lower overall accuracy compared with a CMM. Revilla-León et al. measured the average 3D discrepancy of photogrammetry at 77.6 μm.57 Their later study confirmed these results, showing a statistically significant difference between the CMM method and photogrammetry, with a trueness difference of 1.8 μm between the systems.62 Similarly, Bratos et al. conducted a study that showed a mean linear accuracy of 55.2 μm, which was lower than that of the CMM.45 Additionally, Bergin et al. found the CMM to have higher accuracy than photogrammetry, but the difference was not statistically significant.60
Two articles by Revilla-León et al. investigated how scanning distance and the reference point affect the performance of photogrammetry.48, 58 In one study, the authors compared accuracy at 3 different distances.48 The 30-cm scanning group yielded the most accurate linear measurements, with a linear discrepancy of 17 ±4 µm and an angular discrepancy of 0.17 ±0.02°. Measurements performed at shorter (20 cm) or longer (35 cm) distances were less accurate.48 In a study investigating the effect of the reference points, it was demonstrated that the selected reference point could also influence the accuracy of photogrammetry.58 Three groups were created based on the implant used as the reference point: the right first molar, left canine and left first molar. The study revealed differences in linear and angular trueness between the groups, with the first right molar used as a reference point showing the highest trueness values. Despite the differences between the groups, the measured angular and linear discrepancies were 0.01 ±0.01° and 6 ±3 µm, respectively. Therefore, the impact of the observed discrepancies was unlikely to be clinically significant.58
Reproducibility of dental arch dimension measurements
The reproducibility of dental arch dimension measurements was reported in 7 studies (Table 7).17, 18, 63, 64, 65, 66, 67 Two of them reported ICC values above 0.90 for all measurements performed,18, 65 indicating excellent reliability.68 Four studies indicated good agreement or values ranging from good to excellent, depending on the measurement, with ICC values varying from 0.71 to 0.998.63, 64, 66, 67 One study reported lower reproducibility, with a repeatability coefficient of 0.474.17
One of the studies measured validity and reliability using crown widths and selected dental arch dimensions.63 The ICC values varied between both measurements – the mean ICC was 0.88 for crown widths, whereas the mean ICC for dental arch dimensions was 0.97.63 A similar range of ICC values (0.879–0.998) was reported in a study that focused on measuring the mesiodistal crown diameter, arch width and arch perimeter.66
The widest range of ICC values was observed in a study focused on evaluating tooth displacement under a low horizontal tensile force (≤18 N), with the lowest ICC value of 0.71 at a force of 3 N and the highest value of 0.98 at a force of 18 N.67
Good reliability, with all ICC values >0.80, was reported in the study focused on investigating tooth size and dental arch dimensions in Malays using a stereophotogrammetric system.64
Two studies compared photogrammetric measurements obtained using 3D scanning systems and confirmed their high reproducibility.18, 65 The first study reported ICC values at 0.99 for each pair of measurements obtained with photogrammetry, indicating almost perfect agreement between the 2 measurements.18 The second study noted similarly high ICC values for different measurements, including mesiodistal widths of individual teeth, mesiodistal widths of two-teeth segments, and intercanine and intermolar distances in both the maxilla and mandible, with correlations close to 1 in all cases and the lowest ICC value being 0.9737.65 These studies indicated excellent reproducibility of photogrammetry.
In contrast to all the abovementioned studies, 1 study reported low reproducibility of photogrammetric measurements, with a repeatability coefficient of 0.474.17
Accuracy of dental arch dimension measurements
Thirteen studies evaluated the accuracy of photogrammetry in comparison with various measurement methods (Table 8).17, 18, 63, 64, 65, 66, 69, 70, 71, 72, 73, 74, 75
Three studies found no statistically significant differences between the results when photogrammetry was compared with other reliable measurement techniques.64, 66, 69 When photogrammetric measurements were compared with those performed on dental casts using calipers, the statistical analysis showed no significant differences between the 2 methods except for the lower arch perimeter. Additionally, photogrammetric measurements showed clinically acceptable accuracy, with differences between measurements of less than 0.5 mm.64, 66, 69 This was further confirmed by 3 other studies that investigated the accuracy of the photogrammetric technique and demonstrated clinically acceptable accuracy, with errors below 0.5 mm.18, 65, 74
A study by Kamel et al. compared the accuracy of photogrammetry and an extraoral scanner in assessing the marginal fit of crowns.71 The findings showed no statistically significant difference between the 2 methods, and the accuracy of photogrammetry was deemed to be clinically acceptable, with discrepancies below 120 µm.71
Two studies that compared photogrammetric measurements with measurements performed on plaster impressions reported differences between the methods.63, 73 One study observed differences in measurements involving the second premolars, canines and arch perimeter when comparing values obtained using calipers and photogrammetry, with photogrammetry showing larger discrepancies. However, all measurements remained within a clinically acceptable error range of less than 0.5 mm.63 The most recent study by Chaudhary et al. showed no statistically significant differences between measurements made on gypsum models and photogrammetric digital models for intercanine distances and distances from the first premoral to the first molar in both quadrants.75 Additionally, there was no significant difference in the volumetric comparison.75
One study assessed photogrammetry against measurements obtained using CBCT.70 No statistically significant differences were noted between the results obtained using 3D dentofacial imaging and the CBCT reference, except for a single distance.70
An analysis of different approaches to facial scanning concluded that the use of extraoral markers significantly enhanced the accuracy of 3D dentofacial images obtained using photogrammetry.72
Discussion
The findings suggest that photogrammetry may be a promising measurement method in dentistry for assessing cephalometric measurements, dental implant positions and dental arch dimensions. However, further studies are needed to provide robust evidence of its clinical utility before its routine implementation in dental practice can be recommended.
In the case of cephalometric measurements, it should be noted that indirect measurements, such as 3D face scans, can be more precise than direct methods, such as measurements performed using calipers. Direct measurements can comprise soft tissues or trigger muscle reflexes, such as blinking, resulting in reduced accuracy.76 Photogrammetric reconstructions, being non-contact, do not have this disadvantage.
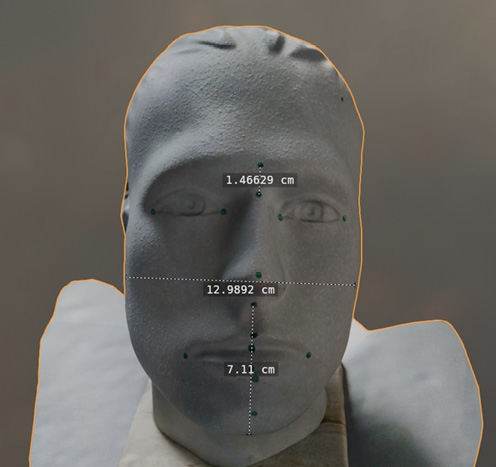
Additionally, once a photogrammetric 3D scan of a patient’s face is acquired, the generated digital model can be stored on a computer, similarly to 3D models reconstructed from CT scans.77 Therefore, measurements can be taken from the model without the patient’s presence. This feature may be particularly useful in situations requiring repeated measurements and when integration with other digital 3D models is needed (Figure 3).
The reviewed articles reported that photogrammetry is also a reliable method for soft tissue measurements in pediatric patients, regardless of the children’s age or the presence of orofacial clefts. This may make it a valuable tool for dentists, who often face difficulties when performing uncomfortable but necessary measurements of the face, dental arches and other structures in children.
Photogrammetric measurements of dental arches are reliable, with high ICC values of up to 0.99 reported in most studies. However, one study showed low precision. The majority of studies indicated that the discrepancies between photogrammetric measurements and standard methods were not statistically significant and that the measurement errors were acceptable, with values below 0.5 mm.
Given the high accuracy and reproducibility of photogrammetry, plaster dental arch models can be accurately digitized using this technique. Therefore, after further research into the capabilities and limitations of photogrammetry, especially in clinical settings, this method may become a potential alternative to more expensive extraoral scanners in the future. Additionally, because of its relatively low cost, photogrammetry can be used by students to obtain 3D dental casts, as the technique primarily requires appropriate photographic acquisition skills.78 Photogrammetry may also be useful for teaching purposes when a university cannot afford expensive scanners, enabling students to learn digital dental workflows during their training. However, the limitations of this technique should be considered; for example, direct scanning of gingiva is not possible.
Photogrammetry appears to be a highly reproducible technique for measuring dental implant positions in terms of both linear and angular measurements.50, 51, 52, 53, 54 Studies indicate that photogrammetry is more accurate than IOS but less accurate than the CMM.45, 51, 53, 57, 60, 62 In the case of dental impressions, the results are inconclusive.59, 60, 61 Additionally, it was shown that working conditions, such as the distance between the camera and the scanned object, have a significant impact on measurement accuracy.48
Even though photogrammetry demonstrated superior repeatability compared with IOS for capturing implant positions in prostheses, some evidence suggests that its precision, unlike that of laboratory scanners, decreases as the number of implants increases. This may indicate that photogrammetry is a practical option for cases involving fewer implants, but for more complex full-arch reconstructions, laboratory-based techniques might offer better reliability.79 Clinicians may consider combining techniques, using photogrammetry for its non-invasive and efficient workflow while relying on laboratory scanners when greater precision across multiple implants is necessary.24
The higher accuracy of photogrammetry compared with IOS for recording dental implant positions may be attributed to the fact that photogrammetry is less affected by the presence of blood and saliva.19, 20 However, because the photogrammetric method used for implant position measurement relies on reference markers, the resulting 3D digital model does not capture the surrounding soft tissues. In this context, integrating both methods may be advantageous.
Integrating photogrammetry with other methods of 3D scanning, such as IOS and CBCT, can provide complementary information and enable the creation of virtual patient models; therefore, these combined techniques can be utilized in treatment planning and diagnosis. This approach may help to deliver immediate complete arch implant-supported fixed interim and definitive prostheses in suitable patient groups, thereby reducing the time required to produce these prostheses.80, 81, 82
The use of photogrammetry in clinical practice, particularly for implant-supported prostheses, requires careful consideration of specific conditions, especially the scanning distance. Although in a reviewed study it was confirmed that 30-cm distance provided the greatest accuracy, the optimal distance may vary depending on the environmental conditions, such as brightness and shadowing.48, 83 This is an important limitation of photogrammetry that requires further research to determine the specific conditions under which images should be taken.
In addition to its efficacy, photogrammetry is also a non-invasive, painless, comfortable, and quick method, which represents an important advantage for a diagnostic tool.84 These characteristics are particularly attractive in pediatric dentistry, where patients are often less willing to cooperate during dental procedures.85 To obtain a high-quality photogrammetric 3D model, the patient should remain as still as possible during the acquisition of consecutive images, as blurred pictures can decrease measurement accuracy.86 This, in the context of working with children, may pose a challenge for the operator.
Regarding the ALARA (as low as reasonably achievable) principle, photogrammetry has an advantage over X-ray-based imaging techniques. It can be used for cephalometric measurements instead of CT scans or radiographic examinations and, potentially in the future, for measurements of dental arch dimensions as an alternative to CBCT. These findings are especially important for pregnant women and children, as they are particularly vulnerable to radiation.72, 87 However, it is important to consider that photogrammetry can capture only the surface of an object, unlike CBCT, which can be used to reconstruct structures located within the human body, such as the inferior alveolar canal.88
Although creating photogrammetric facial models and taking dental implant position measurements are relatively straightforward processes, digitization of dental arches requires an additional step. First, an impression must be taken, on the basis of which a physical model of the dental arches is prepared; this model can subsequently be scanned and digitized using photogrammetry. For dental implants, this technique captures only their positions, without the surrounding tissues, unlike IOS. Therefore, the digitization of the gingiva and implant positions in edentulous patients requires the combination of these methods. These are important limitations of photogrammetry, as they can potentially prolong scanning time and require more effort from the operator compared with conventional methods.
Other limitations of photogrammetry in dentistry require further research, including the establishment of standardized measurement conditions, such as appropriate lighting. From a pediatric perspective, the need for patient to remain still may be problematic. The potential reductions in precision in more complex reconstructions involving larger numbers of implants should also be considered, suggesting that photogrammetry may currently have a complementary rather than replacement role relative to laboratory scanners.
It is also important to acknowledge that this review is based mostly on ex vivo studies using artificial models. Therefore, its results cannot be directly extrapolated to clinical practice. Overall, the high accuracy and reproducibility reported for photogrammetry suggest that it may be a useful tool for performing cephalometric measurements, recording implant positions and measuring dental arches under laboratory conditions; however, its effect on clinical outcomes remains undetermined.
Conclusions
Photogrammetry has proved to be a precise and accurate method for cephalometric measurements, recording the position of dental implants and measuring dental arch dimensions. Its reliability is comparable to that of other established methods currently used in dentistry, such as IOS and traditional casts. In some cases, particularly when compared to IOS, photogrammetry showed superior outcomes. Moreover, photogrammetry may be more economically viable than other techniques.
Photogrammetry is a promising method with considerable potential in dentistry. However, it should be noted that only one of the reviewed studies was conducted in a clinical setting; therefore, photogrammetry cannot yet be considered the preferred method for the measurements discussed in this review. To assess this limitation, photogrammetric techniques should be further evaluated in clinical settings, particularly in view of the promising results obtained in laboratory conditions. We hope that this research will provide useful information and encourage clinicians to further investigate the applicability of photogrammetry in dental practice.
Ethics approval and consent to participate
Not applicable.
Data availability
Not applicable.
Consent for publication
Not applicable.
Use of AI and AI-assisted technologies
Not applicable.