Abstract
Background. Self-adhesive resin cements (SARCs) are widely used in the field of restorative dentistry due to their simplified application and adequate bonding properties. However, their long-term color and surface stability, particularly under the influence of pigment-rich dietary substances, remain a critical concern in aesthetic restorations.
Objectives. The aim of the study was to evaluate the color stability and surface roughness of 4 contemporary SARCs after immersion in various staining media using digital photography.
Material and methods. A total of 160 disc-shaped specimens (n = 40 per group) were fabricated from 4 SARCs: Maxcem Elite™ (MXC); G-CEM ONE™ (GCO); SpeedCEM® Plus (SPC); and RelyX™ Universal (RLX). The specimens were immersed in artificial saliva, coffee, red wine, or matcha tea at 37°C for 0 (T0), 7 (T1), 14 (T2), 21 (T3), and 28 (T4) days. Color changes (ΔE₀₀) were measured, and surface roughness parameters were evaluated using 3D laser scanning microscopy. The statistical analysis was performed using linear mixed models (LMMs) and Tukey’s honestly significant difference (HSD) post hoc test (α = 0.05).
Results. All materials showed visually perceptible color changes (ΔE₀₀ > 1.1). The highest discoloration and roughness values were observed in MXC, especially after exposure to red wine. RelyX™ Universal exhibited the greatest resistance to staining and surface degradation. 2-Hydroxyethyl methacrylate (HEMA)-based SARCs (MXC, GCO) were more susceptible to pigment infiltration and roughness increase than urethane dimethacrylate (UDMA)-based cements (RLX, SPC).
Conclusions. The aesthetic stability of SARCs is influenced by both material composition and exposure to staining agents. Red wine caused the most severe discoloration and surface changes, followed by coffee, matcha tea and artificial saliva. Higher water sorption and surface roughness were associated with increased staining. Preserving surface integrity is essential for maintaining the long-term aesthetic performance of SARCs.
Keywords: surface roughness, color stability, CIELAB, self-adhesive resin cement, staining media
Introduction
In recent years, there has been a noticeable shift in the aesthetic expectations of dental patients. The demand for natural-looking, tooth-colored restorations, particularly in the visible anterior region, has increased.1 In addition to personal beauty ideals, digital media and social networks play a decisive role in shaping patients’ perceptions of dental aesthetics.2 As a result, the long-term color stability of restorative materials has become a central concern in clinical practice and dental research. Both the choice of ceramic and luting cement significantly influence the natural appearance of restorations.3 Even minimal discoloration of the cement can markedly affect the overall aesthetic outcome when using highly translucent ceramics.4
Self-adhesive resin cements (SARCs) have become established materials for bonding indirect restorations due to their ease of use, clinical efficiency and reliable adhesion.5 Chemically, they are based on a combination of functional monomers, such as bisphenol A-glycidyl methacrylate (Bis-GMA), urethane dimethacrylate (UDMA) and triethylene glycol dimethacrylate (TEGDMA), along with filler particles that improve their mechanical performance.6 In contrast to conventional resin cements, SARCs contain acidic monomers (e.g., phosphoric acid esters or carboxylate groups) that induce mild demineralization and enable chemical self-adhesion to the tooth substrate.5 This is particularly beneficial in deep, pulp-near preparations, as it offers protection against hypersensitivities caused by excessive etching. While this modified composition enhances adhesive properties, it may compromise the long-term stability of the bond due to reduced surface pretreatment.6
In this context, the resistance to hydrolytic degradation has become a key factor in determining the clinical durability of SARCs.7 Owing to their hydrophilic monomer content, these materials are more susceptible to water sorption, which weakens the polymer matrix, destabilizes cross-linking and alters the surface morphology.7 These changes not only increase the risk of marginal breakdown but also promote the adsorption of exogenous pigments.8, 9 Increased surface roughness further facilitates the accumulation of staining substances and hampers effective surface cleaning. As a consequence, colorants from the oral environment can more easily penetrate the material, progressively compromising long-term color stability.8 In addition to intrinsic material factors, extrinsic elements play a crucial role in the color stability of SARCs.10 Staining solutions such as red wine, coffee and matcha tea contain high concentrations of anthocyanins, tannins and oxidized polyphenols, which, due to their small molecular size and high lipophilicity, can deeply infiltrate the polymer matrix.10 Once inside, these molecules interact with the composite’s organic components, especially unpolymerized monomers, ester groups or free radicals, leading to chemical reactions such as oxidation, hydrolysis or chain scission, which may cause irreversible discoloration.11 The extent of these effects depends largely on the pH of the staining medium and on the hydrophilicity and water sorption behavior of the respective SARC.12 Strongly acidic or basic solutions tend to destabilize polymer networks and facilitate pigment diffusion, while more hydrophilic SARCs are prone to deeper penetration and internal staining due to higher water uptake.13, 14
To objectively quantify color changes, digital imaging technologies such as the eLAB system (Emulation S.Hein, Freiburg im Breisgau, Germany) are increasingly utilized. Unlike traditional spectrophotometry, the eLAB system allows for standardized calibration of light sources, camera sensors and white balance,15 ensuring reproducible and visually accurate color analysis under clinically realistic conditions. This advanced technique is particularly relevant for the evaluation of aesthetic restorative materials, as it provides a more precise and clinically meaningful assessment of color dynamics. Although numerous studies have investigated the color and surface stability of SARCs, there remains a paucity of research on the behavior of newly formulated SARCs when exposed to various staining agents.5, 16 Given the ongoing development of dental materials, a differentiated analysis is needed to assess their long-term aesthetic stability under simulated aging conditions. This study systematically investigates how pigment-rich substances, such as coffee, red wine and matcha tea, affect the color stability (ΔE00) and surface roughness (arithmetic mean height (Sa) and maximum peak-to-valley height (Sz)) of several modern SARCs. The goal is to identify material-dependent differences in discoloration and surface degradation and to evaluate the suitability of these cements for aesthetically demanding indirect restorations. The findings are intended to provide an evidence-based foundation for material selection in restorative dentistry and offer clinically relevant recommendations for minimizing discoloration.
The following null hypotheses were tested:
1. Storage in different staining solutions (artificial saliva, coffee, red wine, and matcha tea) does not result in significant differences in the color change (ΔE00) of the tested SARCs;
2. The surface roughness values (Sa, Sz) of the SARCs do not change significantly over the course of the investigation.
Material and methods
Preparation of study samples
The study flowchart is presented in Figure 1. A total of 160 disc-shaped samples (n = 40/SARC; diameter: 10 mm, thickness: 2 mm) were fabricated from 4 different SARCs: Maxcem Elite™ (Kerr Corporation, Orange, USA) (MXC); G-CEM ONE™ (GC Corporation, Tokyo, Japan) (GCO); SpeedCEM® Plus (Ivoclar Vivadent, Schaan, Liechtenstein) (SPC); and RelyX™ Universal (3M Deutschland GmbH, Neuss, Germany) (RLX). The specific compositions and batch numbers of the tested materials are detailed in Table 1. Each composite was placed into a standardized Teflon mold and polymerized in two 1-mm layers, starting with the occlusal side, for 20 s using a light-emitting diode (LED) light-curing unit (Bluephase Style, 1,200 mW/cm2; Ivoclar Vivadent). After removing the mold, an additional 20-second post-curing was performed to ensure complete polymerization. A randomly selected surface of each sample was polished under wet conditions using silicon carbide abrasive papers (P320 to P1200) on a benchtop grinding and polishing machine (Ecomet® 6; Buehler, Lake Bluff, USA). Following polishing, the samples were ultrasonically cleaned in distilled water for 8 min,17 thoroughly rinsed, and stored in distilled water at 37°C for 24 h.
Exposure to staining media and color measurements
Each sample was randomly assigned to one of 4 experimental staining media: artificial saliva; coffee (Capsa Prodomo; Alois Dallmayr Kaffee oHG, Munich, Germany); red wine (Doppio Passo, 13% alcohol content; Casa Vinicola Botter, Fossalta di Piave, Italy); and matcha tea (Bio Matcha; Health Bar GmbH, Berlin, Germany) without pH measurement. Artificial saliva was prepared by the institutional hospital pharmacy in accordance with the formulation described by Manfro et al.18 The solution contained 22.1 mmol/L of bicarbonate, 16.1 mmol/L of potassium, 14.1 mmol/L of sodium hydrogen, 2.6 mmol/L of phosphate, 0.8 mmol/L of boric acid, 0.7 mmol/L of calcium, 0.4 mmol/L of thiocyanate, and 0.2 mmol/L of magnesium. The samples were stored in an incubator (schülke Cultura; Schülke & Mayr GmbH, Norderstedt, Germany) protected from light at a constant temperature of 37°C to simulate physiological oral conditions. After staining, all specimens were rinsed with distilled water for 10 s to remove loosely adherent surface residues and air-dried for 2 min using lint-free absorbent tissue. Color measurements were conducted at 5 defined time points: T0 (baseline); T1 (7 days); T2 (14 days); T3 (21 days); and T4 (28 days). For standardized image acquisition, a digital single-lens reflex camera (EOS 6D Mark II; Canon Inc., Tokyo, Japan) equipped with a 100-mm f/2.8 macro lens and a Macro Twin Lite MT-24EX flash system (Canon Inc.) was utilized. A cross-polarization filter (polar_eyes; Emulation, Freiburg, Germany) was employed to eliminate distracting reflections and ensure reproducible color capture. The camera settings were aligned in accordance with the methodology provided by Hein et al.: aperture of f/22; shutter speed of 1/125 s; and ISO 100.15 During image acquisition, the samples were placed into a precision-engineered acrylic plate (Palavit® L; Kulzer, Hanau, Germany) and fixed in a phantom head (frasaco GmbH, Tettnang, Germany) to ensure consistent positioning. For the calibration of the eLAB system, a white balance card (Emulation S.Hein) was positioned on the acrylic plate. The captured CIE L*a*b* color values were converted into the LCh color system (L*, C*, h°) to facilitate a more nuanced analysis of color changes. Color deviations were calculated using the CIEDE2000 equation (ΔE00),4 which, as an advanced color difference formula, provides a more realistic weighting of differences in lightness, saturation and hue. The scaling factors, namely SL, SC and SH account for varying perceptual sensitivities to lightness, chroma and hue. The kL, kC and kH parameters are used to adjust for specific viewing conditions. Additionally, the rotation term (RT) corrects perceptual distortions, particularly within the blue color spectrum. To evaluate color changes, clinically established thresholds, as defined by Paravina et al., were applied.19 The perceptibility threshold (PT) was set at ΔE00 = 1.1, and the clinically acceptable tolerance threshold was established at ΔE00 = 2.7. These values are derived from studies conducted under standardized lighting conditions, a neutral gray background, and a viewing distance of approx. 30–40 cm.20
Surface roughness analysis
A quantitative analysis of surface roughness was performed using a 3D laser scanning microscope (VK-X3050; Keyence Corporation, Osaka, Japan) in the vertical scanning interferometry (VSI) mode, in accordance with ISO 25178-2:2021.21 For each sample, 3 randomly selected measurement areas were captured, and their mean values were used for statistical evaluation. To assess potential microstructural changes after exposure to the staining media, the roughness parameters, namely arithmetic mean height (Sa) and maximum peak-to-valley height (Sz), were analyzed.
Statistical analysis
The sample size was calculated using G*Power software (Heinrich Heine University, Düsseldorf, Germany), based on an effect size of f = 0.4, a significance level of α = 0.05, and a test power of 80%, as established in the study by Chen et al.21 The statistical analysis was conducted using RStudio (R v. 4.4.3; Posit PBC, Boston, USA). A linear mixed model (LMM) was employed to investigate the effects of different composite types, staining media and time points on color differences (ΔE00) and surface roughness (Sa, Sz). Post hoc comparisons were performed using Tukey’s honestly significant difference (HSD) test, with the significance level set at α = 0.05.
Results
Color change
Figure 2 presents representative samples following immersion in the respective staining media across 5 defined time points (T0–T4). The LMM analysis revealed significant effects for the SARC type (F(3, 121.4), η2 = 0.716, p < 0.001), staining medium (F(3, 1273.2), η2 = 0.964, p < 0.001) and measurement time point (F(3, 1864.0), η2 = 0.928, p < 0.001). Statistically significant interactions between these factors were also observed (F(27, 45.3), η2 = 0.739, p < 0.001).
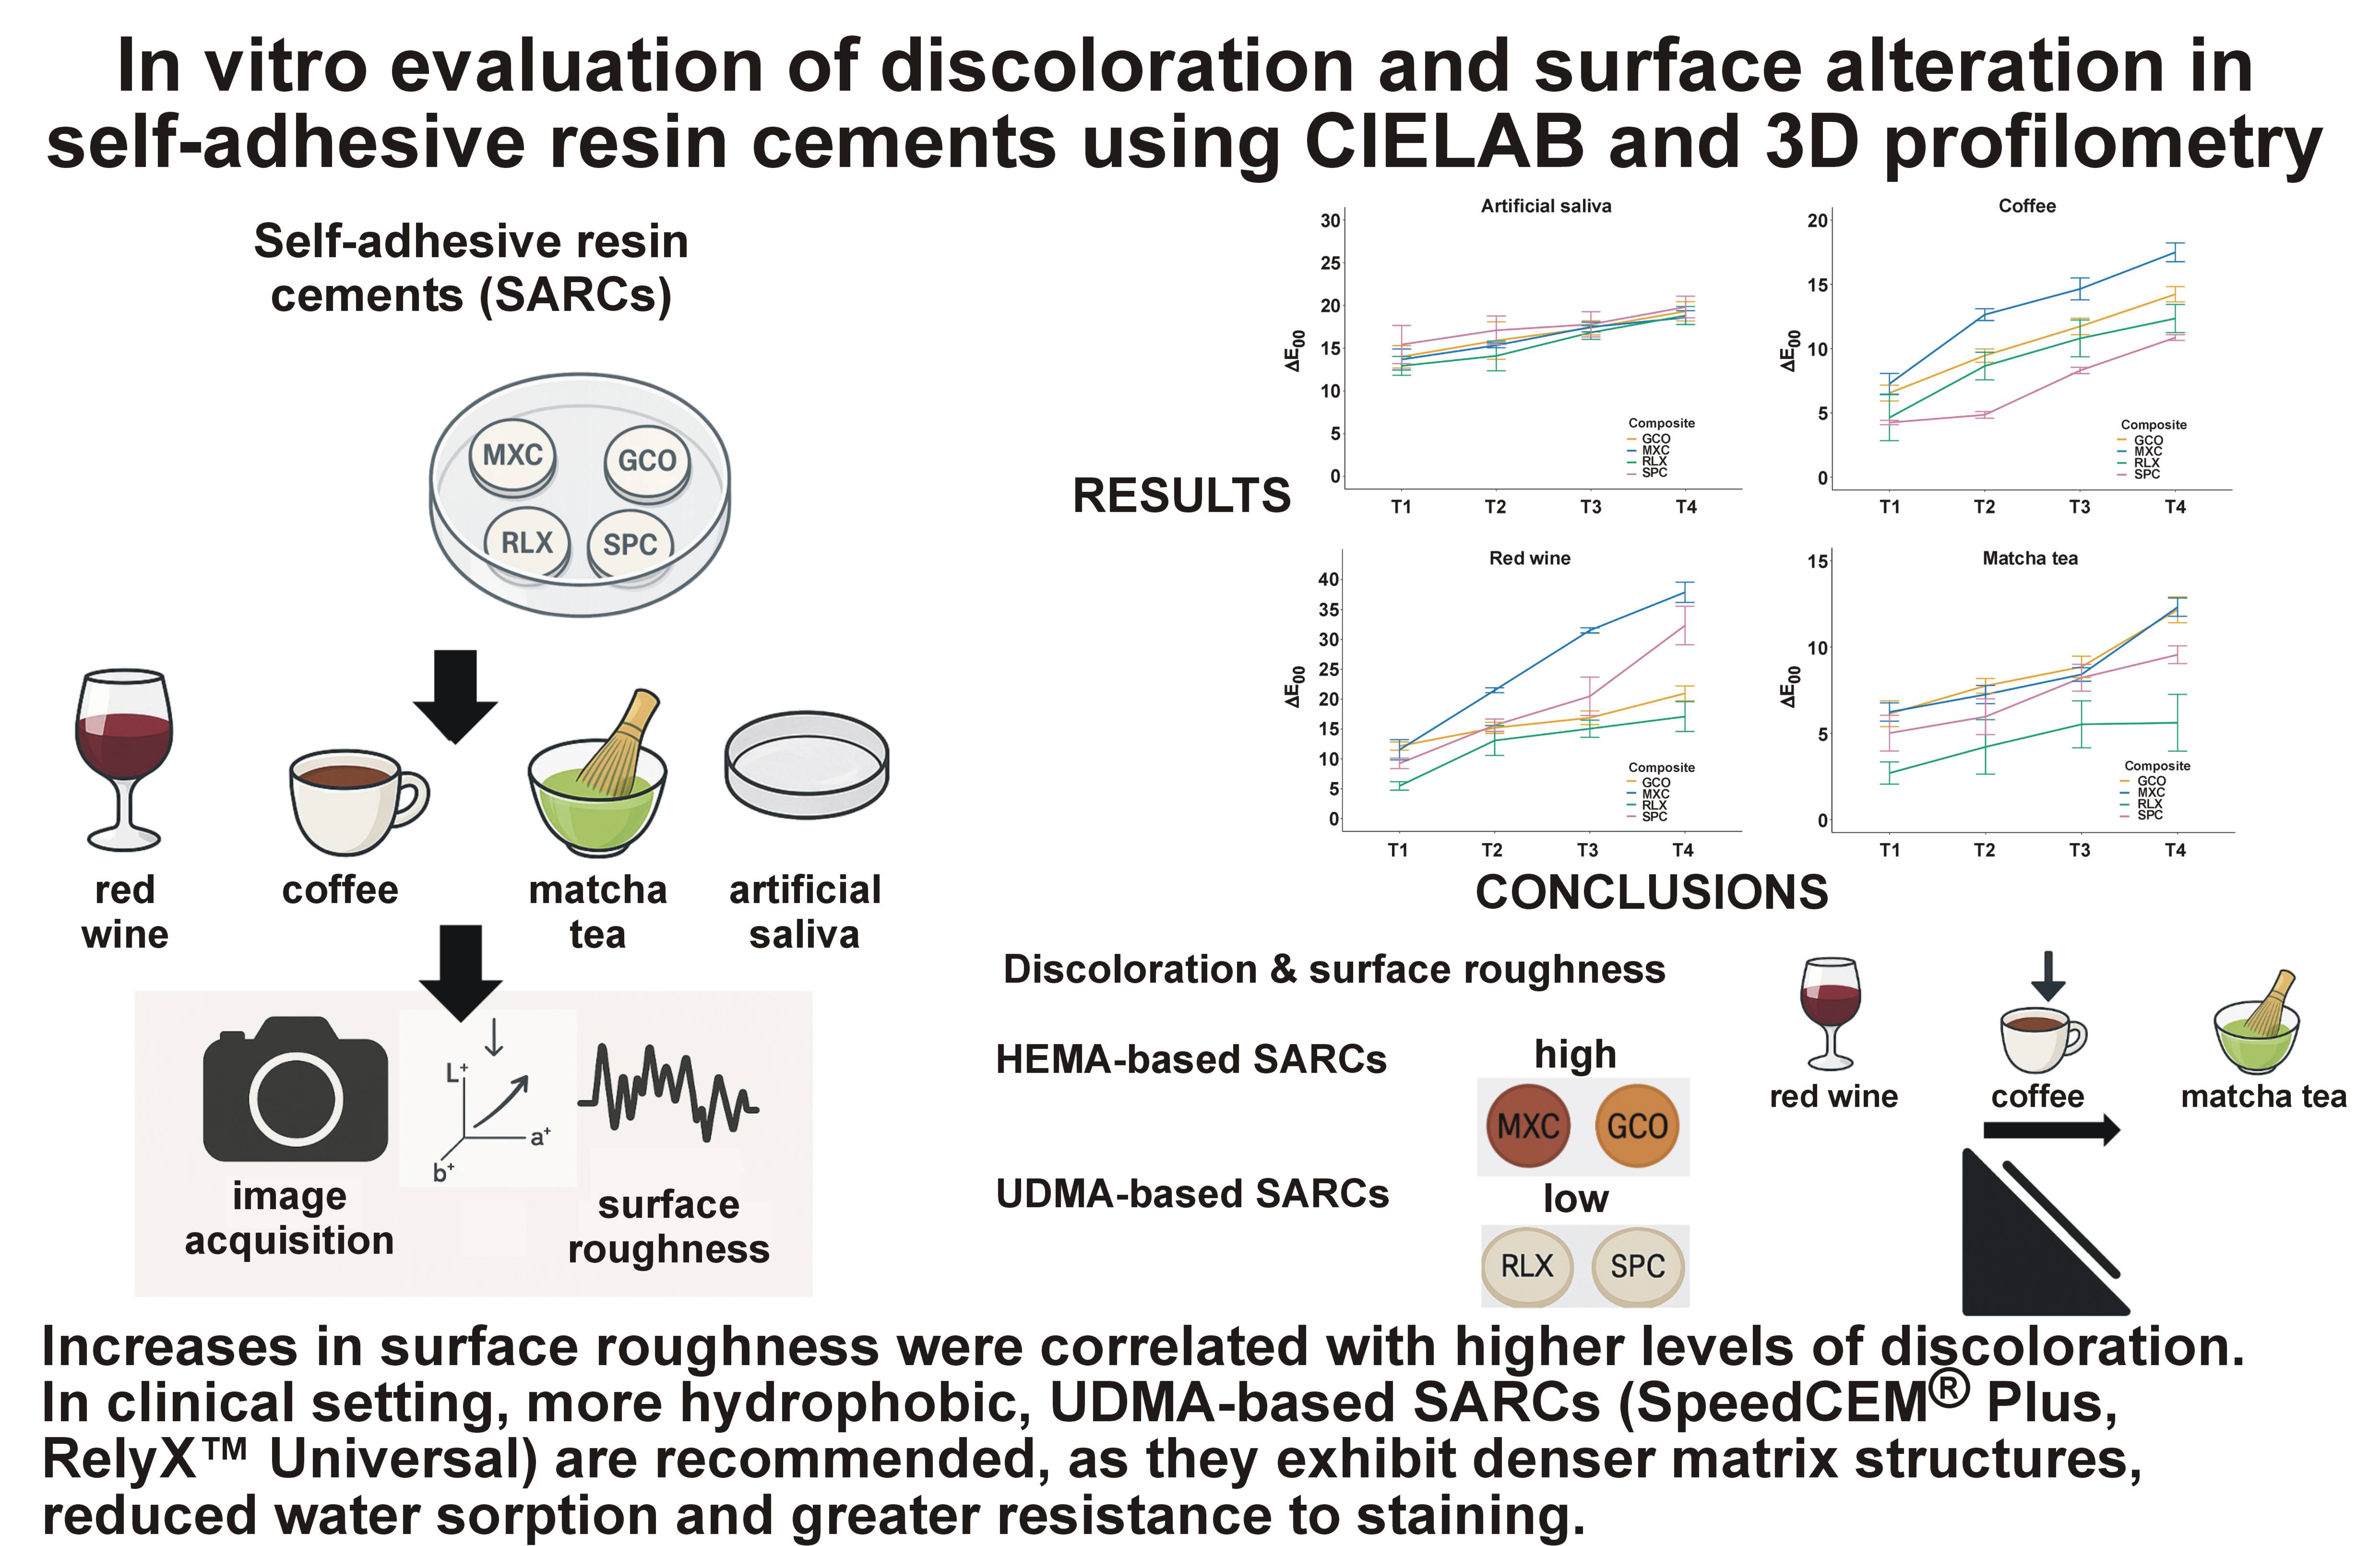
The ΔE00 values increased progressively over time (Figure 3), with MXC consistently demonstrating the most pronounced color change across all staining media. In contrast, RLX and SPC exhibited the highest overall color stability. Among the staining agents, red wine caused the most pronounced discoloration, particularly for MXC (37.91 ±2.37), while RLX showed the lowest discoloration potential in this medium (17.11 ±3.50). Compared to red wine, coffee induced less discoloration, but resulted in a significantly higher color change than matcha tea. Within the coffee group, SPC demonstrated the highest color stability, presenting the lowest ΔE00 values. Across all staining agents, RLX showed the most stable performance, with the lowest degree of discoloration observed in matcha tea (5.61 ±2.30).
Pairwise comparisons confirmed significant differences across time points and staining media. No significant differences were found between GCO and SPC in artificial saliva and matcha tea up to 21 days; however, substantial differences between these materials were observed in coffee at all time points, in matcha tea at 28 days, and in red wine at 7, 21 and 28 days. In contrast, significant distinctions were consistently observed in comparisons involving MXC and RLX. The detailed significance levels relative to established perceptibility and acceptability thresholds are summarized in Table 2. The ΔE00 values for all materials consistently exceeded the perceptibility threshold of ΔE00 = 1.1, indicating that the color changes were visually detectable. For all tested SARCs, the ΔE00 values in all staining media additionally surpassed the clinically acceptable threshold of ΔE00 = 2.7.
Surface roughness
Surface roughness parameters (Sa and Sz) varied significantly depending on the SARC type, staining medium and measurement time point. The LMM analysis revealed significant effects for the SARC type (F(3, 1549.0), η2 = 0.866, p < 0.001), staining medium (F(3, 2578.9), η2 = 0.915, p < 0.001) and time point (F(3, 2343.3), η2 = 0.929, p < 0.001), as well as significant interaction effects (F(36, 10.3), η2 = 0.340, p < 0.001).
Among the staining agents, red wine induced the highest surface roughness values, particularly for GCO (Sa: 258.95 ±3.63 nm) and MXC (Sa: 284.02 ±4.22 nm) (Figure 4). Coffee also led to a considerable increase in surface roughness, especially in MXC (Sa: 259.01 ±5.78 nm) and GCO (Sa: 253.01 ±14.7 nm). In comparison, matcha tea exhibited a lower roughening potential. The lowest Sa and Sz values were observed in artificial saliva (Table 3).
Post hoc testing confirmed statistically significant pairwise differences for most comparisons (p < 0.001). Detailed significance levels are listed in Table 3.
Discussion
The findings of this investigation led to the rejection of both null hypotheses, as color change (ΔE00) and surface roughness parameters (Sa, Sz) of the tested SARCs exhibited statistically significant differences over time and across different staining media. Among the evaluated materials, RLX demonstrated the highest color stability and the least increase in surface roughness, whereas MXC exhibited the most pronounced alterations across both parameters. Among the staining solutions, red wine induced the most substantial color and surface changes, followed by coffee and matcha tea. These findings emphasize the clinical relevance of material selection for highly aesthetic anterior restorations and underscore the importance of considering material-inherent properties and external influences when selecting SARCs for aesthetic cases.
Influence of staining media and their chemical composition
Central to the present study was the investigation of how various staining agents affect the color stability of different SARCs. A differentiated analysis of the chemical properties of each staining medium helped elucidate the mechanisms underlying the observed differences. The extent of discoloration varied significantly depending on the medium. The most intense staining was observed in response to red wine, followed by coffee, matcha tea and artificial saliva. This can be attributed to the high concentration of chromophoric molecules, such as anthocyanins, tannins and oxidized polyphenols, which exhibit a strong affinity for polymer matrices due to their chemical structure.22 Furthermore, the acidic pH of red wine (pH: 3.2–3.8) may promote hydrolytic degradation on the surface of the material,22 which, when combined with increased surface roughness, likely enhances pigment infiltration. Acidic environments may also trigger the breakdown of peroxide-based initiator systems, structurally weakening the polymer matrix and exposing filler particles, both of which contribute to an increase in roughness and susceptibility to staining.
Coffee also caused significant discoloration, with several materials surpassing the clinically acceptable ΔE00 threshold. Melanoidins and oxidized tannins, which are formed during the roasting process, are considered primary contributors due to their intense chromophoric activity.21 These hydrophilic pigments preferentially interact with matrix systems characterized by low cross-link density, an issue which is particularly relevant in 2-hydroxyethyl methacrylate (HEMA)-based SARCs, such as MXC and GCO. The material-dependent behavior observed in this study aligns with previous research that identified coffee as a highly staining medium.23 In contrast to prior studies, which frequently employed immersion temperatures of 65–80°C, this investigation maintained a constant temperature of 37°C to better replicate intraoral conditions. Despite the moderate temperature, substantial discoloration occurred, underscoring the strong affinity of coffee-derived pigments for hydrophilic polymer components.14 The immersion protocol used here is also considered clinically relevant. Guler et al. demonstrated that a 24-hour immersion in coffee corresponds to approx. 1 month of real-life consumption.24 Thus, the 28-day protocol used in this study simulates the effect of nearly 2 years and 8 months of habitual coffee intake.
Immersion in matcha tea led to moderate but measurable discoloration. Although matcha has a nearly neutral pH (6.0–7.0), it is rich in polyphenolic catechins, particularly epigallocatechin gallate (EGCG), that interact with the organic matrix via polar hydroxyl groups.25, 26 Several SARCs exhibited ΔE00 values comparable to those seen in the coffee group, indicating the clinical relevance of this increasingly popular beverage. Like coffee, matcha tea is prepared with hot water, meaning that both thermal and chemical mechanisms may contribute to the discoloration observed.25 Additionally, its intense green coloration—due to chlorophyll pigments—and fine particle size may promote greater surface adsorption, particularly in hydrophilic materials.25 Artificial saliva produced the least discoloration. However, HEMA-based SARCs consistently exceeded the perceptibility threshold of ΔE00 = 1.1, suggesting the occurrence of hygroscopic alterations in the polymer matrix. These findings confirm that only artificial saliva resulted in discoloration below the clinical acceptability threshold, while all pigment-rich solutions led to perceptible and potentially unacceptable changes. Notably, HEMA-based SARCs (MXC, GCO) were significantly more susceptible to staining than their UDMA-based counterparts (RLX, SPC), favoring the latter in aesthetic clinical scenarios.
Color change, surface roughness and the role of material composition
The observed variations in both color stability and surface roughness can be largely attributed to differences in material composition. In particular, the interaction between the polymer matrix and the filler system appears pivotal in mediating resistance to external influences.27, 28 One possible mechanism underlying these changes is the degradation of peroxide-based initiators (e.g., cumene hydroperoxide, α,α-dimethylbenzyl hydroperoxide) under acidic conditions.29 This degradation compromises the polymer structure and exposes filler particles, thereby increasing surface roughness and pigment adsorption. A positive correlation between surface roughness and color change was observed both in the present study and in previous literature.30
In the context of surface roughness, Sa increased significantly over time for the HEMA-based composites (MXC and GCO), especially after 21 and 28 days of immersion in red wine and coffee. Conversely, RLX and SPC, both of which are UDMA-based, exhibited only minimal changes in Sa and Sz, indicating superior surface stability under the tested conditions. This trend was particularly evident for SPC, which maintained the lowest Sz values (peak-to-valley height) across all staining cycles. These findings support the hypothesis that hydrophobic resin matrices and well-integrated filler systems contribute to structural integrity, whereas hydrophilic monomers promote matrix degradation and surface deterioration. Clinically, increased surface roughness may accelerate plaque accumulation and discoloration, thus compromising both aesthetics and material longevity. Material-dependent behavior can be explained by the chemical nature of SARCs. Maxcem Elite™ contains a highly hydrophilic monomer (HEMA), which facilitates water uptake and enhances pigment infiltration. Conversely, SPC and RLX are UDMA-based materials, incorporating a less hydrophilic monomer that promotes denser matrix structures and offers superior resistance to discoloration and surface degradation. While the organic matrix composition is widely recognized as a key factor in color stability, its role in surface roughness evolution has received comparatively less attention. Direct comparative studies between HEMA- and UDMA-based materials remain limited.31, 32 Filler content may also play a role in the superior performance of RLX. The combination of ytterbium(III) fluoride and silanized glass fillers may contribute to increased matrix density and reduced water sorption. The extent to which smaller filler particles enhance color stability and surface resilience remains unclear, as a particle-size analysis was not included in the scope of this study.
Recent studies have emphasized the importance of both polishing technique and material composition in determining the surface resilience of resin-based restoratives under acidic conditions. In particular, a recent investigation by Szalewski et al. revealed that nanohybrid composites showed no significant increase in surface roughness after immersion in highly acidic environments (pH = 2) over 21 days.33 This finding suggests that newer materials may exhibit enhanced resistance to acid-induced degradation due to optimized filler–matrix coupling, improved polymer networks, and the elimination of the oxygen inhibition layer.
While the present study focused on SARCs rather than nanohybrid composites, a similar trend was observed: RLX, a UDMA-based material with high filler content, exhibited minimal surface degradation across all media, including red wine. This finding aligns with the hypothesis that dense, hydrophobic matrices and well-integrated filler systems contribute to enhanced structural integrity in challenging environments. In contrast, HEMA-based materials, such as MXC and GCO, were more susceptible to pigment adsorption and roughness increase, likely due to their hydrophilic nature and increased water sorption.
Although polishing protocols were not part of the present experimental design, it is worth noting that surface finishing significantly influences roughness parameters, especially under acidic stress. Future investigations should integrate standardized polishing procedures and long-term acidic exposures to better simulate clinical realities, particularly in patients with high dietary acid intake or systemic conditions associated with reduced oral pH.
These results are in line with findings from a recent systematic review, which emphasized that the combination of mechanical and chemical surface treatments significantly enhances the bonding performance and surface integrity of dental ceramics and resin-based materials.34 This further supports the importance of optimized filler–matrix interactions and hydrophobic resin networks in resisting both discoloration and surface degradation, as observed in the present study for UDMA-based composites.
To address the inherent susceptibility of HEMA-based systems to degradation, recent experimental approaches have focused on modifying their composition using phosphate copolymers. These modifications aim to improve mechanical properties of the material and reduce water sorption, thereby enhancing both the structural stability and resistance to discoloration.35
Clinical interpretation based on the established thresholds
The clinical relevance of the observed color changes was evaluated using perceptibility and acceptability thresholds for ΔE00.36 In all staining conditions, the ΔE00 values for all tested SARCs exceeded the clinically acceptable threshold of ΔE00 = 2.7, indicating a heightened risk of aesthetically relevant discoloration. This was particularly evident in the red wine group, where all samples surpassed the acceptability threshold. None of the tested materials remained below the perceptibility threshold of ΔE00 = 1.1, thus confirming that all changes were visually detectable. Color changes exceeding the threshold of acceptability are generally considered disruptive to aesthetics and may compromise the long-term appearance of indirect restorations. However, clinical interpretation remains context-dependent: in the anterior region, especially in high-aesthetic cases such as veneers, even minor deviations may be unacceptable, whereas in posterior zones or at conversational viewing distances (e.g., 50–60 cm), values up to 3.7 for ΔE00 may still be considered tolerable.20, 36 These findings stress the importance of selecting highly color-stable SARCs such as RLX in anterior restorations, while slightly more stain-prone materials may be acceptable in less visible regions.
Limitations
Although conducted under rigorously standardized in vitro conditions, the findings of this study are limited in their generalizability to clinical practice. Intraoral factors such as salivary flow, biofilm formation, masticatory forces, temperature variations, and self-cleansing mechanisms could not be fully replicated. Moreover, common oral hygiene practices, such as tooth brushing or the use of dental cleansers, were not included in the study, despite their potential to substantially influence surface topography and stain accumulation. The choice of staining agents, while clinically relevant, does not encompass the full range of dietary habits. Furthermore, the interactions between dietary chromogens, salivary enzymes and oral microbiota were not addressed. To minimize the risk of overestimating discoloration due to superficial residue, all specimens were rinsed with distilled water and gently dried before undergoing color analysis. However, this standardized cleaning method cannot fully replicate the dynamic effects of intraoral self-cleansing mechanisms. Future investigations should include clinical studies that validate the in vitro results under realistic oral conditions, including the presence of biofilm, mechanical abrasion and the effects of oral hygiene interventions.
Consistent with the findings of Malysa et al., our results suggest that SARC materials may be particularly susceptible to hydrolytic degradation, especially under artificial aging conditions.37 Future studies should, therefore, integrate both thermal and mechanical aging protocols in order to better simulate intraoral challenges.
Conclusions
The color stability and surface integrity of contemporary SARCs are strongly influenced by their chemical composition and exposure to staining agents. Hydrophilic, HEMA-containing SARCs (MXC, GCO) exhibited the most pronounced changes in color and surface roughness, likely due to increased water uptake and pigment permeability. Red wine exhibited the strongest staining potential, which can be attributed to its high levels of anthocyanins and tannins. Coffee, matcha tea and artificial saliva showed progressively less staining potential. Increased surface roughness was associated with greater discoloration, emphasizing the importance of surface texture in pigment adhesion. This effect was most notable in MXC, which showed the greatest increase in roughness. In clinical setting, more hydrophobic, UDMA-based SARCs (RLX, SPC) are recommended, as they exhibit denser matrix structures, reduced water sorption and greater resistance to staining.
Ethics approval and consent to participate
Not applicable.
Data availability
The datasets generated and/or analyzed during the current study are available from the corresponding author on reasonable request.
Consent for publication
Not applicable.
Use of AI and AI-assisted technologies
Not applicable.