Abstract
Background. Cohen has emphasized that the recommended thresholds for effect sizes should only be used in the absence of detailed information about effect size distributions within specific fields.
Objectives. The study aimed to establish updated effect size thresholds (Cohen’s d, Hedges’ g and Pearson’s r) tailored for research in dentistry.
Material and methods. Following methodologies from prior research on effect sizes, the data was extracted from meta-analyses published in the top 10 ranked dentistry journals. The 25th, 50th and 75th percentiles were calculated for Pearson’s r values, as well as for Cohen’s d or Hedges’ g. A total of 4,250 studies were analyzed, with statistical analyses conducted using the R programming language.
Results. The 25th, 50th and 75th percentiles for Pearson’s r in individual differences research were 0.16, 0.40 and 0.67, respectively. For Hedges’ g, the percentiles corresponding to small, medium and large effect sizes were 0.10, 0.35 and 0.86, respectively.
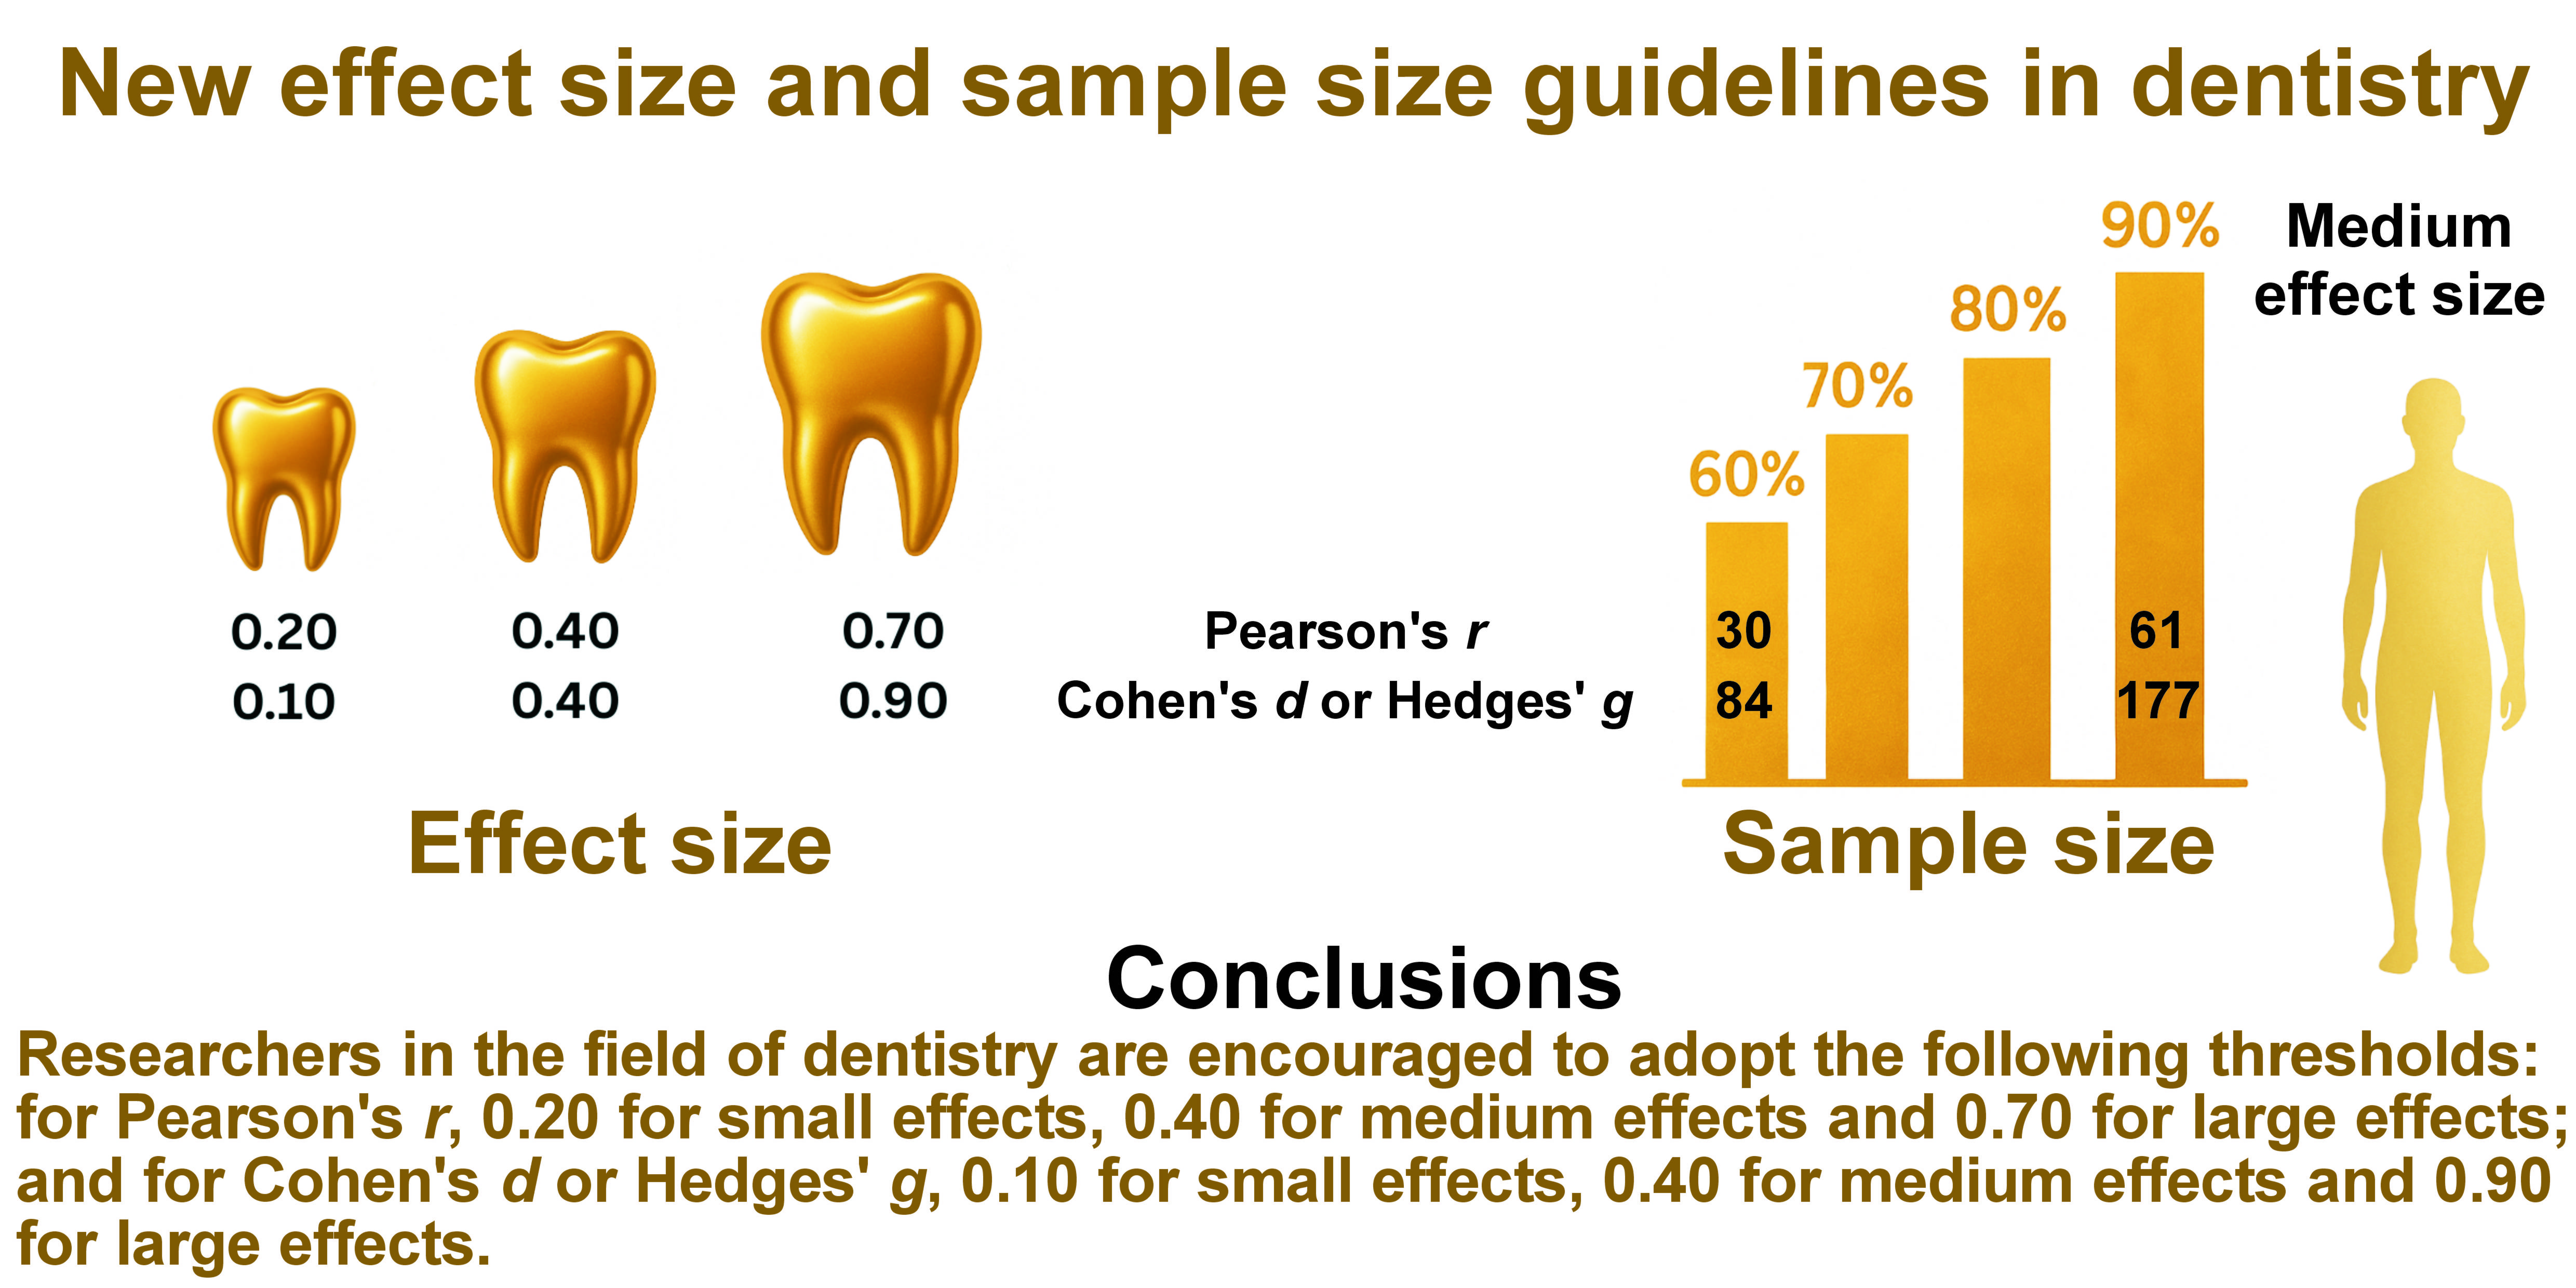
Conclusions. In light of these findings, researchers in the field of dentistry are encouraged to adopt the following thresholds: for Pearson’s r, 0.20 for small effects, 0.40 for medium effects and 0.70 for large effects; and for Cohen’s d or Hedges’ g, 0.10 for small effects, 0.40 for medium effects and 0.90 for large effects. These updated thresholds can improve the rigor and quality of dental research, ultimately benefiting patients through enhanced diagnostics and treatment strategies.
Keywords: dentistry, sample size, effect size, stomatology, statistical power
Introduction
Scientific research has a tangible impact on health of the population. Over the years, an increase in the number of studies has been observed, and a systematic rise is predicted.1 Alongside the growth in research quantity, quality should also improve. One factor determining the quality of research is the rigor of the statistical analysis.2 Contemporary research focuses primarily on reporting p-values for statistical significance, often neglecting the value of the effect size.2, 3
The significance of research findings is not always adequately represented by statistical significance.4, 5, 6, 7 Results that achieve the predetermined significance level may not be clinically significant, and vice versa.5 For example, in very large samples, statistical significance is almost always achieved, which may be misinterpreted (without analyzing the effect size) as sample variability.7 Therefore, regardless of statistical significance, researchers must assess whether the results are clinically meaningful and relevant to their scientific field.5
Recommendations for reporting effect sizes are systematically published to enhance the quality of scientific research, thereby improving decision-making in patient treatment.7, 8 Cohen is the most prominent researcher who provided guidelines for effect size analysis. He defined the following thresholds for Cohen’s d and Hedges’ g: 0.20 (small effect); 0.50 (medium effect); and 0.80 (large effect). For Pearson’s r, the established thresholds are 0.10 (small effect), 0.30 (medium effect) and 0.50 (large effect).9 However, it has been observed that effect sizes may vary across research fields.10
For instance, different thresholds have been developed for rehabilitation.11 To further refine the statistical framework, specific guidelines have been established for physiotherapy.12 In addition, thresholds have been formulated for gerontology,6 hearing research,5 and exercise-based treatments for tendinopathy,13 as well as for research related to the temporomandibular joint (TMJ) and masticatory muscles.14
To date, no guidelines for Cohen’s d, Hedges’ g or Pearson’s r specific to dentistry have been identified. Dentistry, as a branch of medicine, differs significantly from other medical fields. These differences are evident from the outset, including preclinical and clinical education for dentistry students compared to medical students.15, 16, 17, 18, 19, 20, 21 Further distinctions emerge in professional practice, with unique methods of treatment and patient care.20, 22, 23, 24, 25, 26 The analysis of the function, pathologies, and treatment of teeth, periodontium, tongue, oral mucosa, and surrounding tissues, as well as TMJ, sets dentistry apart from other medical fields.14, 27, 28, 29 Based on these differences, it is rational to investigate whether distinct effect size thresholds exist in dentistry, as observed in other medical fields.5, 6, 30
This issue is of particular concern in the context of public health. The World Health Organization (WHO) has noted a strong relationship between socioeconomic status and the prevalence and severity of oral diseases. This connection has been observed across various populations, ranging from childhood to advanced age.31
Dental diseases affect a significant proportion of the population. The global prevalence of dental caries in primary teeth among children is 46%, while the prevalence of caries in permanent teeth among children reaches 54%.32 Periodontal disease in adults is estimated to impact around 62% of the population, with severe periodontitis occurring in 24%.33 Approximately 22% of individuals experience edentulism.34 Sleep bruxism is present in 21% of the population, while daytime bruxism afflicts 23%.35 Temporomandibular disorders affect 34% of the population, and it is projected that by 2050 this figure will rise to 44%.36
Cleft palate has been diagnosed in 33% and cleft lip in 30% of cases involving cleft conditions, with cleft lip and palate occurring approximately once in every 1,000 live births.37 Cancers of the lip, oral cavity, and pharynx account for about 4% of all cancer cases and 4% of all cancer-related deaths worldwide.38 In the past decade, noma has been diagnosed in at least 23 countries.39 Oro-dental trauma affects about 20% of children.31 These are just a few examples of conditions and disorders associated with dentistry. This highlights the importance of improving research methods, including statistical approaches, within this field.
Considering the abovementioned information, a study was conducted to establish novel effect size thresholds (Cohen’s d, Hedges’ g and Pearson’s r) for research in dentistry.
Material and methods
The project was initially registered with the Open Science Framework (OSF).40
The search procedure was replicated in accordance with the methodology outlined by Brydges.6 Ten journals were searched: Journal of Dental Research (ISSN 0022-0345); Journal of Endodontics (ISSN 0099-2399); Dental Materials (ISSN 0109-5641); International Endodontic Journal (ISSN 0143-2885); Journal of Dentistry (ISSN 0300-5712); Oral Surgery, Oral Medicine, Oral Pathology and Oral Radiology (ISSN 2212-4403); Journal of the American Dental Association (ISSN 0002-8177); Community Dentistry and Oral Epidemiology (ISSN 0301-5661); Caries Research (ISSN 0008-6568); and Journal of Oral Rehabilitation (ISSN 0305-182X). The identification of these journals was conducted using the Scimago Journal & Country Rank database,41 with a selection of the “dentistry (miscellaneous)” category and a sorting method based on the highest H-index over the entire period.2, 6, 12, 14, 42 The list of journals was created at the beginning of the project on August 12, 2024.40
Considering the continuous development of dentistry, the search period was constrained to the last 20 years, a decision informed by prior studies.12, 14, 35, 43, 44 Articles published between December 31, 2003, and December 31, 2023, were reviewed. The search focused on studies containing the term “meta” in the title during the specified timeframe. The following types of articles were excluded from the analysis: editorials; corrections; correspondence; short communications; conference abstracts; and reviews that did not involve meta-analyses, such as systematic reviews, narrative reviews and scoping reviews. Subsequently, full-text articles were analyzed.
A database similar to the one created by Brydges6 was constructed, containing the Digital Object Identifier (DOI) numbers of the meta-analyses, along with information on study category, authors, publication year, sample size, and effect size. A total of 4,250 records were screened, and 567 meta-analyses were included for full-text analysis. In 326 publications, none of the studied effect sizes (Cohen’s d, Hedges’ g, or Pearson’s r) were reported. Individual effect sizes were not specified in 89 studies. In 17 studies, data was missing (e.g., sample size explicitly tied to the effect size was not available). Ultimately, 135 meta-analyses were included in the analysis. Comprehensive details regarding the studies, the reasons for exclusion, and the number of included studies per journal are provided in the supplementary materials.
Statistical analysis
In the current study, 2 types of analyses were conducted: studies estimating effects within a group over time (test–retest); and studies evaluating differences between 2 groups. For the within-group analyses, the effect size was measured using the Pearson’s r correlation coefficient, while for the between-group analyses, the effect size was quantified using Hedges’ g.
The evaluation of effect sizes was based on Cohen’s convention for small, medium and large effects. For the calculation of correlation coefficients, the thresholds were set at 0.10, 0.30 and 0.50, respectively. For between-group differences, the corresponding thresholds were 0.20, 0.50 and 0.80.9
The distribution of effect sizes was made by calculating a range of percentiles for both Pearson’s r and Hedges’ g. In line with previous literature,6, 30, 45 the 25th, 50th (median) and 75th percentiles were interpreted as approximate indicators of small, medium and large effects according to Cohen’s guidelines.9, 46 It should be noted, however, that this comparison is conceptual and does not assume that the underlying distribution of effect sizes perfectly aligns with Cohen’s benchmarks. This convention does not imply that the distribution of effect sizes in the current data was symmetric.
Additionally, percentiles were determined for 2 subsamples of Hedges’ g effect sizes, with studies classified into biopsychosocial, diagnosis, health promotion and prevention, and treatment categories according to the research focus of the meta-analysis. Furthermore, to account for the specificity of dental research, an additional division into 7 descriptive subgroups was made: cariology; periodontology; fixed and removable prosthodontics; oral surgery; orthodontics; endodontics; and conservative dentistry. These subgroup analyses were exploratory in nature and aimed to provide a descriptive overview of effect size distributions across research domains. No inferential statistical comparisons were performed between the subgroups; hence, no adjustments were applied for multiple comparisons.
To assess potential inflation bias, one-directional contour-enhanced funnel plots were generated. In these plots, effect sizes are plotted against their corresponding standard errors, with added contour regions representing key levels of statistical significance. Specifically, the orange-shaded region corresponds to the range of 0.10 > p > 0.05, while the red-shaded region corresponds to 0.05 > p > 0.01.6, 12, 14 An excessive proportion of studies falling within these contours may indicate the presence of inflation bias, suggesting that the reported effect sizes could be overestimates of the true effect sizes. Such inflation may result from factors such as sampling error, publication bias or p-hacking. These funnel plots serve as a diagnostic tool to identify potential biases in the reported data.
A series of a priori power analyses were conducted to determine the sample sizes required for future research to achieve various levels of statistical power for both within-group and between-group differences, including biomedical and psychosocial subsamples. For within-group differences, calculations were based on correlation analyses, while for between-group differences, calculations assumed a two-sample comparison with equal group sizes.
All analyses utilized a two-tailed alpha level of 0.05 and estimated the sample sizes necessary to achieve power levels of 60%, 70%, 80%, and 90% for small, medium and large effect sizes, corresponding to the 25th, 50th and 75th percentiles of the observed effect size distributions, respectively. These calculations provide critical benchmarks for designing adequately powered future studies.6, 12, 14
The analyses were conducted using the R programming language (v. 4.3.3; R Foundation for Statistical Computing, Vienna, Austria) on a Windows 11 Pro 64-bit operating system (build 22631; Microsoft Corporation, Redmond, USA). A comprehensive description of the statistical analysis, including the use of packages in the R language, the estimation of effect sizes for individual studies with group differences, the estimation of variance for Hedges’ g, and the random-effects model, is provided in the supplementary material 2.
Results
Characteristics of the sample
The analysis encompassed a total of 4,250 dentistry studies, which were categorized into 4 research domains: biopsychosocial (n = 127, 2.99%); diagnosis (n = 796, 18.73%); health promotion and prevention (n = 271, 6.38%); and treatment (n = 3,056, 71.91%). Two types of effect sizes were utilized in the studies: those measuring between-group effects (Hedges’ g, n = 4,038, 95.01%), and those measuring within-group effects (Pearson’s r, n = 212, 4.99%). The median group sizes ranged from 20 to 24, with an interquartile range of 12–45. The complete database of publications used in the analyses is available in the supplementary material 3.
Within-group differences
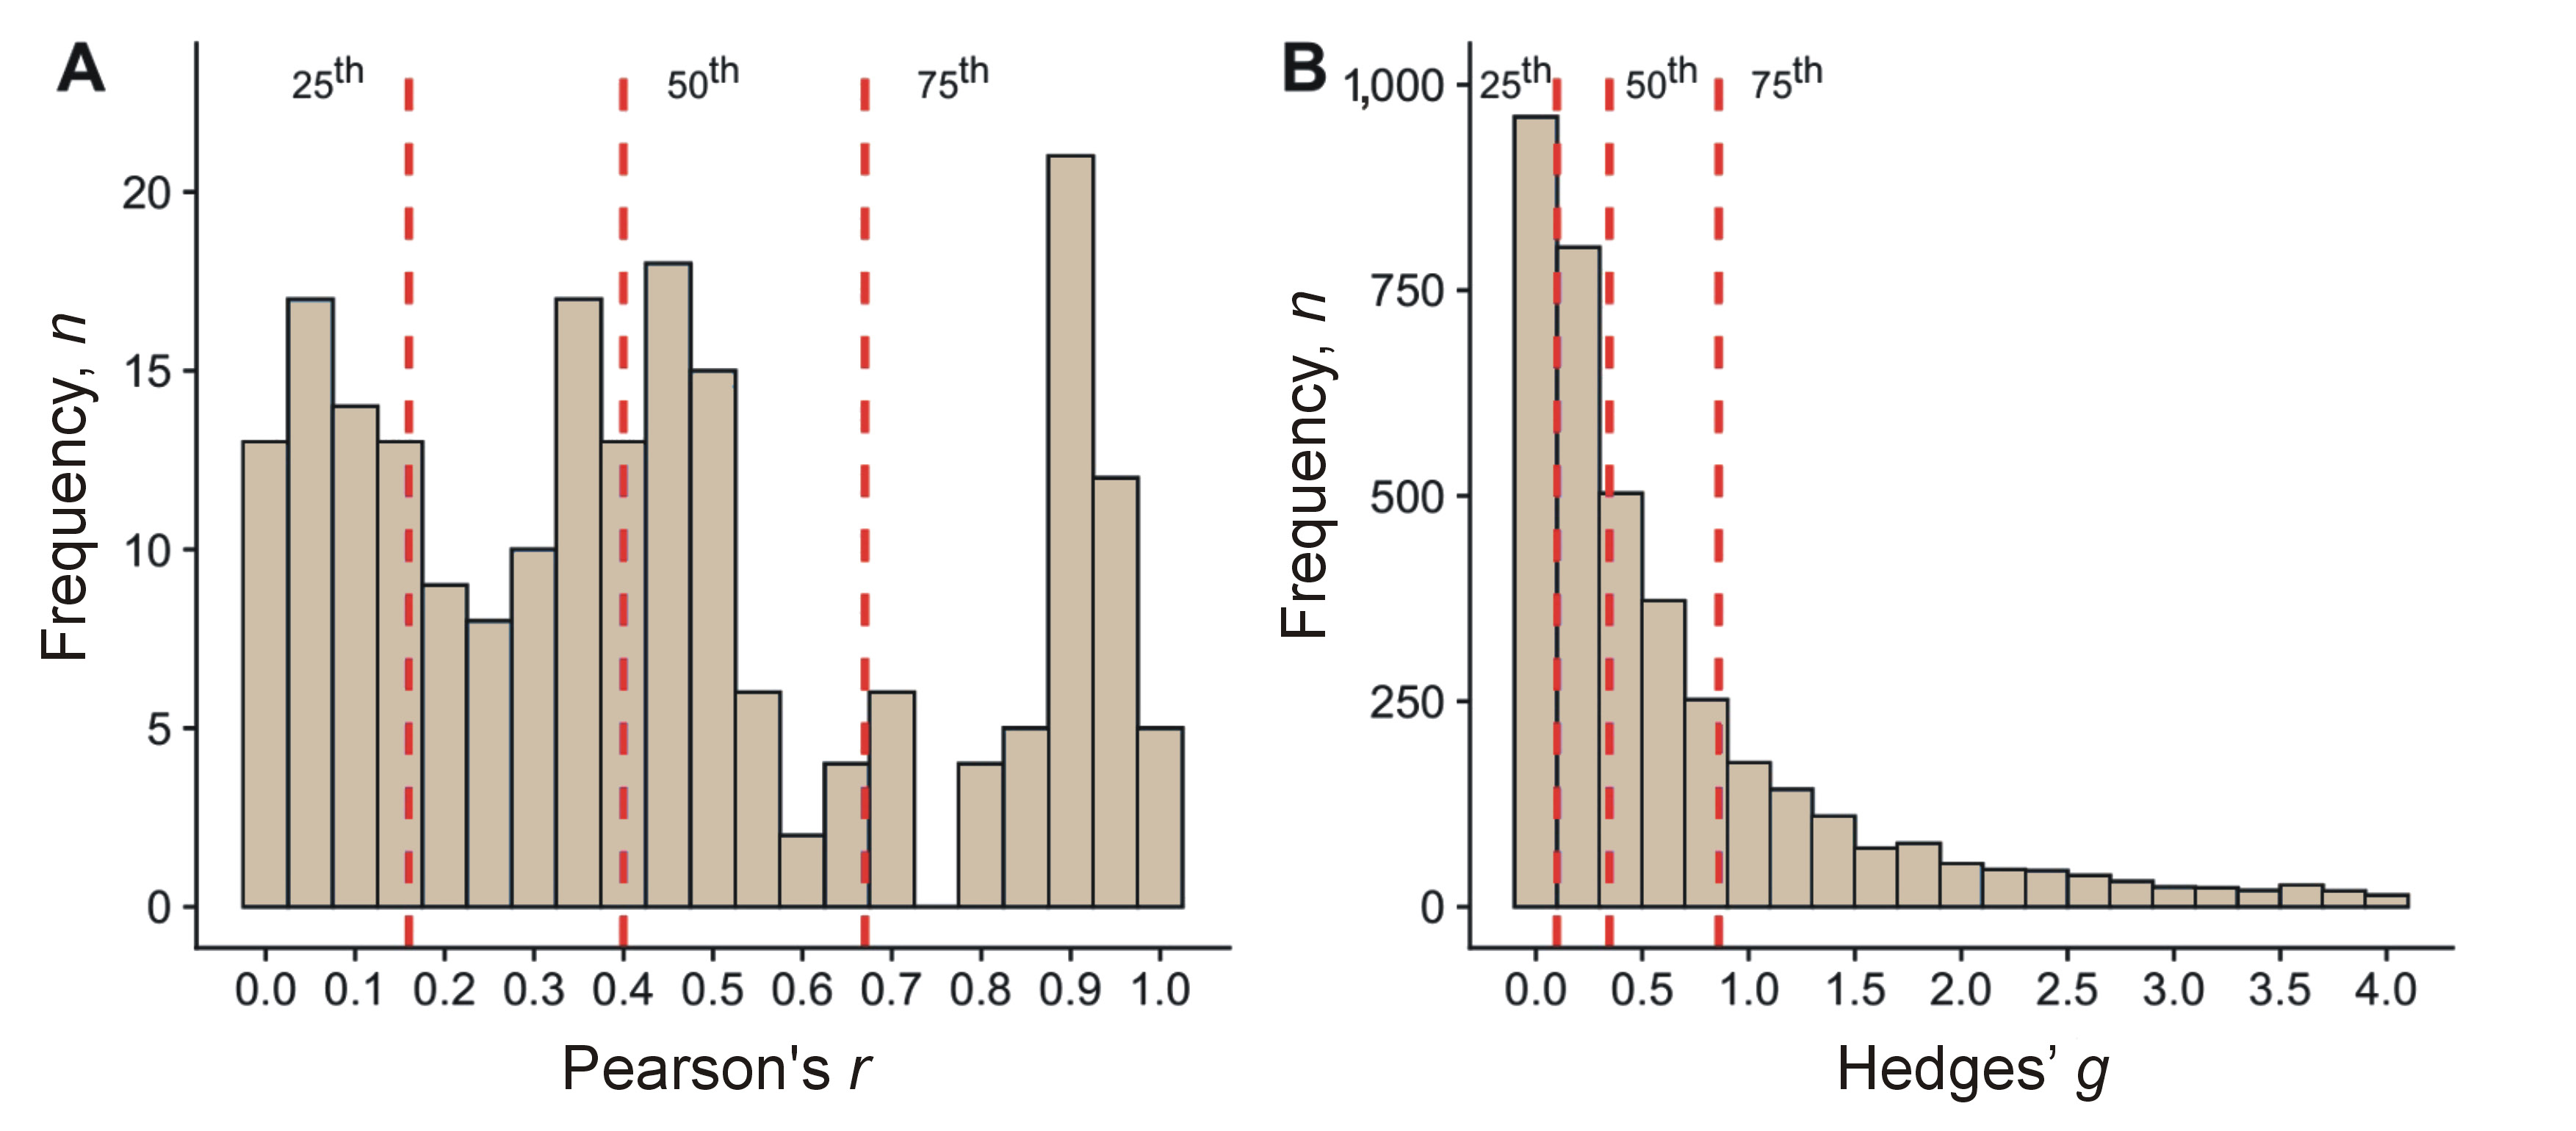
The first (25%), second (50%) and third (75%) percentiles for within-group differences research corresponded to Pearson’s r values of 0.16, 0.40 and 0.67, respectively (Table 1,Table 2). This finding indicates that, in dentistry research focused on individual differences, the median effect size is Pearson’s r = 0.40.
The observed effect sizes were noticeably higher than those in Cohen’s guidelines for small, medium and large effects, with differences ranging from 0.06 for small effects to 0.17 for effects classified as large (Table 2). Compared to Cohen’s benchmarks, only 64.2% of the observed correlations would qualify as medium effects or stronger (r ≥ 0.30), and just 34.0% would be classified as strong effects (r ≥ 0.50).
The distributions of effect sizes for within-group and between-group differences in Figure 1A and Figure 1B are reported with 25th, 50th and 75th percentiles corresponding to small (r = 0.16, g = 0.10), medium (r = 0.40, g = 0.35) and large (r = 0.67, g = 0.86) effects, respectively. This indicates that the majority of observed relationships in dentistry research on individual differences are of medium to large size, suggesting clinically meaningful associations in this domain. Additionally, it is important to emphasize the differences observed in the domains of dentistry: in oral surgery, the small effect was 0.08, the medium effect was 0.27 and the large effect was 0.66; in orthodontics, the respective values were 0.40, 0.93 and 1.87; in periodontology, the values were 0.11, 0.29 and 0.63; in cariology – 0.10, 0.40 and 1.01; in conservative dentistry – 0.10, 0.31 and 0.73; in endodontics – 0.04, 0.19 and 0.77; and in fixed and removable prosthodontics – 0.56, 1.54 and 3.35 (Table 2). It should be noted that most of the effects for between-group differences were below the thresholds recommended by Cohen.
The median sample size for within-group differences was 117 participants. This sample size is large enough to detect a medium (r = 0.40; power = 1.00) or large effect (r = 0.67; power = 1.00), but not to detect a small effect (r = 0.16; power = 0.41).
A visual assessment of the distribution of effect sizes was prepared to evaluate potential publication bias and the symmetry of the effect size distributions within each domain. Contour lines indicate the regions of statistical significance (supplementary material 2: Fig. 2).
A total of 70.95% of the studies demonstrated sufficient power to detect a medium effect, as indicated by their distribution within the gray region of the contour-enhanced funnel plot (supplementary material 2: Fig. 2A,3) (Table 3), corresponding to p < 0.01. Furthermore, the funnel plot did not exhibit an overrepresentation of just-significant results (p-values: 0.05–0.01, represented by the red region) or marginally significant results (p-values: 0.10–0.05, represented by the orange region). This pattern indicates that inflation bias, including potential concerns such as publication bias or p-hacking, is unlikely to pose a significant issue in dentistry studies investigating individual differences.
The sample size calculations presented in Table 4 provide critical benchmarks for designing future studies in individual differences research. Achieving adequate statistical power necessitates the determination of the required sample size, which varies substantially depending on the effect size and the desired power level. For small effects (r = 0.16), achieving 80% power requires a sample size of 304, which increases to 406 for 90% power, indicating the need for larger samples to reliably detect subtle effects. For medium effects (r = 0.40), a sample size of 46 is sufficient for 80% power, while for large effects (r = 0.67), only 15 participants are needed to achieve the same power level.
Only 62% of the analyzed studies were adequately powered to detect a medium effect, and nearly 90% were powered to identify a large effect.
Between-group differences
In the between-group differences sample, the 25th, 50th and 75th percentiles corresponded to Hedges’ g values of 0.10, 0.35 and 0.86, respectively (Table 1,Table 2). For small and medium effects, these values are lower than Cohen’s benchmarks of 0.20 and 0.50,9, 46 while for large effects, the 75th percentile exceeds Cohen’s guideline of 0.80. A comparison of these results with Cohen’s recommendations reveals that only 40.4% of the observed effect sizes in this sample would qualify as medium or stronger effects (g ≥ 0.50), and just 27% would be considered large (g ≥ 0.80). This finding indicates that a substantial proportion of the observed group differences reflects smaller-than-expected effects, based on established guidelines.
An examination of specific research domains revealed significant variability. In biopsychosocial studies, the derived thresholds for small (g = 0.05), medium (g = 0.14) and large (g = 0.36) effects are substantially smaller than those reported in Cohen’s guidelines, indicating that even the modest effects within this domain hold practical significance. Similarly, diagnostic studies show lower thresholds for small (g = 0.05) and medium (g = 0.18) effects, with large effects (g = 0.51) aligning more closely with Cohen’s recommendations.
Health promotion and prevention studies have demonstrated thresholds for small, medium and large effects (g = 0.09, g = 0.27 and g = 0.80, respectively) that are closer to Cohen’s benchmarks, particularly for large effects. Treatment studies have revealed thresholds (g = 0.15, g = 0.50 and g = 1.29, respectively) that closely align with or exceed Cohen’s benchmarks, especially for large effects.
A visual representation of the variation in effect sizes within each category highlighted the differences in the distribution of study outcomes (supplementary material 2: Fig. 4,5). The treatment category demonstrates a wide distribution of effect sizes, with a peak around moderate values of Hedges’ g and a noticeable tail extending into higher effect sizes. The health promotion and prevention category shows a narrower distribution, with the majority of effect sizes clustering around smaller to moderate values. The diagnosis domain exhibits a sharply peaked distribution, concentrated around smaller effect sizes, with a steep decline as the values increase. The biopsychosocial category has a similarly narrow distribution, with most studies reporting smaller effect sizes and a small proportion extending to moderate values.
The median sample sizes for the case and control groups were 24 and 20 participants, respectively. These sample sizes are insufficient to reliably detect a large (g = 0.86; power = 0.79), medium (g = 0.35; power = 0.20), or small effect (g = 0.10; power = 0.06). Notably, only 6% of the studies included in the analysis were adequately powered to detect a medium effect (g = 0.35) with a statistical power of 0.80. This finding highlights a critical limitation in the statistical power of most studies, emphasizing the need for larger sample sizes in future research to ensure the robustness and reliability of findings.
The data presented in Table 3 further supports the conclusion that inflation bias is unlikely to have a significant impact on dentistry studies that investigate group differences. Across all studies, only 5.19% of results fall within the orange region (marginally significant results: 0.10 ≥ p > 0.05), and 8.00% fall within the red region (just-significant results: 0.05 ≥ p > 0.01). A similar pattern is observed across specific research categories. Treatment studies indicated 4.90% of results in the orange region and 7.61% in the red region. Health promotion and prevention studies showed 6.59% in both regions. Diagnosis studies demonstrated 4.62% in the orange region and 7.34% in the red region. Finally, biopsychosocial studies indicated 3.28% in the orange region and 8.20% in the red region. The relatively low proportion of results in these regions, combined with the high percentage of robustly significant findings in the gray region (p < 0.01), suggests that inflation bias, including publication bias or p-hacking, is unlikely to be a major concern in these studies.
The sample size requirements presented in Table 5 provide insights into the feasibility of achieving adequate statistical power in between-group differences research across various dentistry domains.
For all studies combined, detecting small effects (g = 0.10) with 80% power requires substantial sample sizes (n = 1,628), while medium (g = 0.35) and large (g = 0.86) effects require significantly fewer participants (n = 133 and n = 23, respectively). This underscores the challenge of reliably detecting small effects, which necessitate much larger sample sizes compared to medium or large effects.
When examining specific dentistry domains, considerable variability in sample size requirements is evident. In the context of biopsychosocial studies, detecting small effects (g = 0.05) with 80% power demands an extremely large sample size (n = 6,292), while medium (g = 0.14) and large (g = 0.36) effects require 811 and 126 participants, respectively. Similarly, diagnosis studies require large samples to detect small effects (g = 0.05; n = 6,292), with moderate reductions for medium (g = 0.18; n = 471) and large effects (g = 0.51; n = 61). These results highlight the difficulty of achieving sufficient power in studies that target small effects within these domains.
In health promotion and prevention studies, the sample size requirements are comparatively moderate. The detection of small effects (g = 0.09) necessitates a sample size of 2,168 individuals to achieve 80% power, while medium (g = 0.27; n = 222) and large (g = 0.80; n = 26) effects are more easily achievable. Treatment studies, in contrast, have demonstrated the most favorable sample size requirements. For small effects (g = 0.15), a sample of 727 participants is required to attain 80% power, while medium (g = 0.50; n = 64) and large (g = 1.29; n = 11) effects require considerably smaller samples.
Additionally, it is important to observe how sample size requirements vary across different categories of dentistry. For example, to detect small effects with 60% power (g = 0.08) in oral surgery, a sample size of 62 participants is needed. Within the same category, detecting large effects (g = 0.66) would require only 6 individuals. However, under the same assumptions (small effect and 60% power), cariology would require a sample of 904 patients, while detecting large effects in this category would necessitate a study sample of 11 participants. In each of the presented categories of dentistry, the results highlight the difficulty of achieving sufficient statistical power in studies targeting small effects in these areas (Table 5).
For large effects with 90% power, a distinct picture emerges. In oral surgery (g = 0.66), a sample size of 7 individuals is needed; in orthodontics (g = 1.87) – 50; in periodontology (g = 0.63) – 55; in cariology (g = 1.01) – 22; in conservative dentistry (g = 0.73) – 41; in endodontics (g = 0.77) – 37; and in fixed and removable prosthodontics (g = 3.35) – 3.
These findings demonstrate that conducting studies focused on detecting large effects is highly feasible for researchers within each category of dentistry.
Discussion
The growing significance of dental diseases and the increasing proportion of affected individuals is evident. Beyond the percentage-based data, this trend is also reflected in the rising number of scientific publications focused on dental research, as well as in the specific nature of the discipline itself.
The aim of the study was to establish novel, data-driven thresholds for effect sizes (Cohen’s d, Hedges’ g and Pearson’s r) relevant to dental research, rather than relying on general, arbitrary benchmarks that may not adequately reflect the specific characteristics of the field. Additionally, the study offers guidance on the minimum required sample size, contingent upon statistical power. The inclusion of information regarding sample size and effect size calculations in standardized sections of research papers constitutes a key component of transparent reporting.2
It is important to acknowledge that, while Cohen’s benchmarks serve as a useful comparative tool, their application should not be done without careful consideration of the clinical context.12, 47, 48 Cohen’s thresholds are arbitrary and fail to account for clinical relevance, domain-specific nuances or individual patient needs.
For this reason, researchers are encouraged to explore alternative approaches and to consider effect size as part of a broader clinical evaluation process, rather than as a definitive indicator of an intervention’s value. The clinical significance of a change is not solely determined by its effect size. As Sullivan and Feinn have observed, p-values indicate statistical significance, whereas effect sizes convey the magnitude of the difference.7 However, it is only within a clinical context that one can assess whether a change holds real value for the patient.7
Therefore, when interpreting results, it is essential to consider p-values, effect sizes, patient-reported outcomes, functional performance, and clinical judgment collectively. It is crucial not to rely solely on numerical indicators. Clinical relevance should emerge from a comprehensive analysis that accounts for individual needs, therapeutic decisions, treatment conditions, and the patient’s quality of life. From this perspective, the new effect size thresholds do not replace clinical judgment but are intended to serve as a tool to facilitate the interpretation of findings.7, 12, 47, 48
The results of this analysis indicate that the majority of observed effect sizes in dental research deviate substantially from the thresholds proposed by Cohen. In particular, the majority of the effects were smaller than Cohen’s benchmarks, which calls into question the validity of using Cohen’s thresholds as reference points in the field of dentistry.
In the present study, it was observed that for Pearson’s r, values of 0.16 (≈ 0.20) represented small effects, 0.40 indicated medium effects and 0.67 (≈ 0.70) corresponded to large effects. For Hedges’ g, the established thresholds were 0.10, 0.35 (≈ 0.40) and 0.86 (≈ 0.90). Calculations were also performed separately for individual domains within dentistry, such as oral surgery, orthodontics, periodontology, cariology, conservative dentistry, endodontics, and both fixed and removable prosthodontics (Table 3).
With regard to within-group differences (Pearson’s r), Cohen’s original thresholds are inadequate for research in dentistry. Our results also exceed those reported by Gignac and Szodorai for psychological studies,49 Brydges’ estimates in gerontology research6 and Zieliński for physiotherapy.12 When comparing the effect sizes obtained in the present study for Hedges’ g (0.10, 0.40 and 0.90), it can be observed that the thresholds for small effects are consistent with those established for TMJ and masticatory muscle research.14 However, a discrepancy in the values for medium and large effects is evident. In the broader field of dentistry, medium and large effect size thresholds are elevated by 0.10 and 0.20, respectively. This highlights the specificity of the discipline under investigation.
A significant observation presented in Table 4 and Table 5 highlights their value as a framework for planning future studies in individual differences research. The minimum sample size requirements to ensure adequate statistical power vary considerably depending on effect size and the desired power levels. For small effects (r = 0.16), achieving 80% power requires a sample size of 304, increasing to 406 for 90% power. This underscores the need for larger samples to ensure reliable detection of small effects. In contrast, medium effects (r = 0.40) require 46 participants for 80% power, while large effects (r = 0.67) require just 15 participants to achieve the same power level. Table 4 and Table 5 provide practical guidelines on the appropriate sample size needed for dental studies across the aforementioned fields of dentistry, based on specific assumptions regarding statistical power and effect size.
Limitations
This study has several limitations that should be acknowledged. First, the investigation was restricted to meta-analyses that were published over a 20-year period. Although this temporal constraint may limit the study’s scope, it aligns with the dynamic nature of dental and medical research and reflects current developments in the field.12, 14, 49 A key limitation is the potential for systematic biases, such as publication bias, sampling error, and questionable research practices (e.g., p-hacking), which may distort the distribution and interpretation of effect sizes.6, 50, 51 These risks have been extensively documented in meta-research and are acknowledged in similar studies.5, 6, 12, 14, 49 The study relied solely on published data, assuming that the original authors applied appropriate statistical methods. While this is considered standard practice, there is a risk that the included studies may have failed to meet methodological standards.5, 6, 12, 14, 49 On the other hand, the relatively large sample size strengthens the robustness and generalizability of the findings in comparison to prior studies.6, 14
In conclusion, the present study proposes updated, empirically-based effect size thresholds for dental research, grounded in discipline-specific data rather than arbitrary general values. These thresholds are not intended to replace clinical evaluation; rather, they are designed to serve as a tool that enhances the interpretation of the results, reporting transparency, and the planning of future studies. The clinical relevance of findings should be assessed by integrating statistical data with patient impact, expert judgment, and the broader healthcare context.
Conclusions
Based on these findings, researchers in the field of dentistry are encouraged to adopt the following thresholds: for Pearson’s r, 0.20 for small effects, 0.40 for medium effects and 0.70 for large effects; and for Cohen’s d or Hedges’ g, 0.10 for small effects, 0.40 for medium effects and 0.90 for large effects. These updated thresholds have the potential to improve the rigor and quality of dental research, ultimately benefiting patients through enhanced diagnostics and treatment strategies.
Ethics approval and consent to participate
Not applicable.
Data availability
The data related to this article, including supplementary materials, can be accessed in the Open Science Framework (OSF) database via the following link: https://osf.io/9fghx/files. The script used in the analysis is available from the corresponding author upon reasonable request.
Consent for publication
Not applicable.
Use of AI and AI-assisted technologies
Not applicable.