Abstract
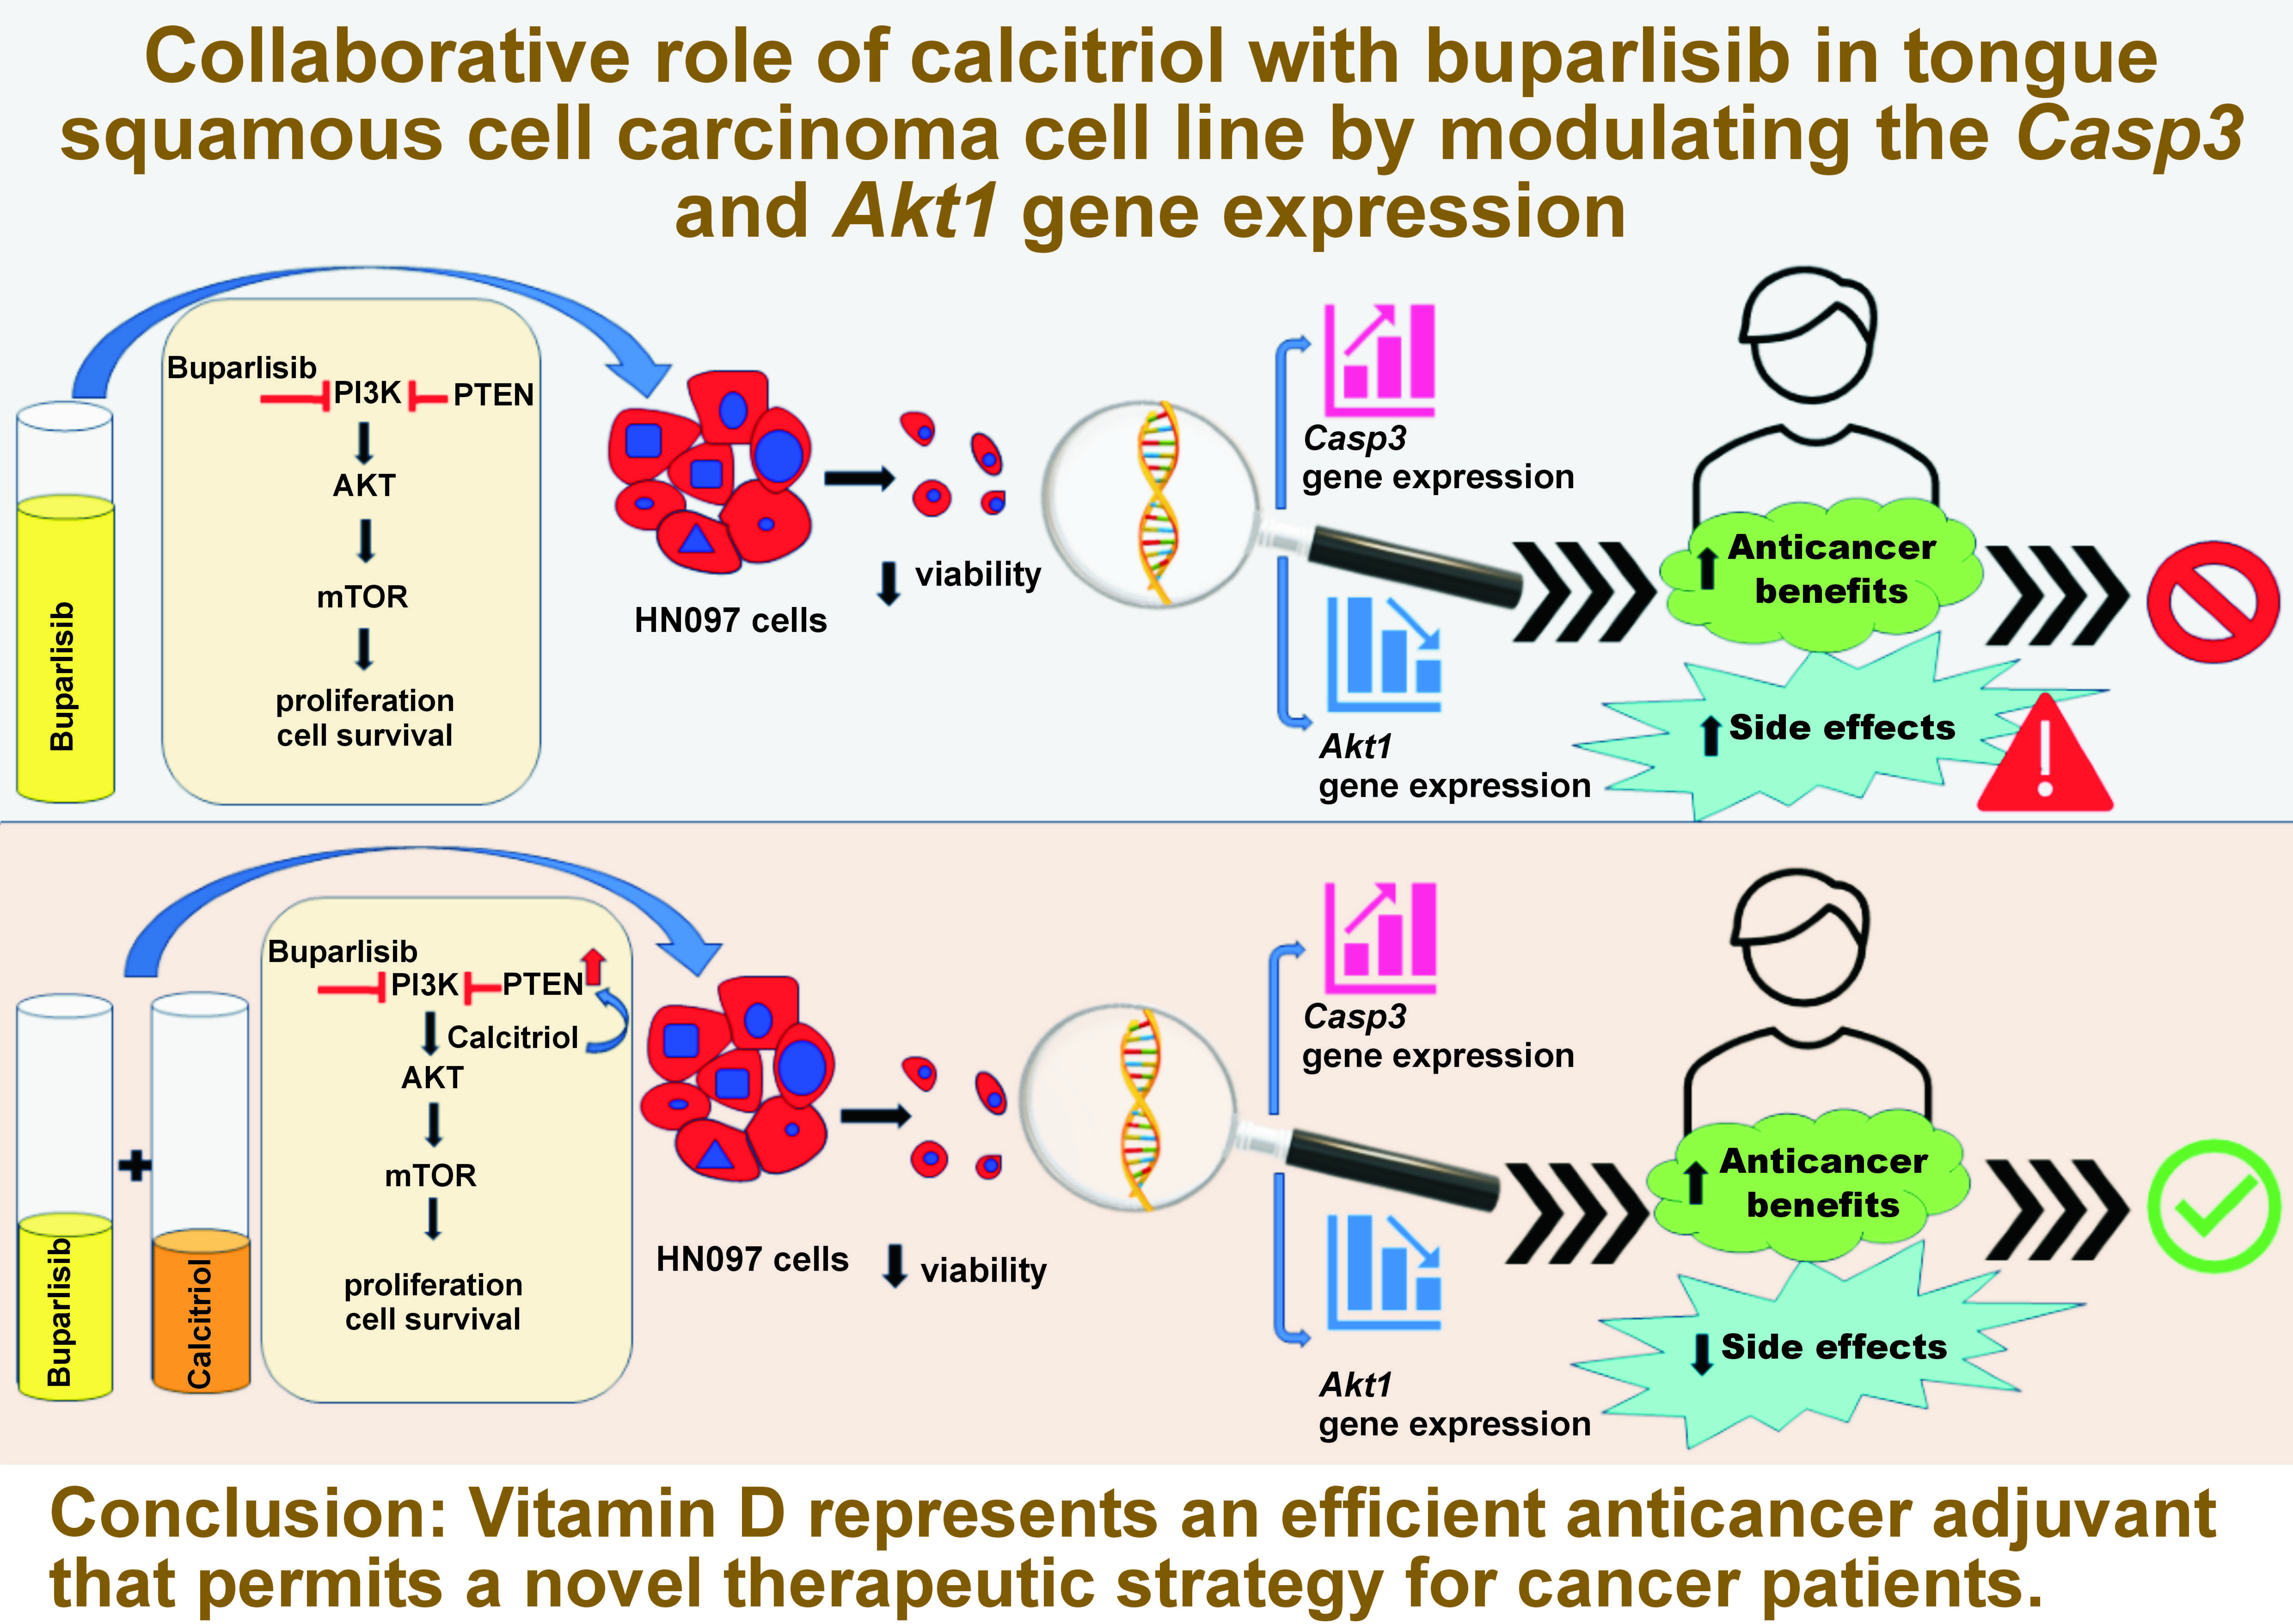
Background. Oral squamous cell carcinoma (OSCC) is a devastating disease with an increasing incidence. Among the commonly dysregulated pathways in oncogenesis are the phosphatidylinositol 3-kinase / protein kinase-B/ mammalian target of rapamycin (PI3K/AKT/mTOR) and apoptotic pathways. Buparlisib, a pan-class I PI3K inhibitor, has antineoplastic effects, but its associated toxicities hinder its beneficial role in patients. Calcitriol, active vitamin D (Vit D), possesses anticancer functions by targeting both pathways. Therefore, Vit D could help achieve low buparlisib doses and boost its effects.
Objectives. The present study aimed to determine the effects of buparlisib and Vit D, separately and in co-administration, on cell viability, as well as the apoptotic and PI3K pathways in the human tongue squamous cell carcinoma (TSSC) HNO97 cell line.
Material and methods. The MTT assay was used to estimate the IC50 and the IC70 buparlisib doses, which were then co-administrated with 100 nmol and 1,000 nmol Vit D. The quantitative real-time polymerase chain reaction (qRT-PCR) analysis was performed to evaluate the altered caspase-3 (Casp3) and Akt1 gene expressions after 48-hour treatment.
Results. The co-administration of either 100 nmol or 1,000 nmol Vit D lowered the IC50 and the IC70 buparlisib doses. The qRT-PCR showed that for Casp3 expression, the 4 combination groups differed significantly from the IC50 and IC70 buparlisib doses. For Akt1 expression, the IC70 co-administration dose of buparlisib with 100 nmol Vit D, the IC50 co-administration dose of buparlisib with 1,000 nmol Vit D and the IC70 co-administration dose of buparlisib with 1,000 nmol Vit D were significantly different from the IC50 buparlisib dose. The IC70 buparlisib dose showed no significant alteration from the 4 combination groups.
Conclusions. Vitamin D represents an efficient anticancer adjuvant that permits a novel therapeutic strategy for cancer patients.
Keywords: caspase-3, vitamin D, AKT1 protein, BKM120, oral tongue squamous cell carcinoma
Introduction
Oral squamous cell carcinoma (OSCC) comprises more than 90% of oral cancers, which persist as one of the leading causes of mortality worldwide. Regardless of improved remedies, the 5-year survival rate of head and neck squamous cell carcinoma (HNSCC) remains close to 50%.1, 2, 3, 4
Neoplastic cells may dysregulate the apoptotic pathway by inducing caspase-3 (Casp3) aberrant gene expression. Therefore, anticancer medications should redirect cancer cells toward apoptosis to optimize their effects.5 The phosphatidylinositol 3-kinase / protein kinase-B / mammalian target of rapamycin (PI3K/AKT/mTOR) pathway is frequently aberrated in human cancer. This critical pathway mediates various oncogenic events, such as cell growth, survival and proliferation.6
Buparlisib, a pan-PI3K inhibitor, impedes the phosphorylation of the 4 class I PI3K isomers with the subsequent inhibition of the PI3K/AKT/mTOR pathway. Buparlisib was applied in several clinical trials as a single agent or combined with other drugs. Nevertheless, several toxicities developed, hindering its use.7, 8 Calcitriol is the active form of the lipid-soluble hormone vitamin D (Vit D). Prior studies recommended assessing the impact of Vit D on carcinogenesis and cancer progression.9, 10 One of the mechanisms by which Vit D mediates its anticancer functions is modulating the PI3K/AKT/mTOR and apoptotic pathways.11
Accordingly, if Vit D could enhance the anticancer functions of buparlisib, it might be possible to seize lower effective doses of buparlisib. Achieving low buparlisib doses expands its therapeutic application in cancer patients with relatively fewer side effects. Therefore, it could pave the way to approve buparlisib as a safe anticancer agent. The importance of Vit D in head and neck cancer and the potential benefits of its combination therapies are not yet fully understood.9, 10 The purpose of this study was to assess the impact of buparlisib and Vit D separately, as well as their co-administration, on cell viability, and the apoptotic and PI3K pathways of the human tongue squamous cell carcinoma (TSCC) HNO97 cell line.
Material and methods
Cell culture
The human TSCC cell line (HNO97) was acquired from Cell Lines Service (CLS, Eppelheim, Germany). Buparlisib (BKM120) (ab273384) and calcitriol, Vit D receptor (VDR) agonist (ab141456), were obtained from Abcam (Cambridge, UK). The stock solutions for each agent were adjusted by dilution in dimethyl sulfoxide (DMSO) and kept at –20°C until further use. All cell culture reagents were purchased from Gibco (Thermo Fisher Scientific, Dreieich, Germany). They included Dulbecco’s Modified Eagle’s Medium (DMEM), fetal bovine serum (FBS), 1% penicillin G sodium (10.000 IU), streptomycin (10 mg), phosphate-buffered saline (PBS), and 0.25% trypsin-EDTA solution.
The cells were maintained in F-12K containing DMEM, supplemented by 1% penicillin/streptomycin in 10% FBS. The flask was incubated at 37°C in a 5% CO2 humidified atmosphere. The medium was replenished 2–3 times per week. After reaching 70–80% confluence, trypsin was added, followed by a PBS wash to allow subculturing.
MTT assay and the determination of the IC50 and IC70 buparlisib doses
For determining the IC50 and IC70 buparlisib doses, the cells were inserted into 96-well plates, with approx. 1 × 10⁴ cells in 200 µL of the medium per well. Serial dilutions of buparlisib were prepared, with or without Vit D (100 nmol or 1,000 nmol), to achieve final concentrations of 0.195, 0.39, 0.78, 1.56, 3.125, 6.25, 12.5, 25, 50, and 100 µg/mL, and were added to the cells.
The study design comprised several groups: a control group of untreated cells (Con); IC50 buparlisib (B1); IC70 buparlisib (B2); the optimum dose of Vit D (100 nmol) (D1); a higher Vit D dose of 1,000 nmol (D2); IC50 co-administration dose of buparlisib with 100 nmol Vit D (C1); IC70 co-administration dose of buparlisib with 100 nmol Vit D (C2); IC50 co-administration dose of buparlisib with 1,000 nmol Vit D (C3); and IC70 co-administration dose of buparlisib with 1,000 nmol Vit D (C4).
The MTT assay was conducted following 48 h treatment to assess cell viability, using the Vybrant® MTT cell proliferation assay kit (catalog No. M6494; Thermo Fisher Scientific). Each well received 20 µL of the 3-(4,5-dimethylthiazole-2-yl)-2,5-diphenyltetrazolium bromide (MTT) solution (1 mg/mL) (Invitrogen, Thermo Fisher Scientific) and incubated at 37°C for 4 h. The MTT was replaced by 100 µL of sodium dodecyl sulfate with hydrochloric acid to dissolve the precipitated crystals. The absorbance was estimated using a spectrophotometer at wavelength 570 nm (ELx 800; Bio-Tek Instruments Inc., Winooski, USA).
Microscopic imaging
The LC-6 USB3.0 colorful CMOS digital camera (5MP) (Labomed Inc., Los Angeles, USA) was used to photograph the plates after 48-hour treatment at ×20 original magnification.
Quantitative real-time polymerase chain reaction (qRT-PCR)
A 12-well plate containing 100 µL of cell suspension and 1 mL of the medium with 1% penicillin-streptomycin, an antimycotic agent and 1% FBS was used for the PCR analysis. The selected primers for this study were obtained from Qiagen (Hilden, Germany). The primers ID for Casp3, Akt1 and β-actin were QT00023947, QT00085379 and QT00095431, respectively.
The RNeasy Mini Kit (catalog No. 74004; Qiagen) was utilized for extracting and purifying RNA from the treated and untreated cells. The procedures were carried out following the manufacturer’s instructions. The isolated RNA was reverse-transcribed into cDNA, using the QuantiTect Reverse Transcription Kit (catalog No. 205310; Qiagen).
The 2 genes of interest, Casp3 and Akt1, along with the housekeeping gene, β-actin, were amplified from cDNA, using the QuantiTect SYBR Green PCR kit (catalog No. 204141; Qiagen) on a Rotor-Gene 5-plex PCR analyzer (Qiagen). The corresponding fold changes in the gene expressions were estimated using the 2–ΔΔCt method.12
Statistical analysis
All experiments were performed in triplicate. Statistical analysis was conducted using the IBM SPSS Statistics for Windows, v. 22.0 (IBM Corp., Armonk, USA). The one-way analysis of variance (ANOVA) was applied, followed by post hoc Tukey’s test, to detect the presence of a statistically significant difference among the study groups. The results were presented as mean and standard deviation (M ±SD). The level of significance was set at p < 0.05.
Results
Determination of the IC50 and IC70 buparlisib doses, and the cytotoxic effects of different kinds of treatment
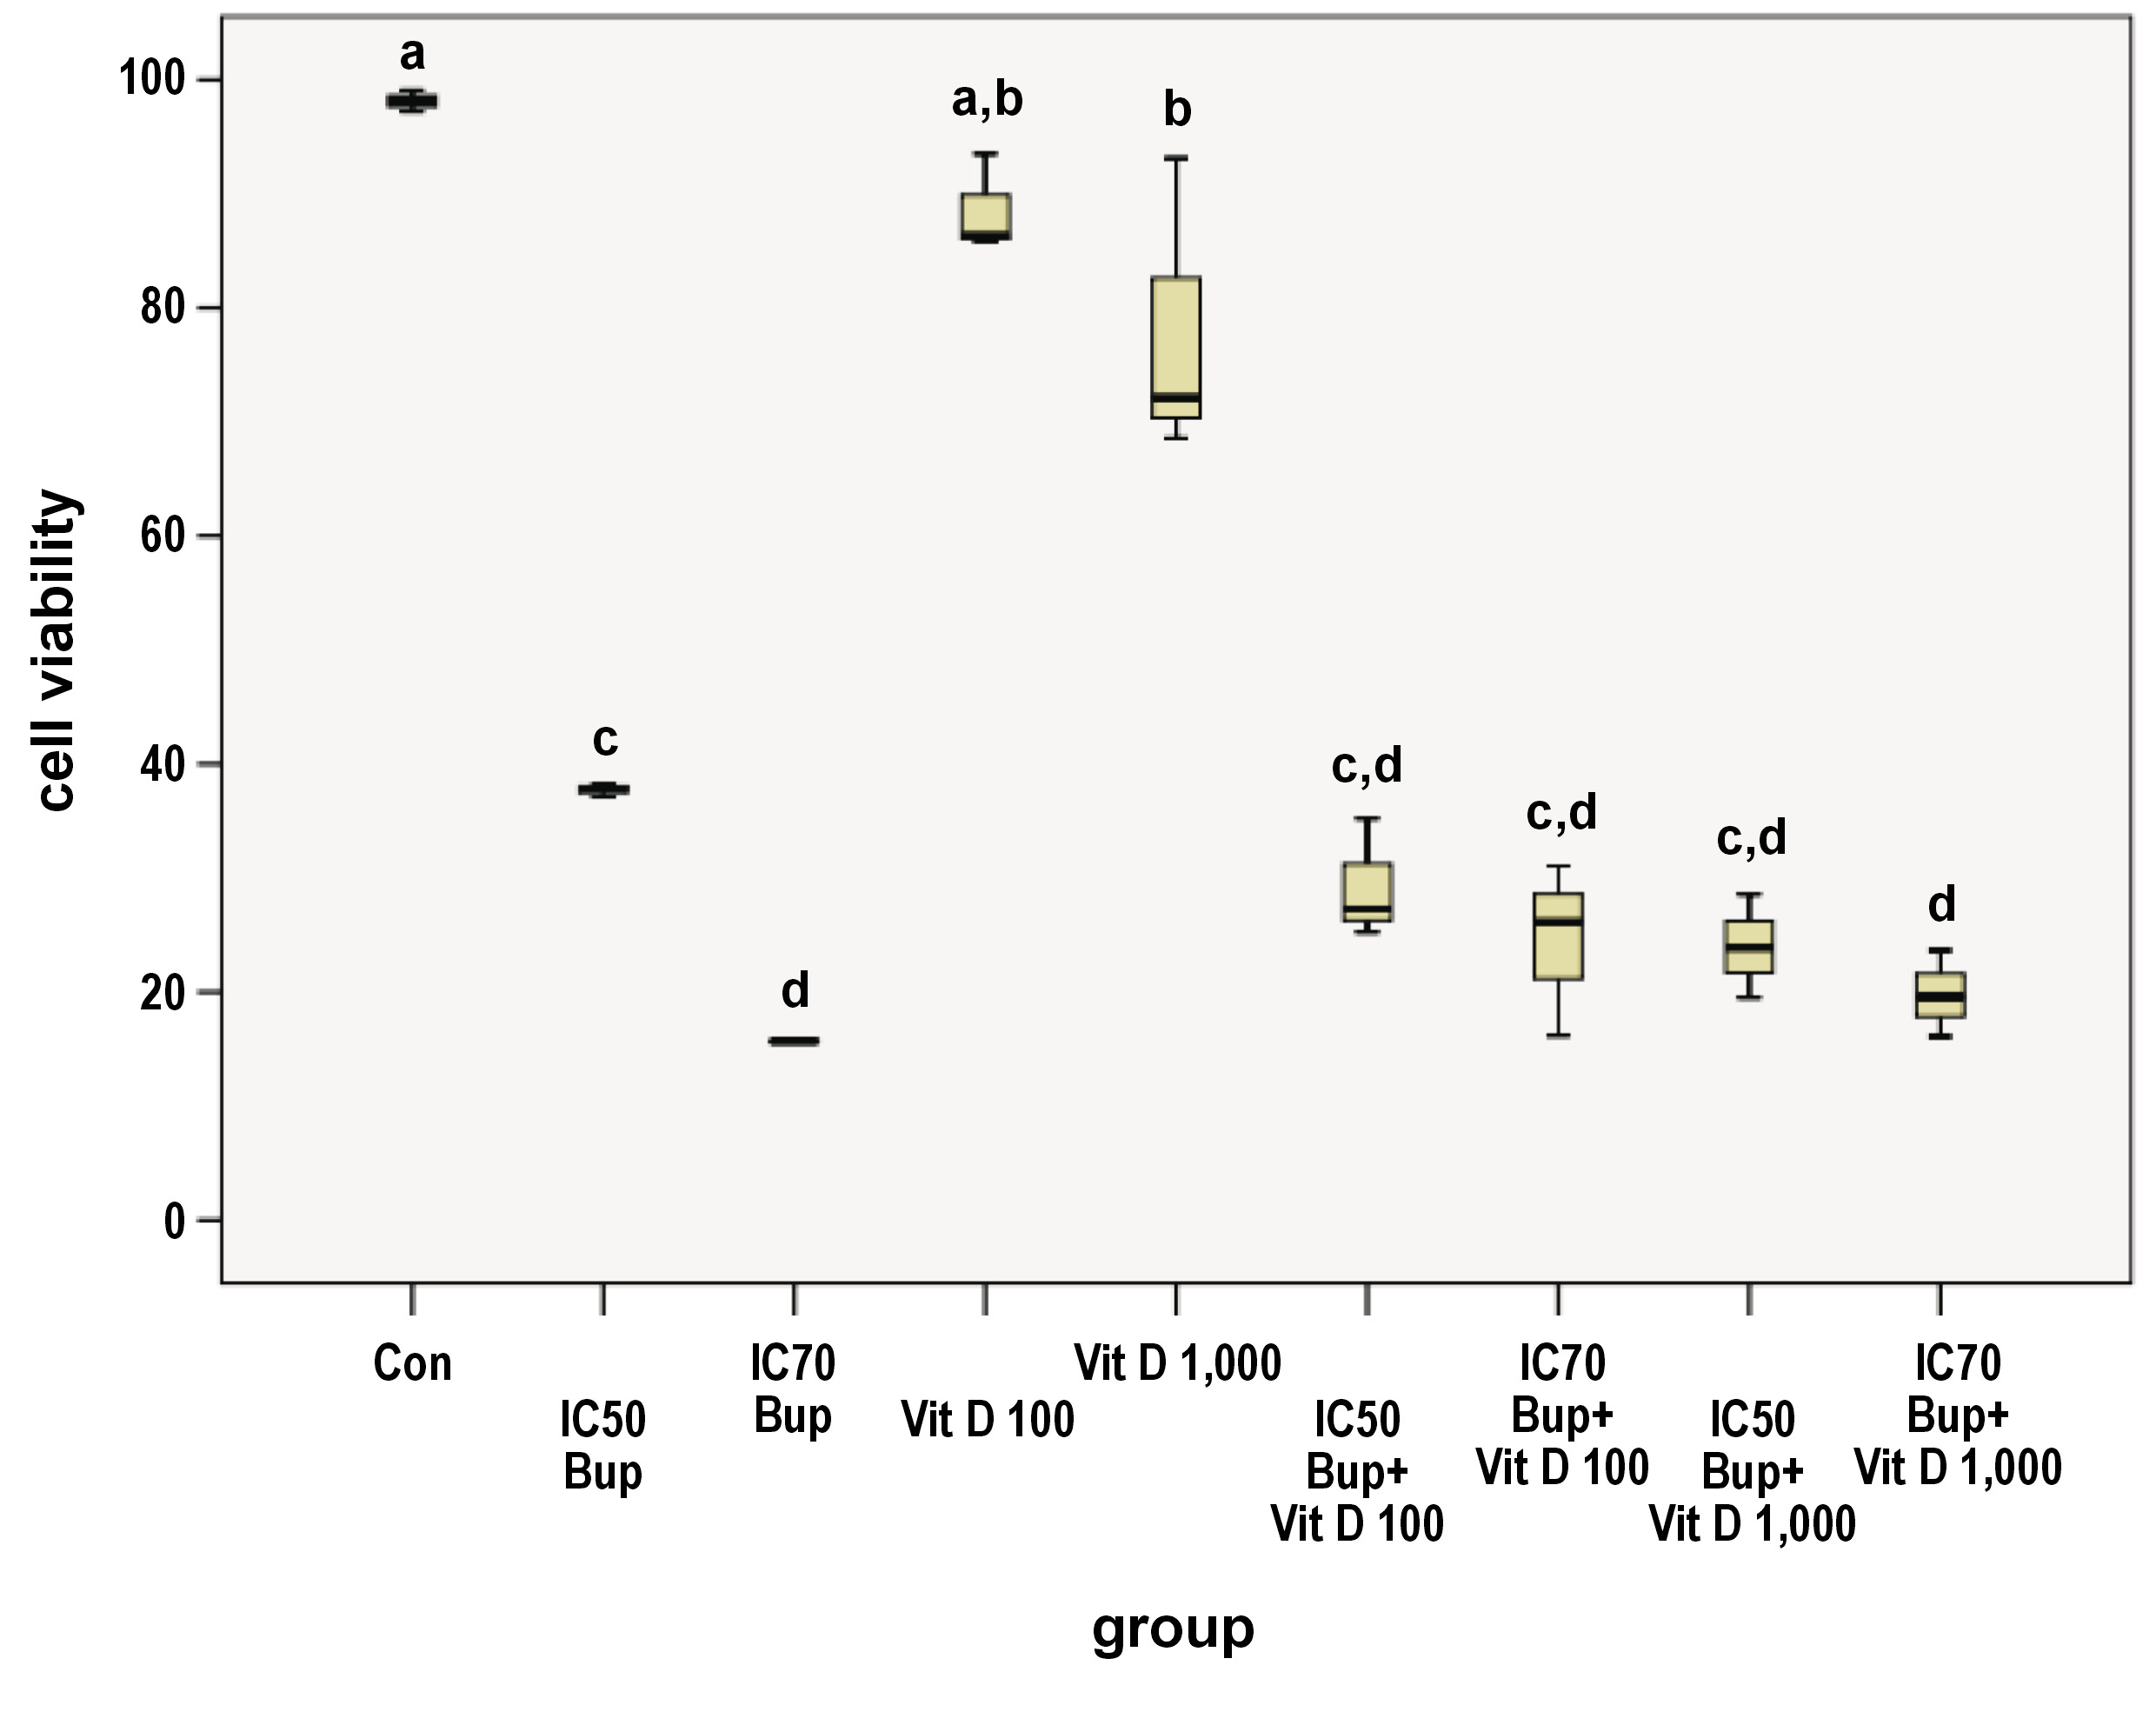
The IC50 dose of buparlisib (B1) was 19.13 µg/mL, and the IC70 dose (B2) was 44.80 µg/mL. After applying 100 nmol Vit D, the IC50 and IC70 doses of buparlisib were decreased respectively to 3.26 µg/mL (C1 – the IC50 co-administration dose of buparlisib with 100 nmol Vit D) and 7.46 µg/mL (C2 – the IC70 co-administration dose of buparlisib with 100 nmol Vit D). In the presence of 1,000 nmol Vit D in the medium, the IC50 and IC70 doses of buparlisib were further reduced to 1.84 µg/mL (C3 – the IC50 co-administration dose of buparlisib with 1,000 nmol Vit D) and 4.27 µg/mL (C4 – the IC70 co-administration dose of buparlisib with 1,000 nmol Vit D), respectively.
The 48-hour treatment of the HNO97 cells lowered the mean cell viability in all the treated groups in comparison with the control group (Con) (Figure 1, Table 1). The viability of the control cells was significantly higher as compared to all treated groups except for the D1 group (p = 0.571). The 2 separate buparlisib doses (B1 and B2) showed a statistically significant difference between each other, with a p-value of 0.006. The cells treated with the IC50 buparlisib (B1) varied significantly from those from the D1 (p = 0.000), D2 (p = 0.000) and C4 (p = 0.033) groups. The B2 group showed a significant difference from Vit D doses D1 and D2 (p = 0.000). Regarding Vit D as a single agent, the D1 and D2 groups did not differ statistically (p = 0.449). However, the D1 and D2 groups differed statistically from the 4 combination groups, with a p-value of 0.000. Meanwhile, the 4 combination groups demonstrated a non-significant difference when compared to each other (Figure 1, Table 1).
Microscopic changes
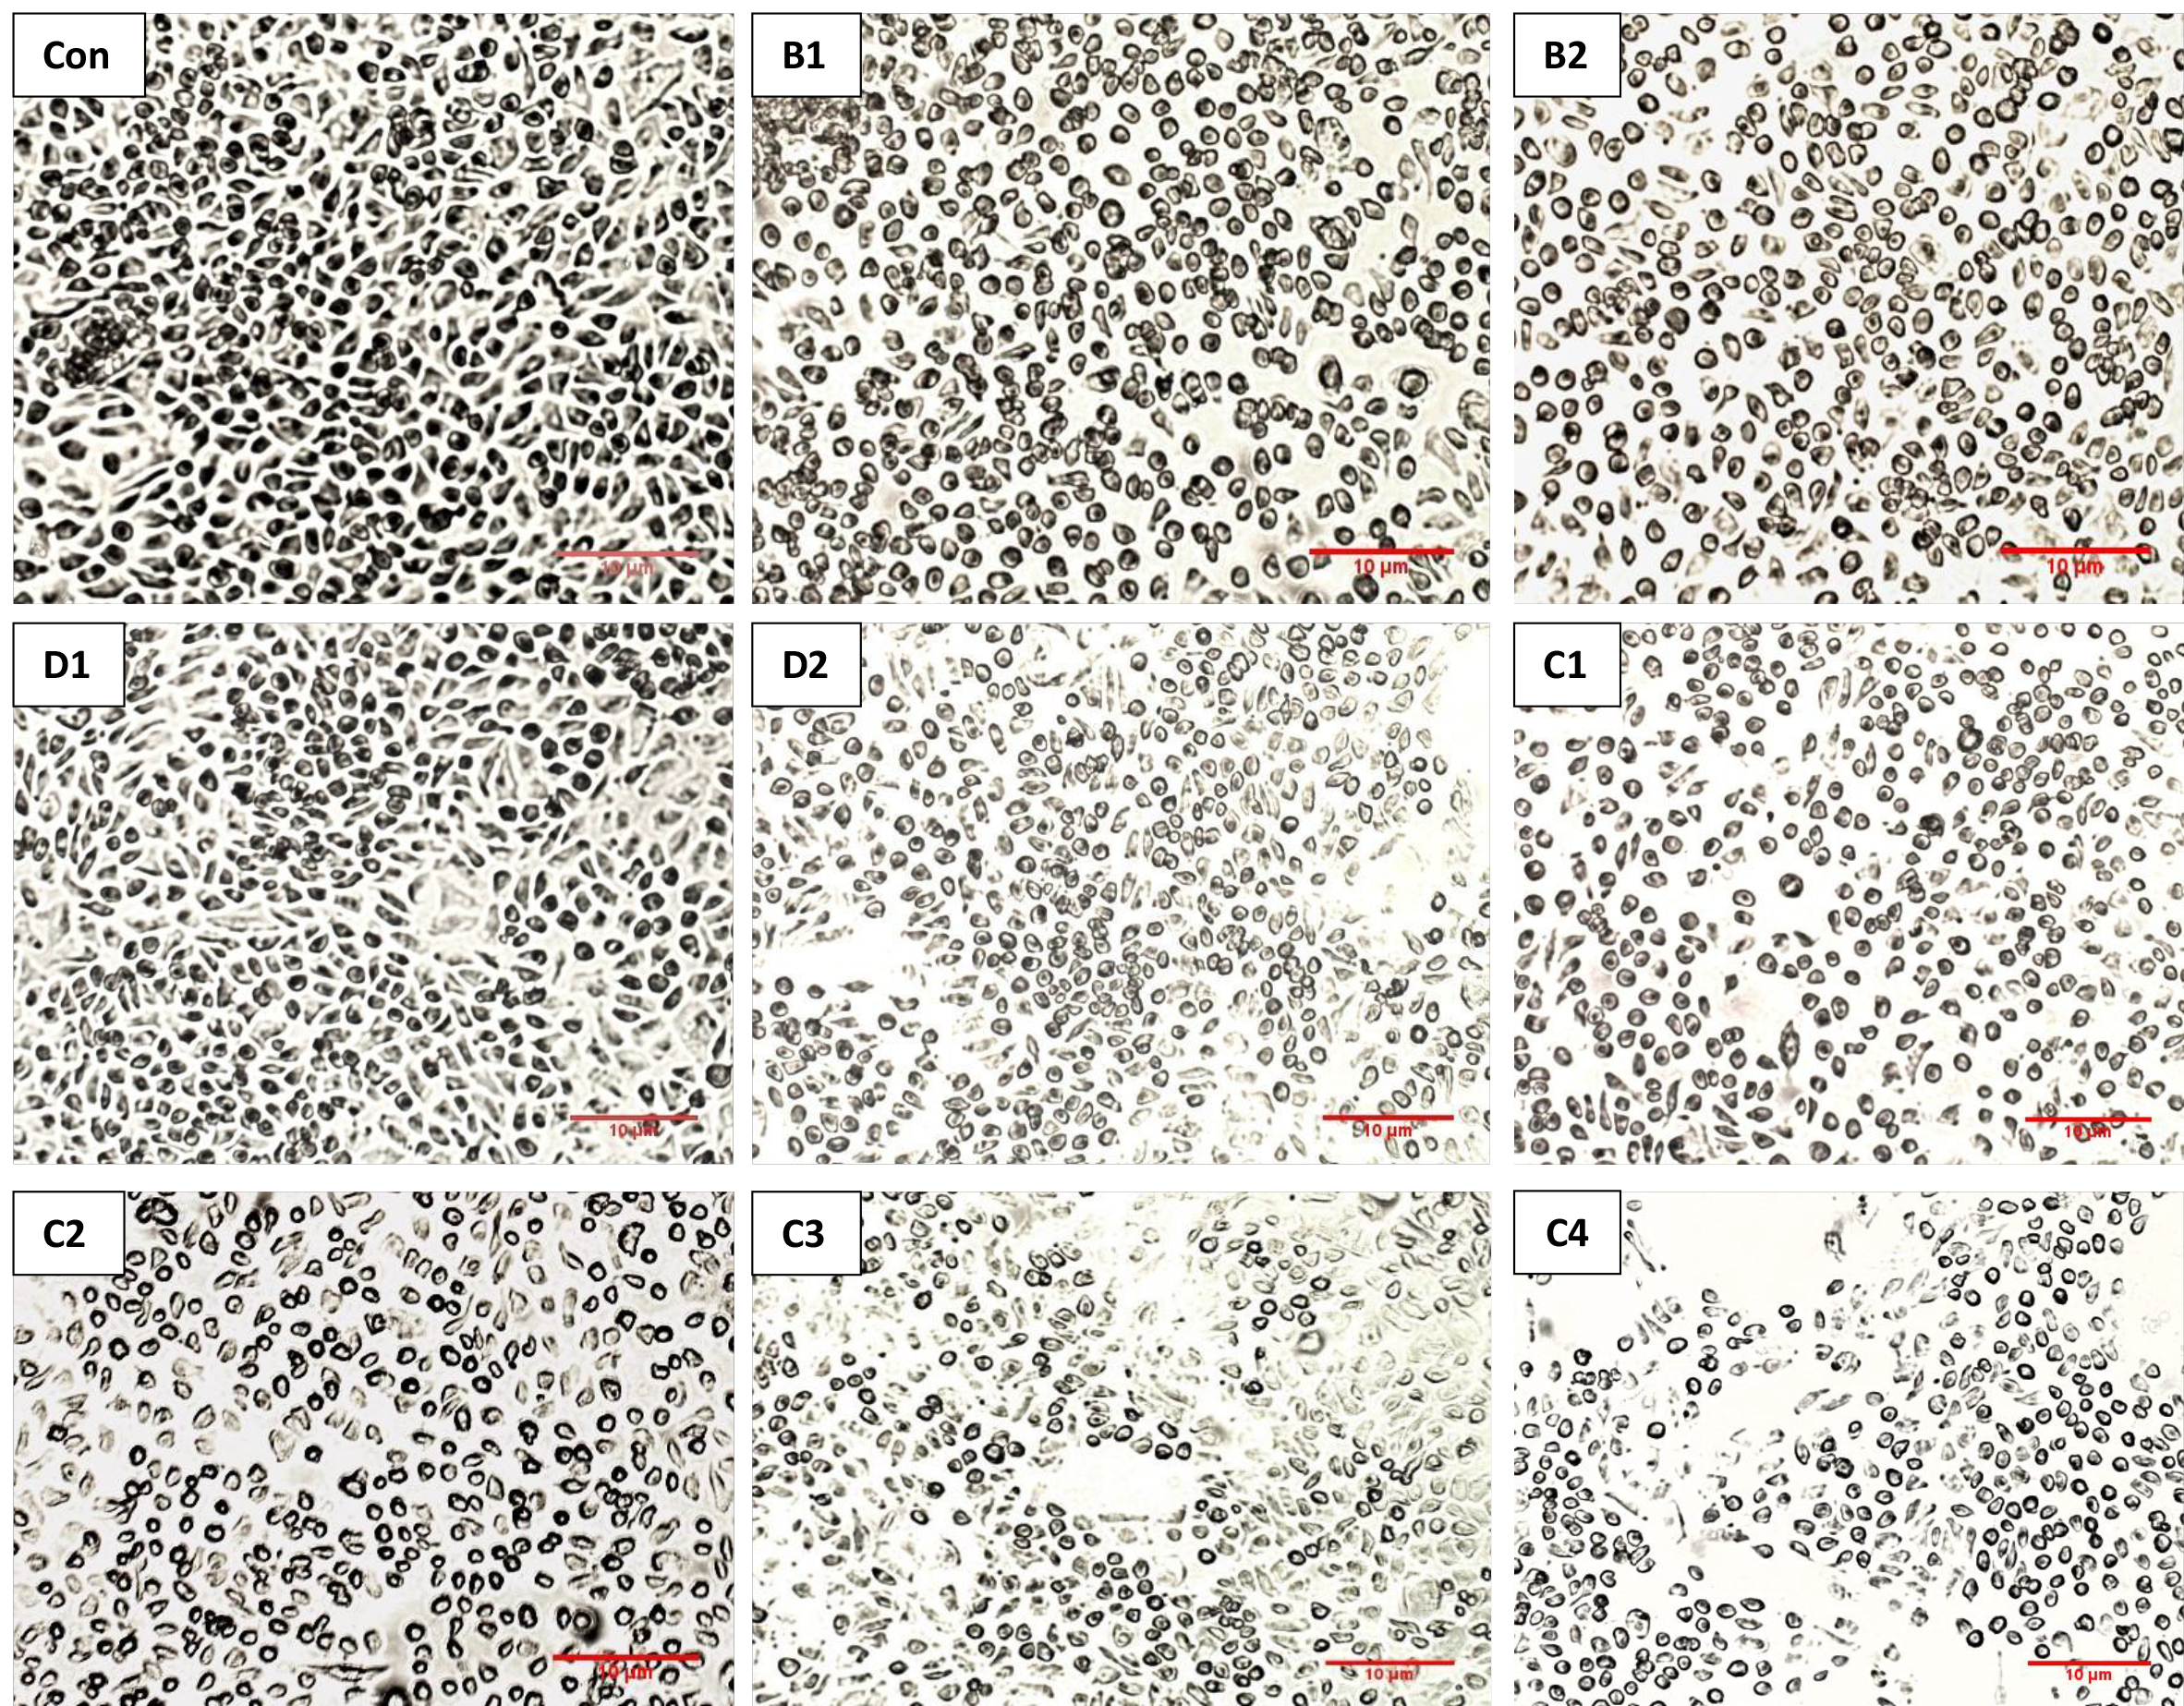
The decrease in the cell viability of the treated groups was consistent with the microscopic images, which displayed reduced cell confluence and morphological changes in response to the applied doses as compared to the control cells (Figure 2). Accordingly, the cells became smaller and rounder, indicating apoptotic changes.
Casp3 gene expression
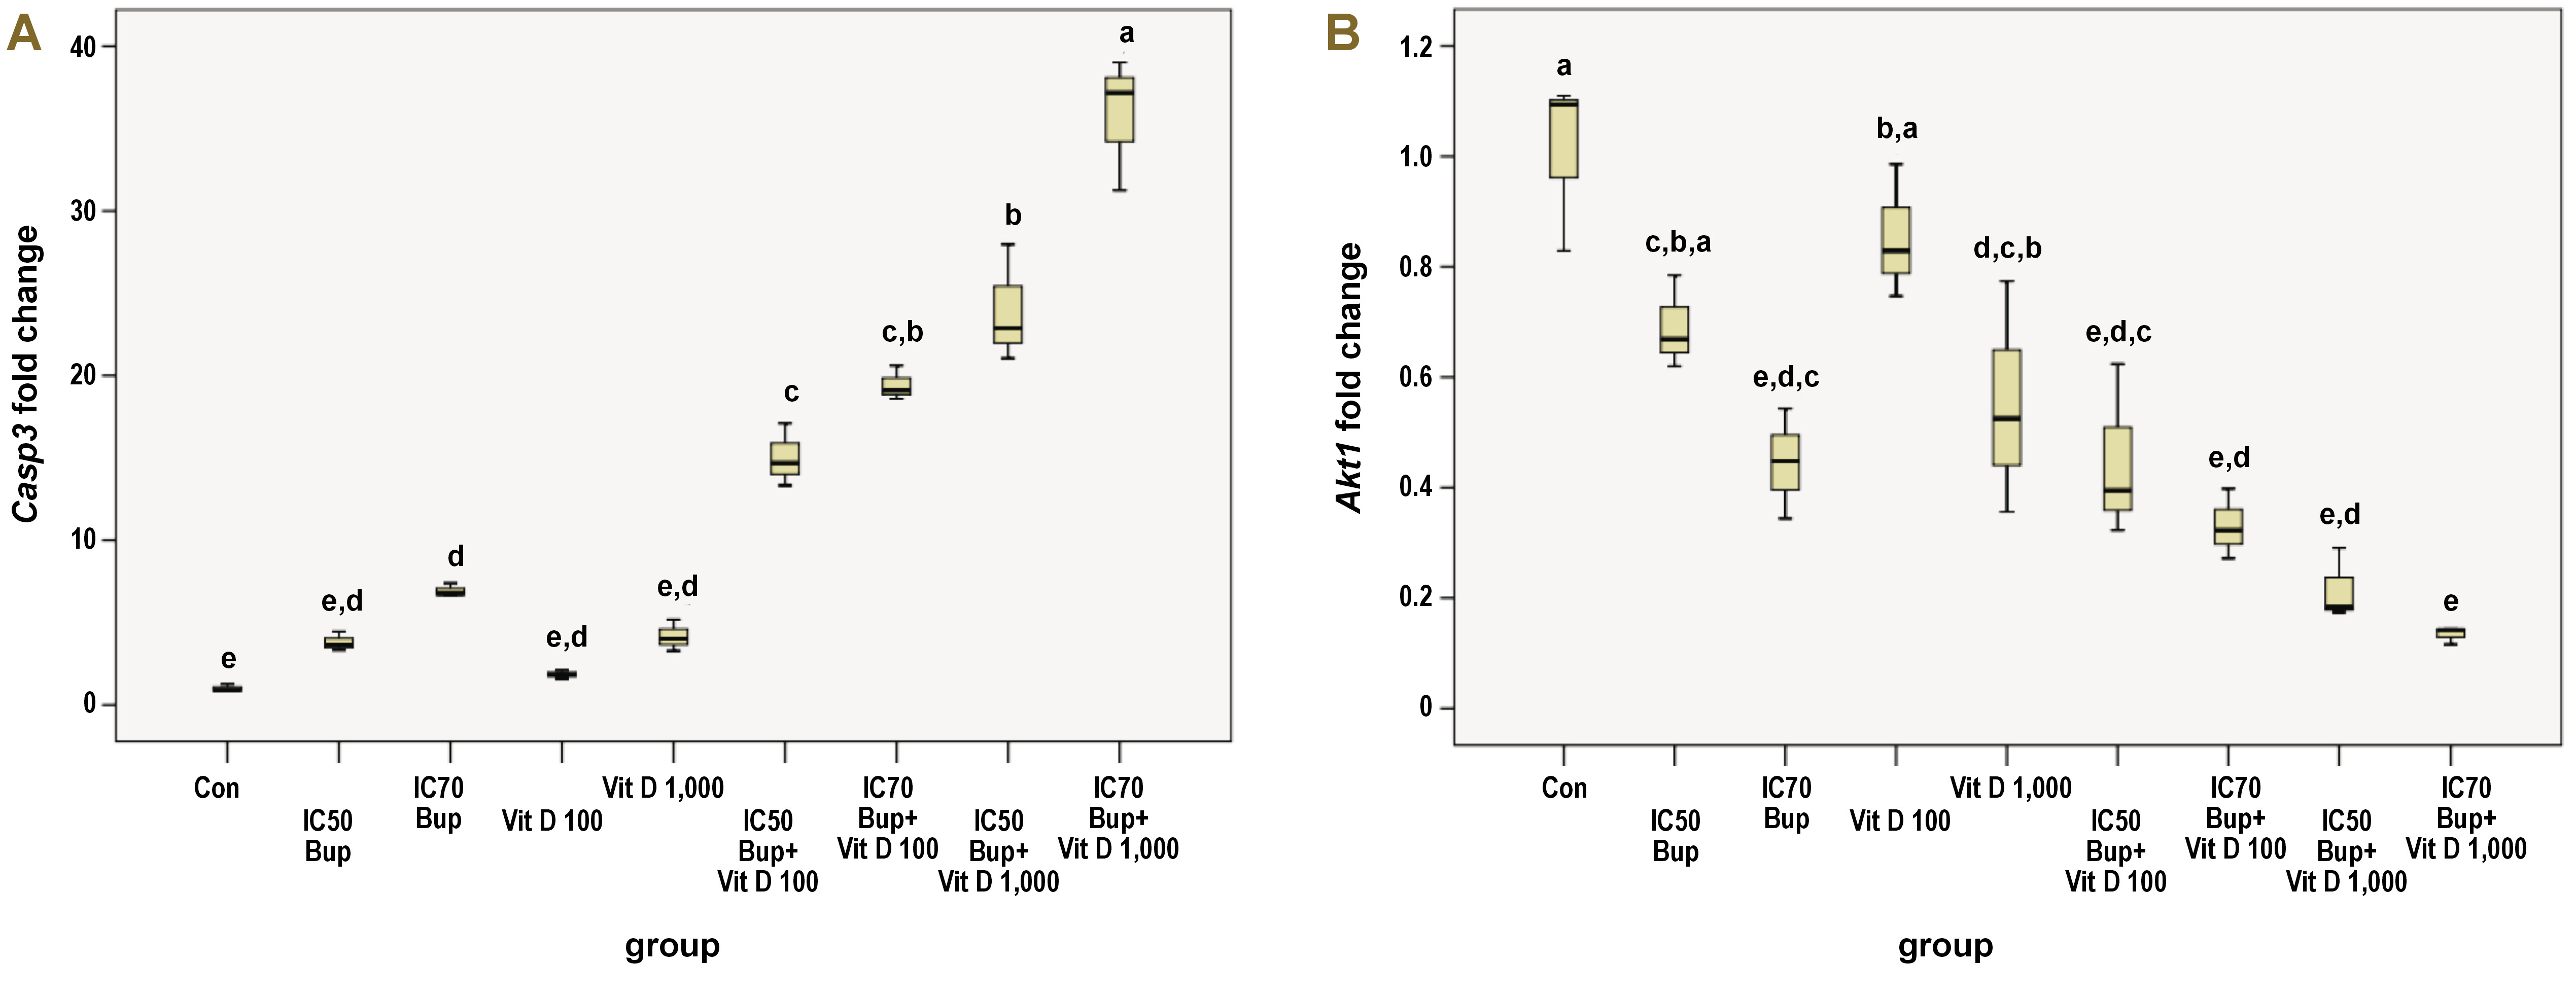
The Casp3 gene expression was positively regulated by treating the HNO97 cells for 48 h in the study groups relative to the control group, as shown in Table 2 and Figure 3A. The gene expression of the control group was statistically different as compared to the B2 (p = 0.039), C1, C2, C3, and C4 groups (p = 0.000). The individual treatment with buparlisib of either dose did not differ statistically from each other or the 2 Vit D doses. However, the B1 group varied significantly from the 4 combination groups (p = 0.000), and the B2 group displayed a similar alteration relative to the C1 (p = 0.002), C2, C3, and C4 groups (p = 0.000).
The Vit D groups (D1 and D2) were significantly different from all the combination groups, with a p-value of 0.000, without displaying a statistical difference between each other. Although adding Vit D to buparlisib improved its up-regulatory effect on the Casp3 gene expression with a significant difference relative to the other treated groups, the combination groups differed statistically from one another in a variable manner. A significant difference was observed when comparing the C1 group to the C3 (p = 0.001) and C4 groups (p = 0.000). The C2 group differed statistically from the C4 group only (p = 0.000). Meanwhile, the C4 group exhibited a significant upregulation with regard to the C3 group (p = 0.000).
Akt1 gene expression
After treating the cells, a down-regulatory effect on the Akt1 gene expression was observed among different study groups in comparison with the control group (Figure 3B). Multiple comparisons between the study groups revealed variable statistically significant results, as displayed in Table 3. The control group varied significantly only from the B2 (p = 0.001), D2 (p = 0.005), C1 (p = 0.001), C2, C3, and C4 groups (p = 0.000). Even though the B1 group differed statistically from the C2 (p = 0.040), C3 (p = 0.004) and C4 (p = 0.001) groups only, the B2 group differed statistically from the D1 group (p = 0.015). The D1 and D2 groups displayed a non-considerable variation relative to each other. The former group was statistically different from C1 (p = 0.016), C2 (p = 0.001), C3, and C4 groups (p = 0.000). Contrastingly, the D2 group was statistically different from the C4 group only (p = 0.013). A non-significant difference was evident among the 4 combination groups.
Discussion
The associated toxicities of buparlisib were inevitable upon its use in different clinical trials.7, 8 Since Vit D is a possible option for ameliorating HNSCC,11 the combined therapy of Vit D with buparlisib could provide a clue to reduce the associated buparlisib toxicities.
To the best of our knowledge, the influence of the single use of buparlisib or Vit D and their co-administration on the HNO97 cell line was not investigated in any prior study. We used the MTT viability assay to determine the effects of different kinds of treatment on the metabolic activity of the HNO97 cells. Since the ideal anticancer therapies include translational approaches that specifically eradicate cancer cells by amplifying or suppressing the relevant genes,13 we used qRT-PCR to monitor the altered gene expression after 48-hour treatment.
Two doses of Vit D were utilized – the optimum dose of 100 nmol, as mentioned in the literature by Cataldi et al.,14 and a higher dose of 1,000 nmol.15 Our findings showed that the dual application of Vit D with buparlisib reduced the initial IC50 and IC70 buparlisib doses, suggesting the capability of Vit D to enhance the effect of buparlisib.
Treating the HNO97 cells for 48 h with buparlisib induced a significant, dose-dependent cytotoxic effect as compared to the control cells. The dose-dependent inhibitory effect of buparlisib was reported previously in different cell lines, such as OSCC, radioresistant OSCC and pancreatic ductal adenocarcinoma (PDAC) cell lines.16, 17 Applying the 2 Vit D doses on the HNO97 cells slightly reduced cell viability, and 1,000 nmol Vit D showed a bit more inhibitory effect than 100 nmol Vit D. In lung cancer cell lines, Vit D mediated a similar reduction, directly related to the elevated doses and durations.18 On the other hand, other studies stated that Vit D lacked an inhibitory effect on cell viability.19, 20
The 2 doses of buparlisib suppressed cell viability superior to the single doses of Vit D, consistently with the higher effect of an AKT inhibitor compared to 100 nmol Vit D in rat glioma cells.21 The 4 combination groups decreased cell viability in the sequential order of the C1, C2, C3, and C4 groups, without any significant differences between the groups. Despite the least cell viability found in the B2 group, it did not vary prominently from any other combination group.
All study groups maintained an up-regulatory effect on the Casp3 gene expression to a variable extent, indicating a pro-apoptotic response corresponding to 48-hour treatment. Some studies agree with our findings. Zhao et al. found that buparlisib generated elevated protein levels of CASP3 and poly(ADP-ribose) polymerase (PARP), and high numbers of apoptotic cells with the Caspase-3/7 reagent in fluorescent images.22 Pereira et al. clarified that buparlisib promoted intrinsic and extrinsic apoptotic pathways by elevating the BAX, BCL2 and FAS levels, and activating procaspase-3, 8 and 9 in acute lymphoblastic leukemia (ALL) cell lines.23 Contrarily, other studies denied the pro-apoptotic effect of buparlisib.24, 25 Oliveira et al. reported that buparlisib reduced cell viability by increasing the P27 levels and arresting the cell cycle at the G0–G1 phase.25 In HNSCC cell lines, buparlisib failed to induce apoptosis separately, unlike its combination with erlotinib, which banned the translation of BCL2 through the eukaryotic translation initiation factor 4E-binding protein 1 (4E-BP1) axis, leading to apoptosis through the mTOR pathway.24
Vitamin D 1,000 nmol increased the CASP3 levels significantly more than 100 nmol. The increased Casp3 gene expression caused by calcitriol was validated by the increase of the cleaved CASP3 and other pro-apoptotic proteins, beside lowering the level of the anti-apoptotic BCL2 protein in kidney cancer cells.26 Vitamin D was also reported to increase the activity of CASP3 in non-small cell lung cancer (NSCLC) cell lines18 and melanoma cell lines.27 Opposingly, Kucukhuseyin et al. showed that calcitriol, depending on the caspase pathway, mediates anti-apoptotic rather than pro-apoptotic effects.21
Despite the higher Casp3 gene expression of B2 as compared to B1, D1 and D2, the groups did not vary significantly. Similar to our outcome, 24-hour Vit D treatment revealed a comparable apoptotic effect to AKT inhibitor XI,27 and a similar apoptotic effect to PI3K, AKT and mTOR inhibitors individually.18
Vitamin D and buparlisib cooperatively accentuated their pro-apoptotic activity by increasing the Casp3 gene expression among the 4 combination groups. This synergistic effect was significantly higher than in the other treated groups. In agreement with this result, Vit D combined with an AKT inhibitor efficiently raised the Casp3 gene expression, to a greater extent than either agent alone.27 Another study clarified that the synergistic effect of Vit D combined with an AKT inhibitor consisted in cell cycle arrest rather than apoptosis, as observed by high levels of the cyclin-dependent kinase inhibitor p21.28
Buparlisib treatment abolished the PI3K pathway dose-dependently by downregulating the Akt1 gene expression. The reduced Akt gene expression was elaborated previously in HNSCC cell lines at the protein level.29, 30 A similar effect was also obtained in different cell line types.25, 31
In our study, calcitriol mediated an inhibitory effect on the PI3K pathway by lowering the Akt1 gene expression. The Akt1 gene expression was reduced more by increasing the applied dose. Lee and Park clarified that silencing forkhead box O3 (FOXO3) suppressed the expression of BCL2-interacting mediator of cell death (BIM) and the degradation of PARP1 prominently.26 Therefore, Vit D plays a crucial role in stimulating apoptosis by hindering AKT phosphorylation, leading to the subsequent activation of FOXO3.
Additionally, the Vit D treatment of melanoma cell lines decreased p-AKT and p-mTORC1 (mTORC1 – mechanistic target of rapamycin complex 1) by triggering phosphatase and tensin homolog deleted on chromosome 10 (PTEN).27 A considerable increase in the PTEN expression, and the inhibition of the PI3K, AKT1 and mTOR genes and proteins resulted from applying Vit D solely on colon cancer cell lines.19
The co-administration of buparlisib and Vit D synergistically influenced the Akt1 gene expression, which was lower than with the use of either agent separately. A similar synergistic effect was shown by a decreased p-AKT level when combining Vit D with an AKT inhibitor in prostate cancer cells, regardless of the functional status of PTEN.28 Shariev et al. also obtained a synergistic effect upon combining Vit D with another AKT inhibitor.27
The dual use of calcitriol with PI3K, AKT or mTOR inhibitors declined the levels of phosphorylated PI3K, AKT and mTOR proteins more than the single use of any of the inhibitors.18 This finding implies that the co-administration of Vit D with the inhibitors efficiently hinders the pathway at several points. Also, combining Vit D with cisplatin enhanced its anticancer effects by significantly lowering p-AKT and p-mTOR to levels not reached by cisplatin alone.20 Based on these findings, the authors recommended that future research investigate the potential benefits of combining vitamin D with AKT and mTOR inhibitors.20
On the other hand, the combined therapy with calcitriol and an AKT inhibitor lowered the expression of the PI3K and mTOR genes to levels comparable to those obtained with the inhibitor alone in rat glioma cells.21
The current study showed that the co-administration of Vit D with buparlisib had a synergistic effect, which could be explored in future studies for determining other mechanisms and examining their effects on resistant TSCC cell lines.
Limitations
In our study, the experiment was conducted on a single cell line, with one treatment duration. We assessed the apoptotic effect by monitoring the Casp3 gene expression without quantifying the induced apoptosis in the study groups, e.g. through using immunofluorescence staining for CASP3. Also, we did not examine the apoptotic effect on the level of CASP3 or other apoptotic proteins, such as BAX and BCL2. We recommend that future studies take these factors into account to better generalize the synergistic effects of buparlisib and vitamin D on cancer cell lines. Furthermore, it would be valuable to correlate the PCR-detected downregulation of AKT with the markers of the cell cycle.
Conclusions
The co-administration of Vit D with buparlisib significantly reduced the effective dose of buparlisib through a synergistic interaction, enhanced apoptosis and inhibited the PI3K/AKT/mTOR pathway. These findings suggest that Vit D may serve as an effective adjuvant to buparlisib, enabling lower therapeutic doses while maintaining strong antineoplastic efficacy and minimizing potential toxicities in cancer treatment.
Ethics approval and consent to participate
This study received an exemption from review by the Scientific Research Ethics Committee of Ain Shams University, Cairo, Egypt (No. of approval: FDASU-Rec EM112102).
Data availability
The datasets supporting the findings of the current study are available from the corresponding author on reasonable request.
Consent for publication
Not applicable.
Use of AI and AI-assisted technologies
Not applicable.