Abstract
Background. Periodontal diagnosis and risk assessment are extremely important to assess the individual likelihood of developing periodontal disease or experiencing its progression.
Objectives. The goal was to introduce and validate a new algorithm through providing the periodontal/peri-implant diagnosis (comparing the one by the professionals vs. the automated tool), risk assessment and prognosis, and to establish cut-off limits with a new scoring system.
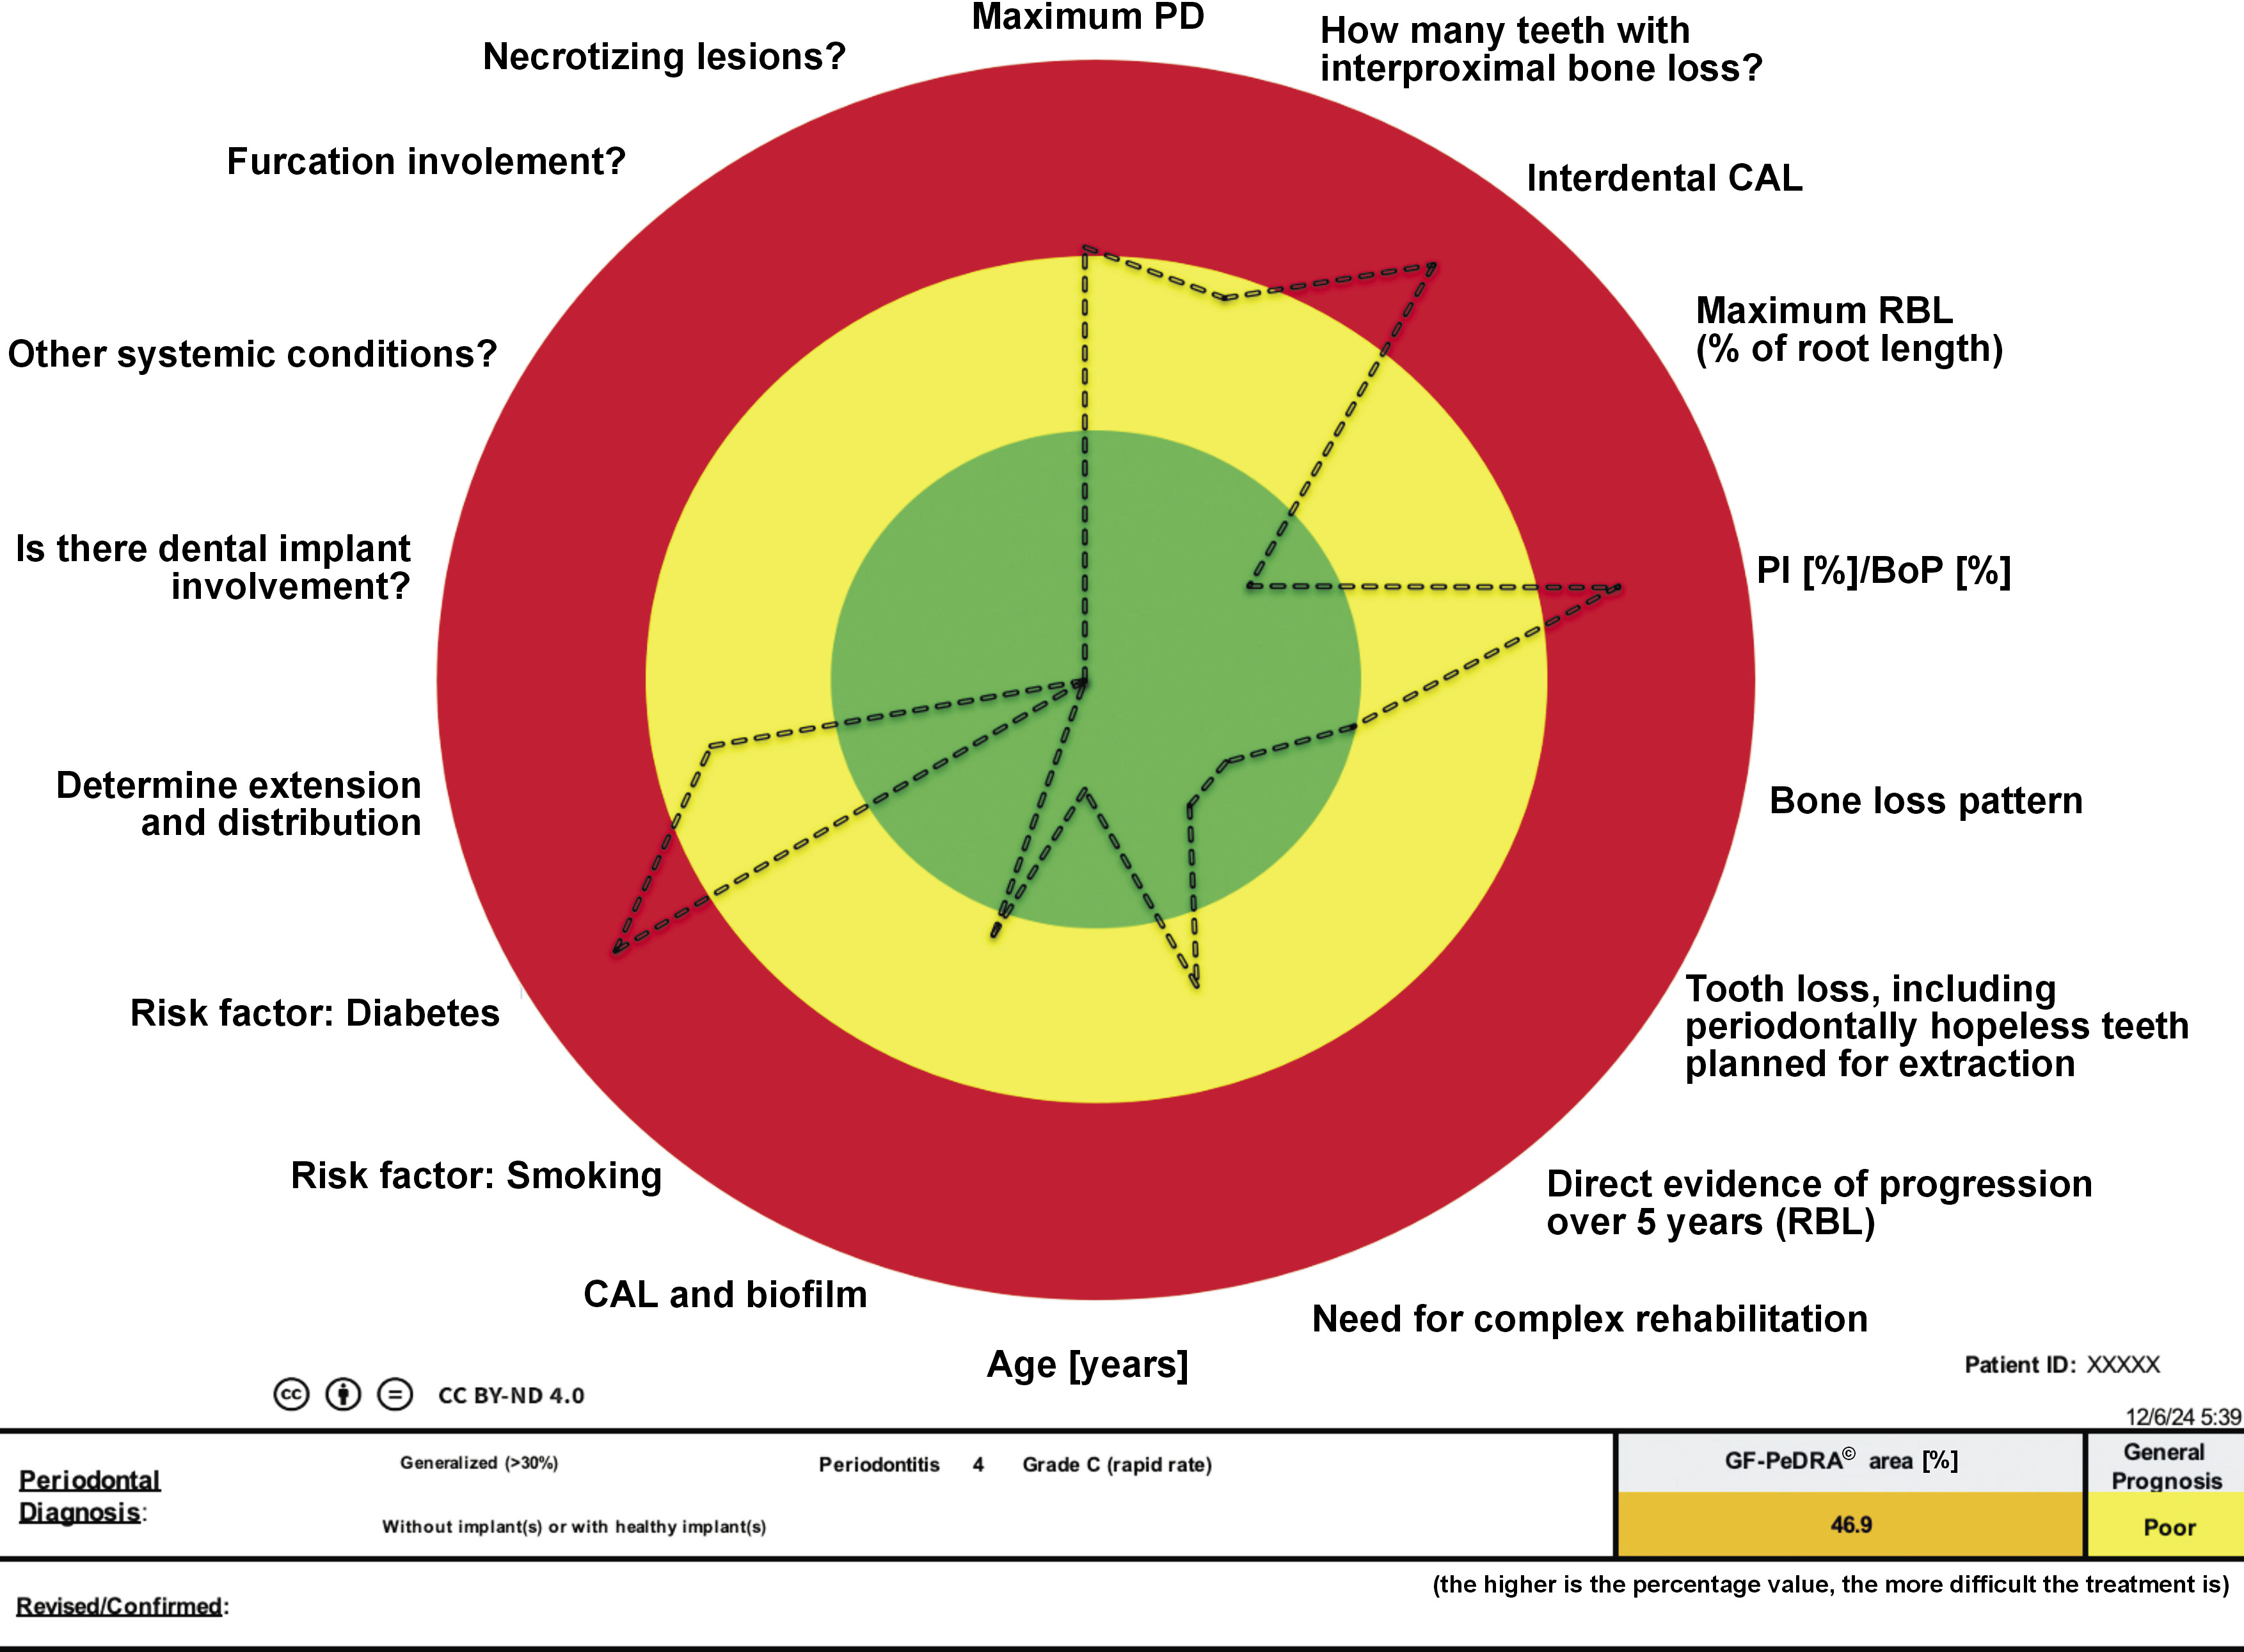
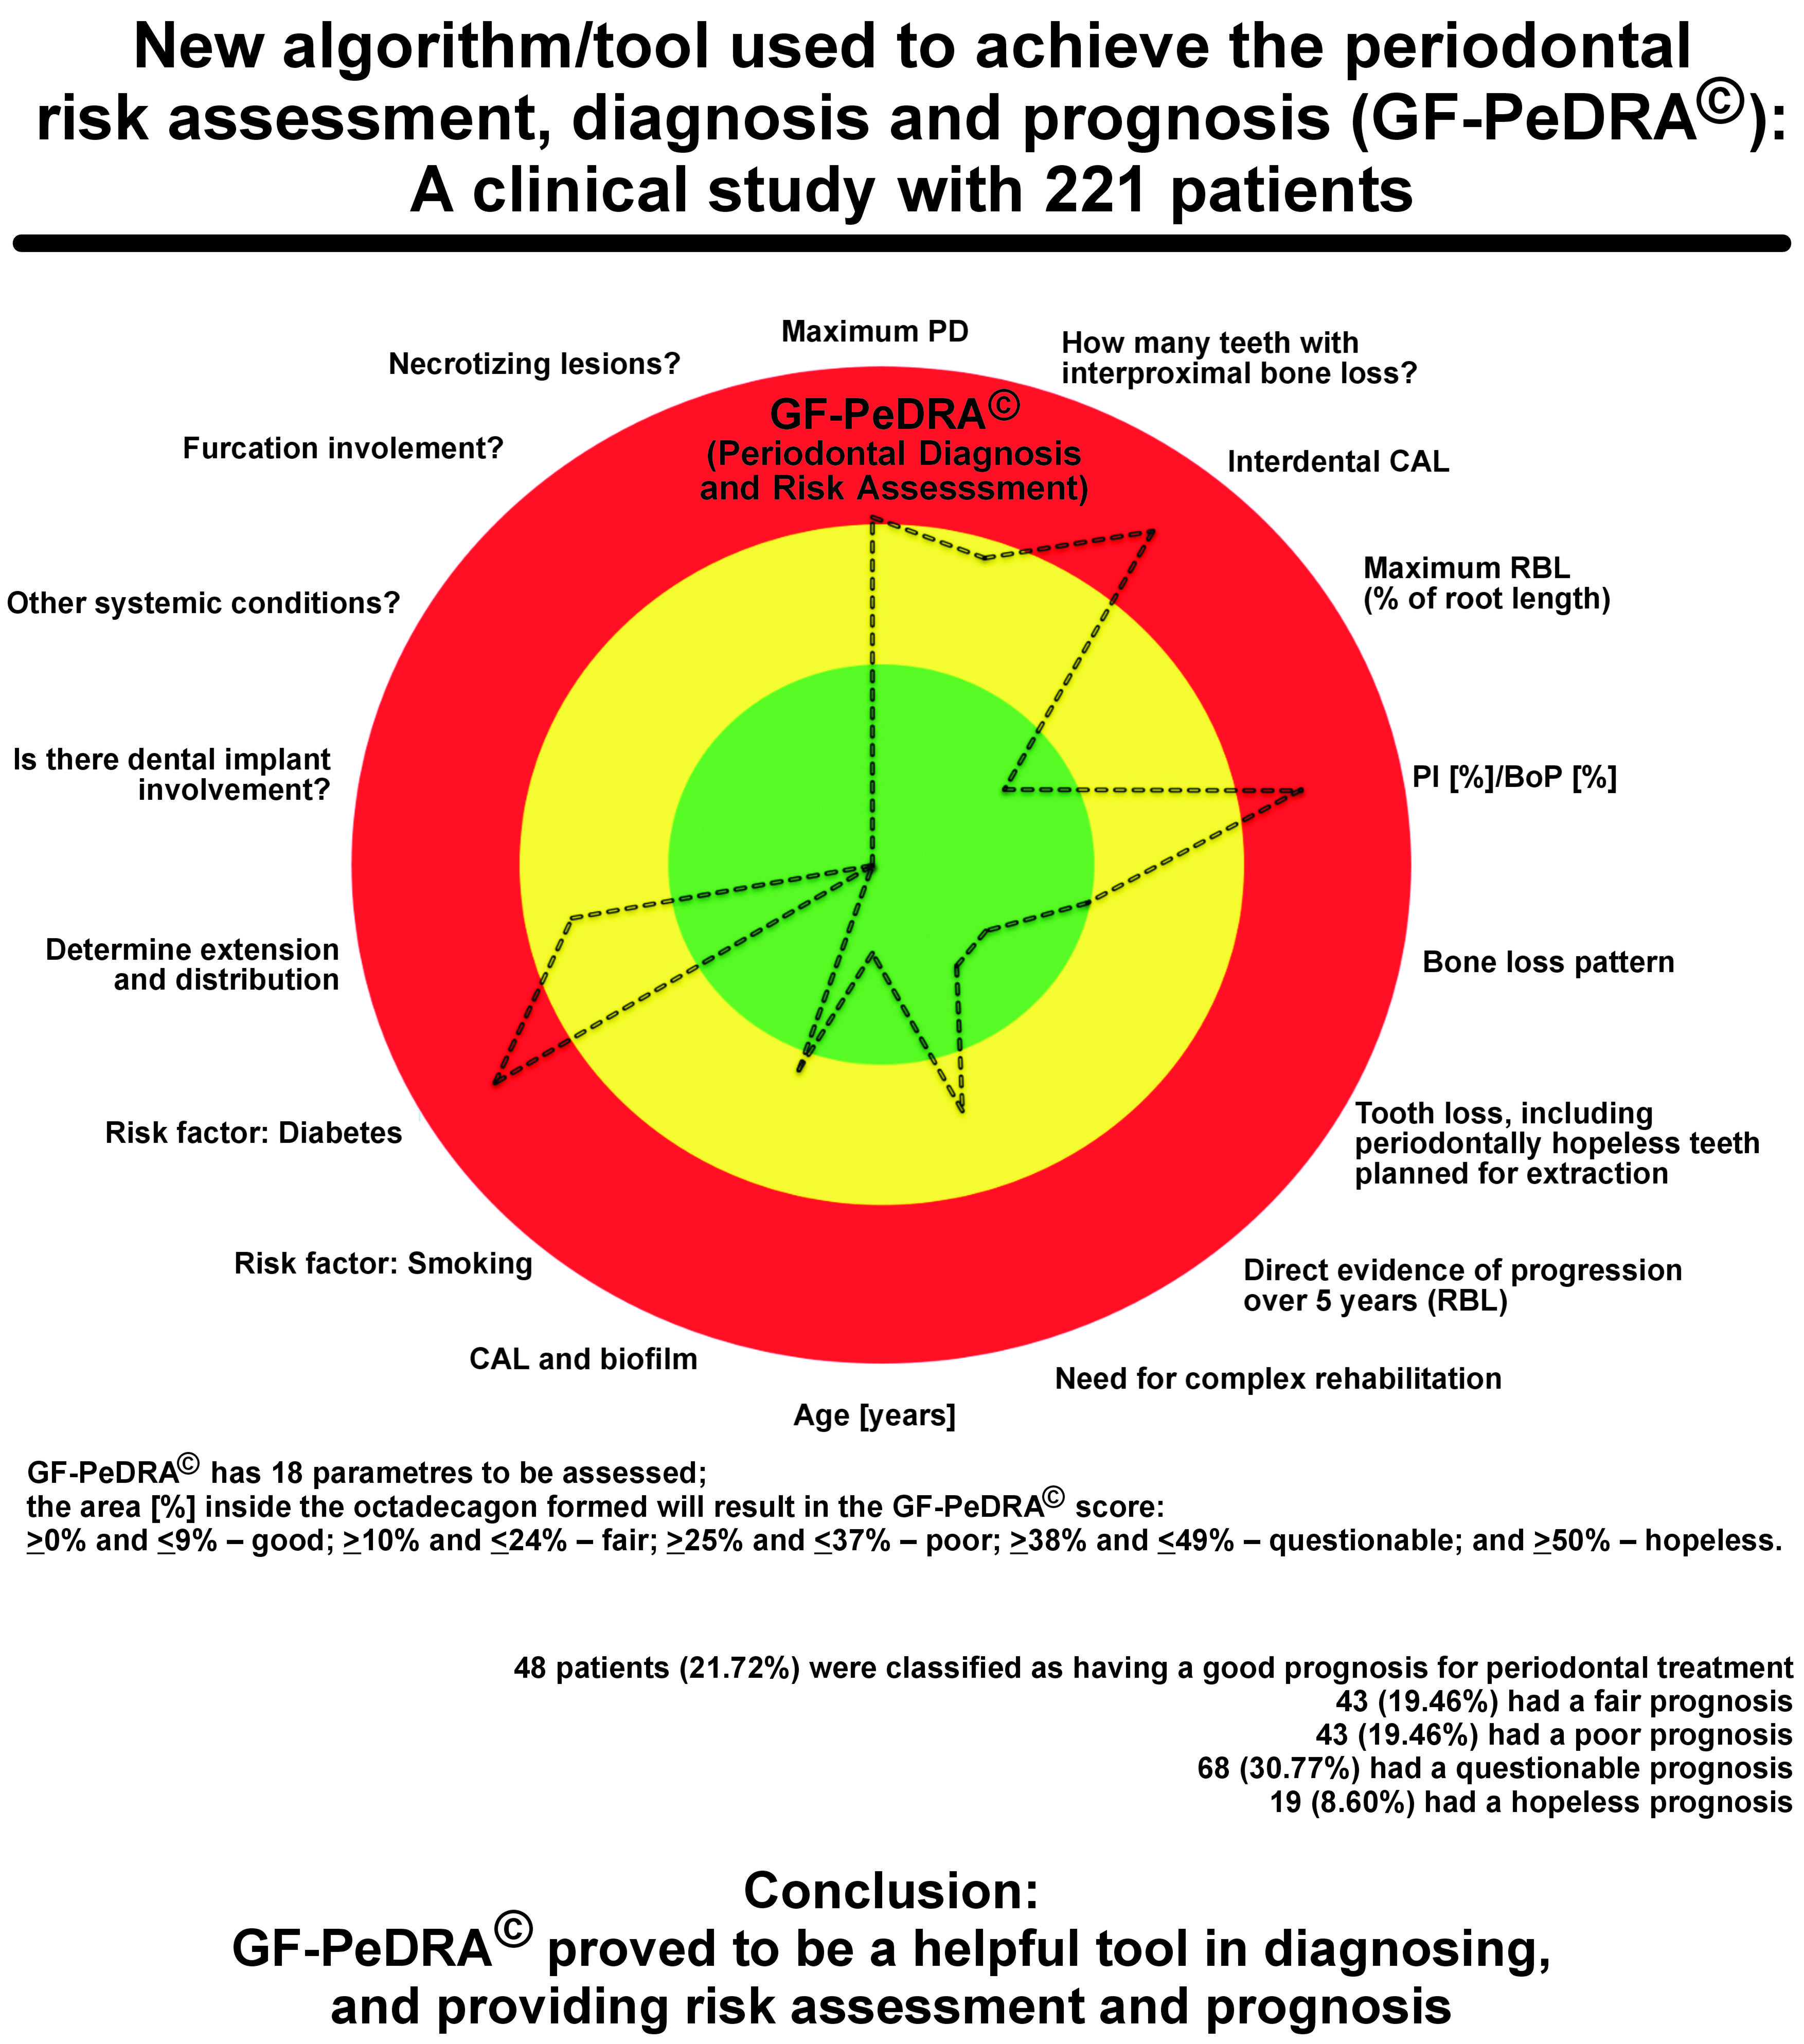
Material and methods. GF-PeDRA© has 18 parameters to be assessed, achieving an octadecagon picture. The parameters are as follows: the probing depth (PD); the number of interproximal sites with bone loss; clinical attachment loss (CAL); radiographic bone loss (RBL); bleeding on probing (BoP); the bone loss pattern; tooth loss; the evidence of progression; the need for complex rehabilitation; the patient’s age; biofilm accumulation; smoking; diabetes; extension and distribution; peri-implant disease; other systemic conditions; furcation involvement; and necrotizing lesions. The new scoring system, GF-PeDRA©, is based on the percentage of the octadecagon area obtained: for areas ≥0% and ≤9%, the prognosis is good; ≥10% and ≤24%, fair; ≥25% and ≤37%, poor; ≥38% and ≤49%, questionable; and ≥50%, hopeless.
Results. A total of 221 patients were included, with 34 (15.38%) smokers and 28 (12.67%) diabetics. The evaluators individually achieved the diagnosis (κ = 0.83); therefore, 37 out of 221 cases were revised, and the final clinical diagnosis was established. Afterward, all information was inserted into GF-PeDRA© to obtain an automated diagnosis. Comparing them (the professionals vs. GF-PeDRA©), the total agreement level was achieved (κ = 1.0). The average GF-PeDRA© score was 28.64%, with a median (Me) of 32.2%. Forty-eight (21.72%) patients were classified as having a good prognosis for periodontal treatment, 43 (19.46%) had a fair prognosis, 43 (19.46%) had a poor prognosis, 68 (30.77%) had a questionable prognosis, and 19 (8.60%) had a hopeless prognosis.
Conclusions. GF-PeDRA© proved to be a helpful tool in diagnosing, and providing risk assessment and prognosis. New clinical studies must be conducted to validate the presented GF-PeDRA© scoring system.
Keywords: diagnosis, prognosis, risk assessment, algorithm, periodontics
Introduction
The new classification system for periodontal and peri-implant diseases and conditions was introduced in 2018, following an international workshop’s deliberations and consensus reports.1 It is the most evidence-based and clinically relevant system ever proposed. It is considered the first major update to the classification since 1999.2 Since then, educational institutions and dentists have been utilizing this new classification, following the stipulated principles. It comprises the reclassification of disease modalities into novel schemes, including staging and grading for periodontitis, indicating the severity and extent of the disease, and considering the patient’s overall health status.3 As with all new system implementations, a learning curve is inevitably necessary through the experiences and correct interpretations of the guidelines.
Predictive, preventive, personalized, and participatory periodontology (‘5Ps’)4 represents the future of periodontics. A predictive approach using high-tech tools for diagnosis permits a better detection of patients at risk and the early diagnosis of periodontitis/peri-implantitis, when it is easier to treat it successfully. It is organized as personalized prevention based on a single patient’s genetic and microbiological status,5, 6 and customized therapy tailored to the medical reality of the specific patient. Finally, the patient’s active role can be emphasized through participatory collaboration.
Risk assessment for periodontal/peri-implant treatment has become essential in determining predictability. Periodontal risk assessment is a systematic approach to evaluating the individual likelihood of developing periodontal disease or experiencing its progression. This process is essential for identifying at-risk individuals and implementing preventive or therapeutic interventions tailored to their needs. Several periodontal risk assessment tools have already been developed and validated.7, 8 A systematic review from 2015 addressed 5 risk assessment tools.8 The most often used and widely accepted one is the periodontal risk assessment (PRA) tool.9 It is considered as a valid system, enabling the identification of patients at high risk for periodontal re-infection and progression after treatment with the use of only 6 criteria.9
However, facing all advances in the periodontal/peri-implant classification, employing only several parameters or analyzing only some factors to predict a periodontal risk can be insufficient to reflect a “total” reality about the patient’s periodontal/peri-implant condition. Without considering other parameters, such as non-chronic or necrotizing forms of periodontitis, additional complex clinical information that is often difficult to obtain, or other potential risk factors (e.g., environmental exposure and genetic predispositions), the assessment of the patient’s condition may be incomplete. Addressing these requirements is essential for developing an unbiased prognostic system.
Therefore, the goal of the present study was to introduce and validate a new algorithm/tool through providing (1) the periodontal/peri-implant diagnosis (comparing the professional (specialist) one vs. the automated tool), (2) risk assessment and prognosis, as well as (3) to establish cut-off limits for a clinically significant disease with a new scoring system (GF – Periodontal Diagnosis and Risk Assessment (GF-PeDRA©)). To our knowledge, this is the first automated tool described in the literature for periodontal and peri-implant diagnosis and risk assessment, integrating 18 parameters into a dynamic spider chart that automatically updates, thereby enhancing clinical interpretation, education, and monitoring of disease progression and risk factors.
Material and methods
The study was approved by the local research ethics committee at A.T. Still University, St. Louis, USA (No. of approval: ATSU – IRB GF20240929-001), and was conducted in compliance with Good Clinical Practice, the Declaration of Helsinki and the Strengthening the Reporting of Observational Studies in Epidemiology (STROBE) guidelines.10 Prior to the commencement of the study, all patients signed the informed consent to participate, permitting their inclusion. The recruitment period and study duration ranged from April 2022 to July 2023. All participants were evaluated by an expert/specialist in periodontics (G.V.O.F., over 16 years of experience) and individually revised by a general dentist (J.C.H.F., over 14 years of clinical experience); in case of any divergence, the case was revisited and discussed until clarification and definition were achieved. The validation sample comprised 221 patients.
Eligibility criteria
The included patients were ≥18 years old, and were periodontally evaluated in the university clinic during the period of recruitment and assessment, without any restrictions for a systemic condition or language. Patients who did not wish to participate in the study and refused to sign the informed consent were excluded.
GF-PeDRA© – presentation and variables
In line with the multifactorial nature of periodontal and peri-implant diseases, no single factor can be solely responsible for their development. A literature-based analysis identified 18 systemic and local predictors with suggested options, which were subsequently incorporated into this tool, producing an octadecagon (an eighteen-sided polygon) representation(Figure 1):
1. Highest probing depth (PD) value – A. 0–3 mm; B. 4 mm; C. 5 mm; D. 6 mm; and E. >6 mm;
2. Number of interproximal sites with bone loss – A. 0; B. 1; C. 2; D. >2 and <8; E. ≥8 and <12; and F. ≥12;
3. Highest clinical attachment loss (CAL) value – A. 0; B. 1–2 mm; C. 3–4 mm; and D. >4 mm;
4. Maximum radiographic bone loss (RBL), represented by the percentage (%) of bone loss (it was calculated following the original recommendations of the classification system) – A. 0%; B. 5%; C. 10%; D. 12%; E. 14%; F. 15%; G. 21%; H. 28%; I. 34%; J. 40%; K. 46%; L. 51%; M. 56%; N. 61%; O. 66%; P. 71%; Q. 76%; R. 81%; S. 86%; T. 91%; and U. 100%;
5. Percentage of sites with bleeding on probing (BoP) – A. 0–3%; B. 4–7%; C. 8–9%; D. ≥10% and ≤30%; and E. >30% up to 100%;
6. Bone loss pattern (observe the overall pattern in the arches) – A. none; B. horizontal bone loss; and C. vertical bone loss;
7. Tooth loss, including periodontally hopeless teeth planned for extraction – A. none; B. none due to periodontitis; C. loss of up to 4 teeth due to periodontitis; and D. loss of 5 or more teeth due to periodontitis;
8. Evidence of progression over 5 years (progression must be observed by comparing the sites in the initial and periodontal charts after 5 years) – A. no loss; B. <2 mm; C. 2 mm; and D. >2 mm;
9. Need for complex rehabilitation – A. no need; B. <20 remaining teeth; C. masticatory dysfunction; D. bite collapse, drifting or flaring; and E. secondary occlusal trauma (mobility >II);
10. Patient’s age, varying from 13 to 120 years;
11. CAL and biofilm accumulation – A. no CAL and no/low level of biofilm; B. lower CAL despite heavy biofilm deposits; C. CAL proportionate to the biofilm level; and D. higher CAL, disproportionate to the biofilm level;
12. Smoking – A. non-smoker; B. <10 cigarettes/day; and C. ≥10 cigarettes/day;
13. Diabetes – A. non-diabetic (HbA1c up to 5.6%); B. HbA1c >5.6% and <7.0%; and C. HbA1c ≥ 7.0%;
14. Extension and distribution of the disease – A. healthy periodontium; B. localized (≤30%); C. generalized (>30%); D. molar–incisor (localized, ≤30%); and E. molar–incisor (generalized, >30%);
15. Peri-implant disease – A. without implant(s) or with healthy implant(s) in the mouth; B. peri-implant mucositis in up to 2 implants; C. peri-implant mucositis in 3 implants or more; D. peri-implantitis in 1 implant; E. peri-implantitis in 2 implants; F. peri-implantitis in 3 implants; and G. peri-implantitis in 4 implants or more;
16. Other systemic conditions (other than diabetes; stress, chronic obstructive pulmonary disease (COPD), cardiac disease, hyper/hypothyroidism, arthritis, atherosclerosis, respiratory disorders, gastrointestinal disorders, renal disorders, cancer, Alzheimer’s disease, adverse pregnancy, immunopathies and hematologic disorders, hereditary disorders relevant to the formation and maintenance of connective tissue and bone, granulomatous disease, osteoporosis, rheumatism, inflammatory vascular disease, and Sjögren’s syndrome) – A. no; B. yes, 1 or 2 (controlled); C. yes, 3 or more (controlled); D. yes, 1 or 2 (non-controlled); and E. yes, 3 or more (non-controlled);
17. Furcation involvement – A. no; B. Class I furcation (<3 mm of horizontal attachment loss); C. Class II furcation (≥3 mm of horizontal attachment loss); D. Class III furcation (‘through and through’ furcation involvement without direct clinical visualization); E. Class IV furcation (‘through and through’ furcation involvement with direct clinical visualization); and
18. Necrotizing lesions – A. no; B. gingival necrosis, gingival pain, spontaneous bleeding, the ulceration of the gingival margin, and halitosis; C. gingival necrosis, severe deep pain, spontaneous bleeding, halitosis, punched-out gingival papilla (inverted architecture), the loss of the alveolar bone, pseudo-membrane formation, lymph gland enlargement, low-grade fever.
Following the 2017 World Workshop on the Classification of Periodontal and Peri-implant Diseases (Tonetti, Greenwell & Kornman, 2018), these 18 parameters have been combined in an octadecagon that permits to provide an automated diagnosis and visualizes the risk for disease development. Each vector/factor has its own scale for risk profiles, as detailed above. For some parameters, the response is dichotomic: yes or no; and for others, there is a gradual increase according to the presentation. A comprehensive evaluation using this functional diagram provides an individual total risk profile and prognosis for periodontal treatment. The new scoring system, GF-PeDRA©, is based on the percentage of the octadecagon area obtained: for areas ≥0% and ≤9%, the prognosis is good; ≥10% and ≤24%, fair; ≥25% and ≤37%, poor; ≥38% and ≤49%, questionable; and ≥50%, hopeless. According to the data inserted for each item, a new design is presented in the form of octadecagon, suggesting a different GF-PeDRA© score. Each variable can achieve 100% in the tool’s weight, totaling 18 times 100%, which is used to calculate the GF-PeDRA© score.
Table 1 presents in detail the weight applied for the calculation of the GF-PeDRA© score. (Note: All the numbers can be adjusted after a greater sample size is evaluated in future studies).
Table 1. - continuation
Statistical analysis
A descriptive analysis was performed. The data retrieved was uploaded into the Excel software (v. 16.91, Microsoft Office; Microsoft Corporation, Redmond, USA). Inter-rater agreement among the professionals was assessed using Cohen’s kappa test, followed by the comparison of the results obtained by the professionals and those generated by the automated GF-PeDRA© tool.
Results
Demographic data
A total of 221 patients were enrolled (age – median (Me): 46 years; mode: 30;58), 42.4% male and 57.6% female. All demographic data is included in Table 2.
Clinical data
A total of 28 patients were diagnosed as periodontally healthy, 55 with plaque-induced gingivitis, and 138 with periodontitis. When stratifying the periodontitis cases, 33 patients were diagnosed with Periodontitis I (A = 10; B = 19; and C = 4); 18 had Periodontitis II (A = 1; B = 11; and C = 6); 35 had Periodontitis III (A = 3; B = 20; and C = 12); and 52 had Periodontitis IV (A = 0; B = 35; and C = 17). Only one case of molar/incisor pattern was observed. No peri-implant disease or necrotizing condition was found.
The mean CAL value found was 3.19 mm (min: 0 mm; max: 14 mm; Me: 2 mm; mode: 0 mm); the mean number of non-adjacent interdental surfaces with interproximal bone loss was 6 per patient. The bone loss pattern was horizontal in 135 cases (61.09%), and in 3 cases (1.36%), vertical. Twenty-five (11.31%) patients had furcation involvement. The mean percentage of BoP was 28.67% (min: 0%; max: 100%; Me: 19%; mode = 15%). The mean PD was 5.31 mm (min: 2 mm; max: 14 mm; Me: 5 mm; mode: 5 mm) (supplementary material, available from the corresponding author upon reasonable request).
GF-PeDRA© score and inter-agreement level
Comparing the diagnoses individually achieved by the evaluators, there was a good level of agreement (κ = 0.83). Therefore, 37 out of 221 patients were revised (Table 3, red letters), and the cases were discussed to reach a tiebreak and establish the final clinical periodontal diagnosis. Afterward, all information was inserted into the algorithm/tool (GF-PeDRA©) and a diagnosis for each patient was automatically obtained; the GF-PeDRA© diagnosis was compared to the final clinical periodontal diagnosis made by the professionals, resulting in a perfect agreement level (100%, κ = 1.0) (Table 3).
Furthermore, the new GF-PeDRA© score was achieved for each patient (a range from 0% to 100%). The mean GF-PeDRA© score was 28.64% (min: 0.6%; max: 64.1%; Me: 32.2%). Then, analyzing the GF-PeDRA© scores of the 221 patients enrolled, 48 (21.73%) were classified as having a good prognosis for periodontal treatment, 43 (19.46%) had a fair prognosis, 43 (19.46%) had a poor prognosis, 68 (30.77%) had a questionable prognosis, and 19 (8.60%) had a hopeless prognosis. Table 3 presents detailed results per patient.
Discussion
The concept of periodontal risk assessment was introduced as a systematic approach to evaluating the patient’s risk for developing periodontal disease.6, 7 It is worth remembering that periodontal disease is a prevalent condition that affects millions of people worldwide,11 posing significant risks to oral and systemic health. Thereby, accurate risk assessment is critical for effectively managing and preventing periodontal disease, guiding clinicians in tailoring preventive and therapeutic strategies to individual patients. Over the years, various tools have been developed and modified to enhance their predictive accuracy and clinical utility. However, given the changes in the classification system – since many existing tools were developed and reported based on older versions, and are therefore outdated despite their usefulness – and the various shortcomings observed, this study aimed to introduce, test and validate a new algorithm/tool for periodontal diagnosis, risk assessment and treatment prognosis (GF-PeDRA©).
The proposed tool provides a practical and visually intuitive chart, with one version tailored for professionals and another for patients, to facilitate the demonstration and explanation of clinical findings. To the best of our knowledge, this is the first report in the literature describing a periodontal/peri-implant diagnostic and automated tool that integrates the evaluation of an extensive set of parameters (n = 18) based on the new classification system, thereby enhancing diagnostic accuracy, educational utility, and patient comprehension of periodontal and peri-implant conditions.
Among the available tools, one of the most important is PRA,9 which intends to help generate data and information for the clinician based on 6 parameters, whereas GF-PeDRA© has 3 times the number of parameters assessed. The criteria used in PRA are summarized in a hexagonal functional diagram, identifying patients as low-, moderate- or high-risk. All the factors evaluated in PRA were also taken into consideration in the new algorithm/tool (GF-PeDRA©): (1) the probing pocket depth (PPD); (2) tooth loss (the number of missing teeth from 1 to 28 (wisdom teeth are not included)); (3) BoP; (4) bone loss over age (bone loss/age, % alveolar bone loss) – reporting the amount of alveolar bone loss at the most advanced site in increments of 10% (in the case of periapical radiographs, the % alveolar bone loss is compared with the distance measured at 1 mm apical from the cementoenamel junction (CEJ) to the root apex, and for bitewing radiographs, the % alveolar bone loss is calculated with 10% per 1 mm); (5) the environment considering smoking only (non-smoker; former smoker – if tobacco use cessation occurred 5 years ago or earlier; occasional smoker – up to 10 cigarettes per day; smoker – up to 20 cigarettes per day; and heavy smoker – more than 20 cigarettes per day); and (6) the systemic condition of the patient (diabetes type I or II, interleukin 1 (IL-1) gene polymorphism, or stress).
Despite its validation and widespread international use, the PRA system, when compared to more recently developed tools,12, 13, 14, 15, 16 and in light of advances in research and updates to the classification system, may transmit imprecise or incomplete information to clinicians and patients, as it is based on a relatively limited set of factors. The PRA system presents several limitations. (1) It allows the selection of 2, 4 or 6 sites per tooth or implant, which may lead to inconsistencies in data collection. (2) It accounts for tooth loss without considering the underlying reason for extraction. (3) It lacks parameters necessary to accurately assess disease severity (e.g., interdental CAL), complexity (e.g., furcation involvement, masticatory dysfunction, secondary occlusal trauma, severe ridge defects, bite collapse drifting or flaring, and fewer than 20 remaining teeth) and extent (localized, generalized or the molar–incisor pattern). (4) It incorporates highly subjective personal parameters, such as stress and socioeconomic factors, that are difficult to define and compare objectively. (5) Finally, all parameters within the PRA system are weighted equally, which may lead to unrealistic results, although adjusting this limitation is not straightforward.
Genetic factors are correlated to predisposition and play a crucial role in periodontal disease susceptibility. Polymorphisms in specific genes, such as those encoding interleukins and other inflammatory mediators, have been linked to an increased risk of periodontitis.17, 18 Although it is highly important, it is not a simple factor to be observed; it was indirectly approached in GF-PeDRA©. Similarly, considering systemic conditions beyond diabetes enables a better understanding of the bidirectional relationship between periodontal disease and other systemic disorders (e.g., cardiovascular disease, osteoporosis and obesity). These conditions are closely associated with systemic inflammation, which can exacerbate periodontal disease.19 In recognition of the importance of these systemic factors, GF-PeDRA© also incorporated them into its assessment framework.
Some parameters have been standard for periodontal assessment tools, such as smoking and diabetes, 2 of the most significant risk factors or truly acknowledged modifying factors. Smoking has been consistently linked with an increased risk of periodontitis due to its adverse effects on the immune response and tissue healing.20 Similarly, diabetes is associated with an elevated risk of periodontal disease, primarily due to the impact of hyperglycemia on immune function and tissue integrity.21 Other recognized parameters are PPD and BoP, which are direct indicators of periodontal health; PPD measures the pseudo-pocket or the severity of tissue destruction, while BoP reflects the inflammation level and disease activity.17
Comparing risk assessment models/tools, it is possible to observe significant differences in various approaches; some focus more on clinical parameters, whereas others emphasize systemic and genetic factors. Studies have shown that some tools offer higher predictive accuracy than traditional PRA, particularly in identifying patients at risk for rapid disease progression.22 Incorporating genetic and systemic factors into a modified version of PRA improved its capacity to identify high-risk individuals who may not yet present with severe clinical manifestations, and thus enhanced its reliability. However, this enhancement also made the assessment less practical for routine clinical use due to the limited accessibility of such data. Therefore, the clinical utility of these models varies depending on their complexity and the resources available to the practitioner. For example, some models are more accessible to general practitioners due to their simplicity, while others require specialized knowledge and equipment.23 Thereby, although GF-PeDRA© has more questions and parameters/factors to be addressed, it can be considered a simple tool with high accuracy.
Some authors have invited readers to rethink diseases such as peri-implantitis, which is not approached by many available tools.24 GF-PeDRA© refers to this aspect among its numerous reliable items: (1) highest PD value; (2) number of interproximal sites with bone loss; (3) highest CAL value; (4) maximum RBL; (5) percentage of sites with BoP; (6) bone loss pattern; (7) tooth loss, including periodontally hopeless teeth planned for extraction; (8) evidence of progression over 5 years; (9) need for complex rehabilitation; (10) patient’s age; (11) CAL and biofilm accumulation; (12) smoking; (13) diabetes; (14) extension and distribution of the disease; (15) peri-implant disease; (16) other systemic conditions (other than diabetes); (17) furcation involvement; and (18) necrotizing lesions. Some of the information is not easy to reach. It should be emphasized that clinical experience remains indispensable for the accurate interpretation of individual cases; for instance, bone loss around prosthetic crowns25 should not be misclassified as periodontitis.
Limitations
It is necessary to consider a more extended period to obtain all data, making the result more precise and reliable. Even though the inclusion of 221 patients occurred by chance, more than half of the participants were diagnosed with periodontitis, and around 25% had severe periodontitis – a prevalence higher than that reported in the general population, where approx. 42% of individuals over 30 years old have periodontitis, and 7.8% present with severe forms, according to the National Institutes of Health (NIH).11 As this was an initial observational study of the proposed tool, future research should perform appropriate sample size calculations to ensure representative results. Increasing the sample size could yield a distribution of periodontitis cases more consistent with population estimates.
Conclusions
The new algorithm/tool (GF-PeDRA©) proved to help diagnose periodontal/peri-implant conditions. It provides a new and feasible scoring system for risk assessment (the GF-PeDRA© score) and the prognosis of periodontal treatment, which must be validated in future clinical studies with more patients. Then, the longitudinal evaluation of patients is recommended to confirm the proposed prognosis and improve the reliability of this new system.
Ethics approval and consent to participate
The study was approved by the local research ethics committee at A.T. Still University, St. Louis, USA (No. of approval: ATSU – IRB GF20240929-001). All participants signed an informed consent form.
Data availability
The datasets supporting the findings of the current study are available from the corresponding author on reasonable request.
Consent for publication
Not applicable.
Use of AI and AI-assisted technologies
Not applicable.