


Abstract
Background. Children with Down syndrome (DS) frequently experience nutritional issues. Some of them are attributed to gastrointestinal tract abnormalities, while others are due to feeding behaviors. Previous studies have reported inconclusive results regarding the prevalence of dental caries among individuals with DS.
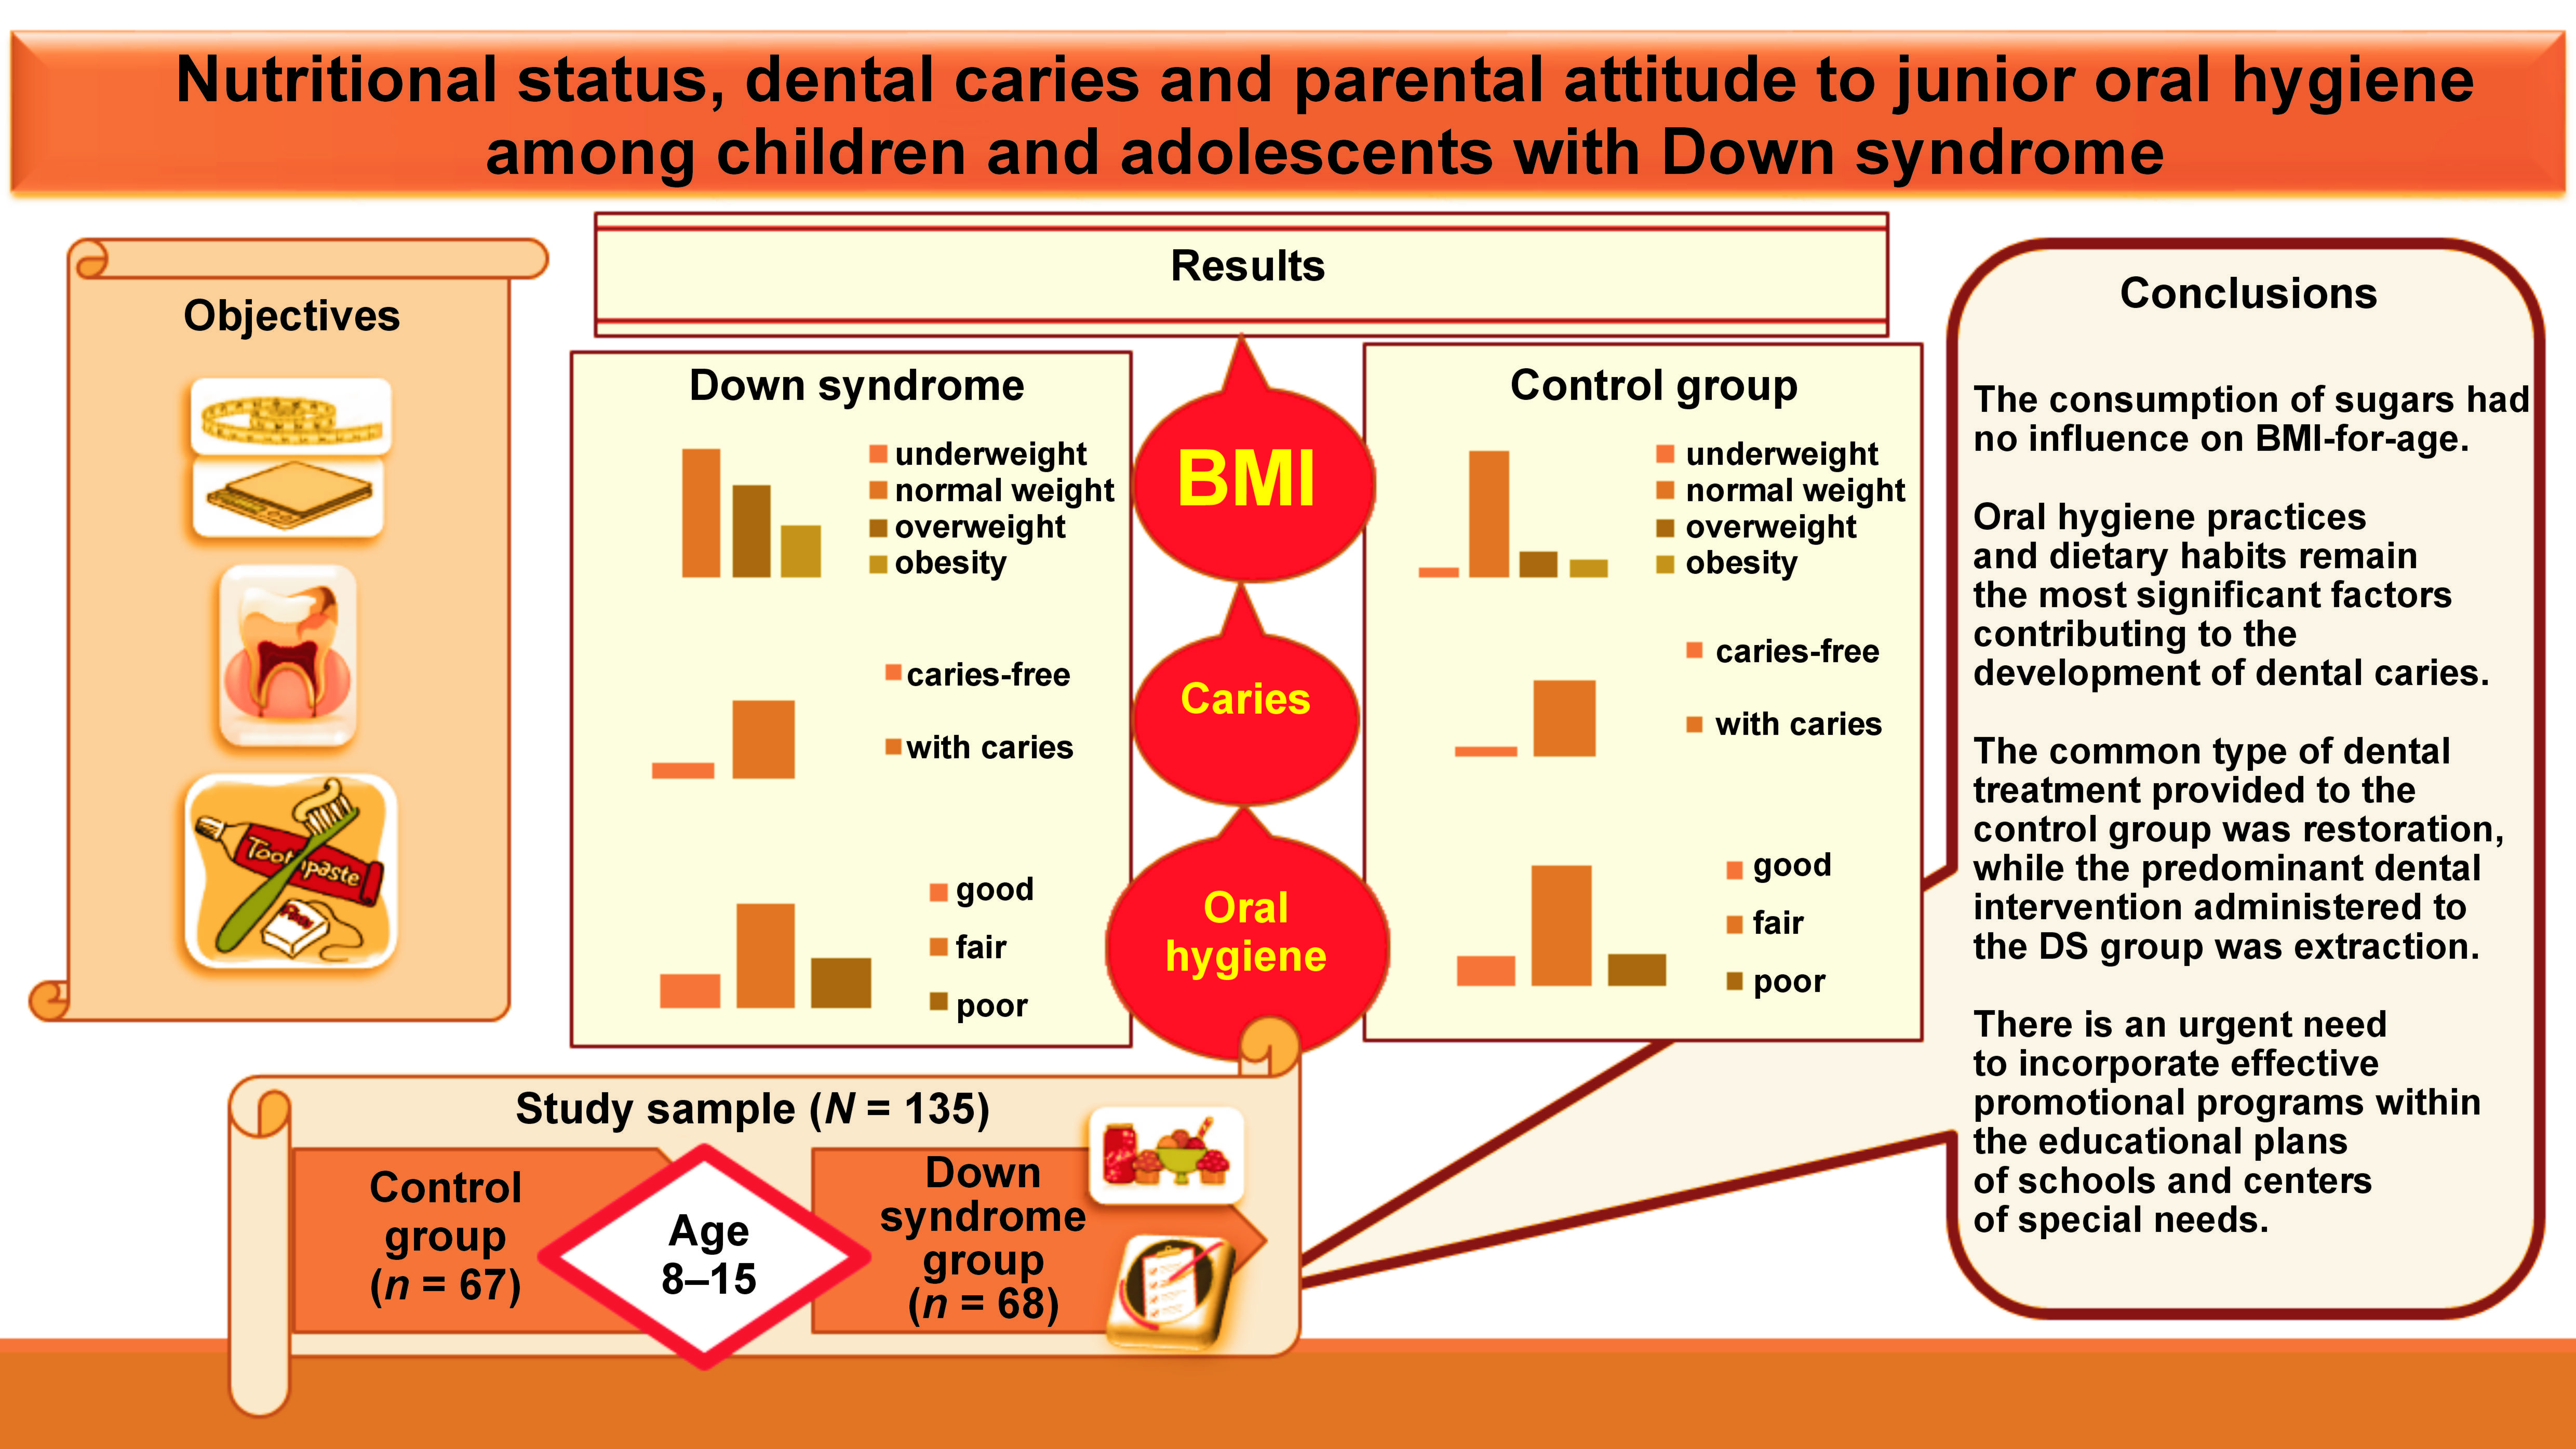
Objectives. The study aimed to assess the nutritional status, prevalence of dental caries and oral hygiene level among children and adolescents with DS aged 8–15 years in comparison to healthy peers.
Material and methods. A case–control observational study was carried out in Damascus, Syria, and its surrounding countryside. The study included 135 participants between the ages of 8 and 15 years who were divided into 2 groups based on the presence of DS. The data was processed using the IBM SPSS Statistics for Windows software, v. 26. The Kruskal–Wallis H test, Mann–Whitney U test and χ2 test, as well as Spearman’s correlation were implemented.
Results. Almost half of the participants in the DS group were classified as overweight or obese (33.9% and 19.1%, respectively), while the percentages of overweight and obese children in the control group were 14.9% and 10.4%, respectively. No statistically significant results were noted between oral hygiene levels and the prevalence of dental caries among the study groups (p > 0.05). Only 50% of parents thought that their children needed help during daily oral hygiene practices; however, only 39.4% of parents actually provided such assistance.
Conclusions. Children and adolescents with DS exhibited a tendency toward shorter stature in comparison to their peers. In the DS group, the economic status and paternal education level exhibited an inverse correlation with body mass index (BMI)-for-age. Oral hygiene practices and dietary habits are the most influential factors in the development of dental caries. The DS group followed an unhealthy dietary pattern, characterized by elevated levels of sugar consumption. There is an urgent need for effective promotion programs within the educational plans of schools and centers of special needs. These programs must educate parents and caregivers about effective oral hygiene practices and make them aware of their children’s need for help during the oral hygiene process.
Keywords: nutritional status, oral hygiene, Down syndrome, BMI-for-age, parental attitude
Introduction
Down syndrome (DS) is a prevalent genetic disorder that occurs due to trisomy of chromosome 21. The syndrome manifests in 3 different chromosomal forms: simple trisomy 21; translocation trisomy; and mosaic trisomy.1 Down syndrome is associated with cardiovascular disorders, digestive system abnormalities and metabolic disorders.2 It is also accompanied by intellectual disabilities, which are measured by the intelligence quotient (IQ) level. The IQ level of individuals with DS ranges from average to limited, and decreases with age.3
The following oral manifestations have been observed in individuals with DS: mouth breathing; macroglossia; missing teeth; developmental dental defects; microdontia; crowding; and a high prevalence of periodontal disease that progresses rapidly due to local factors, such as tooth morphology, bruxism, malocclusion, and poor oral hygiene.4
Children with DS frequently experience nutritional problems, either due to gastrointestinal tract abnormalities3 or feeding behaviors.5 However, many defects of the digestive system are associated with a slow rate of development, including delayed primary tooth eruption.3 Children with DS also suffer from difficulties in chewing and swallowing. The aforementioned factors have been demonstrated to result in nutritional deficiencies within this group. Moreover, it was found that children with DS exhibited deficiencies in protein, fat, vitamin, and mineral levels (sodium, potassium, calcium, phosphorus, and iron) when compared to their siblings.6
Furthermore, individuals with DS have an increased risk of overweight and obesity, which can be attributed to abnormal lipid metabolism and type II diabetes, as well as decreased physical activity due to defects of the body.3, 6 In addition, a significant increase in carbohydrate intake was observed in these children.5
Inconclusive results were found when studying the prevalence of dental caries among individuals with DS. The majority of studies have reported a decrease in the incidence of caries among patients with DS, while several studies found an increase in the rate of dental caries when compared to healthy individuals.7
The prevalence of dental caries varies across different populations. In general, the majority of adults develop caries at some point during their lives.8 Previous studies have identified the factors that contribute to dental caries. Diet plays an important role in the occurrence of dental caries. A study has indicated that eating added sugars more than 4 times per day was associated with an increased risk of dental caries.9 In addition, some researchers have suggested that, in addition to genetic predisposition, the diet and oral hygiene habits of the family remain the main factors contributing to susceptibility to caries.10 The family structure has a great influence on the development of dental caries, particularly with regard to the parental attitude toward oral hygiene practices and dietary habits of children.11
Unfortunately, there is a dearth of available data regarding the oral health of children with DS in Syria. This paper is the first to describe the nutritional status, prevalence of dental caries, and parental attitude to junior oral hygiene among children and adolescents with DS in Syria.
The aim of this study was to assess the nutritional status of children and adolescents with DS, aged 8–15 years, as well as to evaluate the prevalence of dental caries and oral hygiene level among the DS group compared to their healthy peers. A questionnaire was submitted to parents and caregivers of children with DS to evaluate the frequency of sugar intake and daily oral hygiene practices.
Material and methods
Study design
An observational case–control study was carried out in Damascus, Syria, and its surrounding countryside. The data collection was conducted from January to March of 2019, during at least 2 visits to each center. The purpose of the first visit was to explain the study objectives and procedures to the center’s officials, as well as disseminating questionnaires and informed consents to parents and caregivers. Subsequent visits were focused on conducting examination procedures and collecting completed questionnaires.
Ethics approval
The study was approved by the Ethics Committee and the Board of Scientific Research at the Faculty of Dentistry, Damascus University, Syria (approval No. DUUS-2797-12072018). In addition, official permissions were obtained from the Ministry of Health, the Ministry of Social Affairs and Labor, the Ministry of Education, and the Ministry of Higher Education and Research of Syria. Written informed consent to participate in the study was attained from parents or caregivers of all study subjects.
Study sample
The study included 135 participants aged 8–15 years, with a mean age of 11.77 ±2.51 years. The study sample was classified into 2 following groups based on the presence of DS: case group (DS group); and control group.
Case group
The case group included a total of 68 children and adolescents with DS who were registered, at the time of study, in special needs centers affiliated with the Ministry of Social Affairs and Labor in Syria. The diagnosis of DS was made by a medical specialist, and the child’s medical record was attached to the center’s registration file.
Control group
The control group, which comprised a total of 67 children and adolescents without syndromes or chronic diseases, was selected for the study. Controls were randomly selected from schools located in close proximity to the centers for special needs, and they matched the case group in terms of sex, age and the socioeconomic status.
The subjects were divided into 2 age groups based on their education level, as follows: children attending primary school (aged 8–11 years); and adolescents attending middle school (aged 12–15 years).
Eligibility criteria
The inclusion criteria encompassed children and adolescents aged 8–15 years with no personal reasons that would prevent them from participating in the study.
Children undergoing orthodontic treatment that prevents the dental examination, children exposed to radiation or chemotherapy, those with active infectious diseases that require extra precautions, and extremely uncooperative children were excluded from the study.
Study tools
The following instruments were used in the study: infection control tools; personal protective equipment; a portable (light-emitting diode (LED)) headlight; a World Health Organization (WHO) probe; a disposable dental explorer; a disposable dental mirror; cotton rollers; a stadiometer for height measurement; and a digital scale for weight measurement.
Examination procedure
The examination procedure and data collection were conducted in accordance with the WHO guidelines published in 2013.12 The oral examinations were performed by a single examiner (REM) in a designated area prepared by a center or a school. During the oral examination, the participant was seated on a chair facing the examiner. The oral examination was conducted using a portable headlight, a WHO probe and a disposable dental mirror. The DMFT/dmft (decayed, missing, and filled permanent teeth/decayed, missing, and filled primary teeth) indices were used to assess dental caries,12 and the plaque index (Silness & Löe)13 was employed to evaluate oral hygiene level. Teeth that were supernumerary, third permanent molars, congenitally missing teeth, and teeth that were extracted or filled for reasons other than caries were excluded from the analysis.
Height and weight measurement and BMI calculation
The weight of the participants was measured with the use of a digital scale and recorded in kilograms [kg]. During the measurement process, the subjects wore light clothes and were asked to remove their bags and hats. Weight was measured with a precision of 100 g. Height was determined using a stadiometer and recorded in centimeters [cm]. During the measurement, the participants were barefoot and their feet were in full contact with the ground while in a standing position. The body mass index (BMI) [kg/m2] was calculated using the patient’s weight and height measurements. The LMS (skewness (L), median (M), and coefficient of variation (S)) method was applied to calculate BMI-for-age (Z-scores), which is based on the WHO growth reference data for individuals aged 5–19 years.14 Subsequently, the children were classified into the following 4 categories based on the obtained Z-scores of BMI-for-age: underweight; normal weight; overweight; and obese.15
Questionnaire
The DS group received a questionnaire that was to be completed by parents or caregivers (available on request from the corresponding author). The questionnaire was developed for the current study and contained demographic data (full name, age in years and months, sex, address, and telephone number), socioeconomic status data (father/mother education level, father/mother job, and family monthly income), medical history (systemic diseases, medications and presence of any medical conditions), dietary information, and daily oral hygiene practices. The dietary information was related to the frequency of sugar intake by identifying the foods consumed by the majority of Syrian children, based on the findings of the study conducted by Al Bitar and Kouchaji.16 The frequency of food intake was classified into 6 categories (never, several times a month, once a week, several times a week, once a day, and several times a day). The oral hygiene practices included toothbrushing frequency (less than once a day, once a day, and more than once a day), the use of fluoridated toothpaste, and additional methods incorporated into daily hygiene practices, such as the use of dental floss and mouthwash. The parents’ attitude toward their children’s oral hygiene was assessed by exploring their opinions on whether children require assistance during daily oral hygiene practices and the extent to which they actually provide it. The reliability of the questionnaire was assessed by requesting that 20 parents complete and discuss questions in person. Cronbach’s alpha was used to measure the reliability (α = 0.80).
The economic status of the population was classified into 3 categories: good; moderate; and poor. Educational levels of both parents were also divided into 3 categories, namely high (university), moderate (secondary, high school), or low (primary school).
Statistical analysis
The data was processed using the IBM SPSS Statistics for Windows software, v. 26.0 (IBM Corp., Armonk, USA). Descriptive statistics were calculated for all independent and outcome variables. The Kruskal–Wallis H test, Mann–Whitney U test and χ2 test were implemented. Spearman’s correlation was used to study the relationships between variables. A value of p < 0.05 was considered statistically significant at the 95% confidence level.
Results
The present study encompassed a total of 135 participants, including 68 subjects (50.4%) with DS and 67 (49.6%) matched healthy children. According to the WHO criteria for survey design, the participants were classified into 2 age groups: children (8–11 years old); and adolescents (12–15 years old). No statistically significant differences were identified between the 2 groups with regard to sex, age, the economic status, and parents’ education levels (p > 0.05) (Table 1). The prevalence of caries was 82.4% and 88.1% in the DS group and the control group, respectively (p > 0.05). Similarly, no statistically significant differences were observed in oral hygiene level (p > 0.05). However, the percentage of individuals with poor oral hygiene was 26.5% in the DS group and 17.9% in the control group. A statistically significant discrepancy was identified between the groups for BMI-for-age (p = 0.004). Underweight children were found only in the control group, at a rate of 6%, and there were no underweight children in the DS group. Nearly half of the subjects in the DS group were overweight and obese (33.9% and 19.1%, respectively), compared to 14.9% and 10.4%, respectively, in the control group (Table 1).
Moreover, a statistically significant difference was identified when studying BMI differences between the DS and control groups (p = 0.004). This index necessitated the evaluation of its components, including height and weight. No statistically significant difference was found for weight between the groups (p > 0.05); however, a significant difference was identified for height (p = 0.000). The mean height in the DS group was lower (137.07 ±14.38 cm) compared to the control group (148.34 ±15.83 cm) (Table 2).
In the 8–11 age group, no statistically significant differences were observed between the groups in terms of the DMFT index or its components (p > 0.05). A lack of statistical significance was also identified between the 2 groups in terms of carious primary teeth, missing primary teeth and the dmft index (p > 0.05). However, a statistically significant difference was observed between the 2 groups in terms of filled primary teeth (p = 0.009). The mean number of filled primary teeth in the DS group was lower (0.09 ±0.38) compared to the control group (0.38 ±0.60) (Table 3).
In the 12–15 age group, none of the adolescents in the control group had primary teeth, while 10 adolescents in the DS group had primary teeth. No statistically significant differences were identified between the DS group and the control group with regard to the number of decayed permanent teeth, filled permanent teeth and the DMFT index (p > 0.05). However, a statistical significance was observed between the groups when comparing missing permanent teeth (p = 0.012) (Table 3).
Upon examining the correlations between the prevalence of caries and the variables mentioned in Table 4, no statistically significant relationships were found with regard to BMI-for-age, the economic status and parents’ education levels within the 2 groups (p > 0.05). However, a significant negative correlation was identified between the prevalence of caries and oral hygiene level in the DS group (p = 0.004) and the control group (p = 0.000).
In the DS group, a significant negative correlation was identified between BMI-for-age and the economic status (p = 0.024). Additionally, a negative correlation was observed between BMI-for-age and father’s education level. However, in the control group, there were no statistically significant correlations between BMI-for-age and other variables (Table 5).
When studying the differences between the DMFT/dmft indices and the variables related to the questionnaire administered to the DS group, there were no statistically significant differences between the DMFT/dmft indices and the following factors: medication intake; the use of fluoridated toothpaste; the use of dental floss or mouthwash; and parental assistance during oral hygiene practices (p > 0.05). A statistically significant relationship was identified between the DMFT index and brushing frequency (p = 0.037) (Table 6).
The percentage of parents who thought that their children require help in daily oral hygiene practices was 50%. However, only 39.4% of them provided such assistance. Moreover, 50% of parents believed that juniors did not require assistance, yet 7.6% of them offered help (Table 7).
The most frequently consumed food item among the DS group (consumed several times a day) was bread (54.4%). The products most often eaten once a day were biscuits or chips (42.6%), followed by tea with sugar 39.7% (Table 8).
A significant positive correlation was identified between the prevalence of caries and the consumption of biscuits or chips (p = 0.041). Additionally, there was a significant negative relationship between oral hygiene level and the consumption of tea with sugar (p = 0.038) (Table 9).
Discussion
It is important to eliminate the interfering factors, such as the economic status and parental education level, when comparing the nutritional status and dental caries between the DS group and the control group. Hence, upon examining the differences in sex, age, the economic status, and both parents’ education level between the 2 groups, no statistical significance was found (Table 1). The nutritional status was represented by BMI-for-age, as recommended by the WHO.17 The American Academy of Pediatrics (AAP) has suggested using the growth charts developed by the Centers for Disease Control and Prevention (CDC) or the WHO when following children with DS, until the growth charts specific to DS become available.18 The current study used the growth charts provided by the WHO in 2007 due to their universality and a large number of measurements, making them representative of all races and countries. Many studies have used these charts, including a study by El Harake et al. on the nutritional status of Syrian children residing in Lebanon.19
Almost half of the subjects in the DS group were classified as overweight or obese, while underweight children were only observed in the control group (Table 1). An investigation into the BMI components between the 2 groups revealed that there was no statistically significant difference in weight (p = 0.435), while a statistically significant difference was noted in height (p = 0.000), resulting in a significant difference in BMI (p = 0.004) (Table 2). The mean height in the DS group (137.07 ±14.38 cm) was lower than that in the control group (148.34 ±15.83 cm) (Table 2). The previously mentioned result has been reported in numerous studies.20, 21, 22 In general, measurements may also be influenced by familial and environmental factors, such as diet and physical activity.23 Nasreddine et al. reported that the prevalence of overweight and obese adolescents in Syria was 18.95% and 8.6%, respectively,24 which was similar to the prevalence rate observed in the current study for the control group. Obesity was influenced by sex, the consumption of carbohydrates and fats, as well as parents’ education level.24 The findings of this study stood in contrast to those of a study conducted by Sharav and Bowman, which did not observe any significant differences in obesity between children with DS and their siblings.23 The authors attributed overweight and obesity to the influence of familial and environmental factors more than to DS.23 In addition, children with DS tend to become obese with age due to a diet rich in carbohydrates, laziness associated with mental and cognitive disorders, short stature, and metabolic and digestive problems.3
Furthermore, the investigation into the relationships between BMI-for-age and variables such as oral hygiene level, economic status and parental education levels revealed no statistically significant correlation in the control group. However, in the DS group, a significant negative correlation was observed between BMI-for-age and father’s education level (p = 0.011). A significant negative correlation was identified between BMI-for-age and the economic status (p = 0.024) (Table 5). In general, father’s education level was correlated with the economic status of the family. The economic status had a significant influence on the quality of the food consumed.
In the context of Syrian culture, the father traditionally provides food for his family. As the level of education among a given population is low, it affects the quality of food consumed by the family. Moreover, children with DS sometimes follow a different diet compared to their families.6 Parents may permit their DS children, specifically, to indulge in nutritional excesses and satisfy their preferences.5
Unfortunately, the children in both study groups had poor oral health, and there was no preference for any group over the other. Dental caries reached high rates in the DS group and the control group (82.4% and 88.1%, respectively) (Table 1). This finding emphasizes the problem of dental caries in children and stands in contrast to previous studies that reported a lower incidence of caries among individuals with DS compared to healthy controls.7, 25 This discrepancy could be attributed to the differences in the studied population, particularly given the recent rise in the prevalence of dental caries. In 2017, the prevalence of caries in Syrian children aged 8–12 years was 79.1%.26 The absence of health promotion programs, limited knowledge of effective oral hygiene practices, and neglecting regular visits to the dental clinic contribute to this problem. Syrian children, even those in good health, rarely receive dental care unless they are experiencing dental pain. A study by Al Habashneh et al. reported that one of the reasons for not attending dental care among children with DS is maternal unawareness of the dental needs of their children.27 Typically, children with DS present with poor oral health due to the numerous DS health concerns, experienced by their parents, who consequently neglect oral health and give it a low priority in comparison to general health.28 Moreover, medication has been identified as a risk factor for caries in children with DS due to its high sugar content and the necessity of regular administration.7
The sample was divided into 2 age groups, children attending primary school (aged 8–11 years) and adolescents attending middle school (aged 12–15 years). The members of each age group shared a set of characteristics, such as educational stage, diet and hormonal changes.
In the group of children, the decayed primary teeth values in the DS group and the control group were 3.00 ±3.28 and 2.94 ±2.87, respectively (Table 3). The mean values for decayed permanent teeth in the DS group and controls were 1.24 ±1.64 and 0.92 ±1.18, respectively (Table 3). As mentioned earlier, the high incidence of caries was observed to be consistent across all subjects, irrespective of the group. The filled primary teeth values were higher in the control group (0.38 ±0.60) compared to the DS group (0.09 ±0.38), with a statistically significant difference between them (p = 0.009) (Table 3). The children in the control group were more likely to undergo restorative dental procedures, while such interventions were usually absent in the DS group.
In the group of adolescents, none of the subjects in the control group had primary teeth, while 10 individuals in the DS group were observed to have them. This observation may suggest a potential delay in the eruption of permanent teeth in the DS group compared to the control group, and/or the long-term survival of primary teeth. In the DS group and the control group, the number of missing permanent teeth was 0.45 ±1.06 and 0.00 ±0.00, respectively (p = 0.012) (Table 3). This finding indicates that the predominant dental treatment provided to individuals with DS is extraction. These results align with the outcomes of previous studies, which reported that the primary dental treatment administered to the healthy group was restoration, followed by extraction, while the primary dental treatment administered to the DS group was extraction.27, 29
Makieh et al. found a statistically significant relationship between DS and diffuse opacities.30 Usually, diffuse opacities are related to a low incidence of caries.31 Despite the high prevalence of diffuse opacities in Syrian children with DS,30 the prevalence rate of dental caries did not decrease compared to the healthy controls. The high prevalence of both diffuse opacities and dental caries among children with DS prompted us to consider the role of diet and oral hygiene practices as potential contributing factors.
Previous studies did not examine the relationship between medication intake and dental caries in children with DS. Consequently, the current study offers novel insights into this condition. When studying the influence of medications on caries among children with DS, no statistically significant difference was found in the DMFT and dmft scores (p = 0.888 and p = 0.889, respectively) (Table 6). The impact of brushing frequency on DMFT was statistically significant (p = 0.037). The mean DMFT was 1.89 ±2.54 for brushing once a day, 4.14 ±4.46 for brushing less than once a day, and 2.60 ±2.79 for brushing more than once a day (Table 6). A study by Rothen et al. corroborated previous findings.32 The investigation revealed that the most significant factors associated with a decrease in dental caries are toothbrushing with fluoridated toothpaste once or more per day.32
Individuals with DS suffer from degenerative changes in the brain that affect overall body development, resulting in inconsistency and delay in motor development, as well as a lack of coordinated movements.3 In such patients, the following oral manifestations were identified: mouth breathing; macroglossia; cleft tongue and lips; morphological disorders; inflammation of the corners of the mouth; small teeth; malocclusion; and crowding.4 Based on the above factors, individuals with DS may not be able to perform oral hygiene practices on their own, necessitating parental or caregiver assistance during daily oral hygiene routines. Parents could help by teaching them effective brushing techniques, reminding them to brush teeth, and monitoring the process. It is important for parents and caregivers to recognize their children’s need for help. Only 50% of parents were aware of their children’s need for assistance during toothbrushing. However, only 39.4% of those parents provided help (Table 7). The decision of whether or not to provide assistance had no influence on the DMFT and dmft scores. One potential explanation for this finding is that parents may have limited knowledge regarding effective brushing techniques. Therefore, it is necessary to educate parents on the correct techniques of toothbrushing and inform them of the importance of assisting their children during the oral hygiene process.
A study by Jaghasi et al. found that bread was the most consumed food daily by 58.8% of schoolchildren in Damascus.33 This outcome is consistent with the current study, which revealed that 54.4% of children with DS consumed bread several times a day. From all common products enumerated in Table 9, biscuits/chips had a significant positive correlation with caries prevalence rate. Furthermore, 42.6% of children with DS consumed biscuits or chips once a day. Tea with sugar, consumed by 39.7% of children with DS once a day, had a negative correlation with oral hygiene level (p = 0.038) (Table 8,Table 9). The abovementioned results highlight an inappropriate consumption of sugars and a lack of control in food intake among children with DS. Furthermore, the consumption of sugars on more than 3 occasions daily increases the incidence of dental caries.33, 34
It is important to note that the present study did not take into account the quantity of sugar intake or its placement between meals, and it was limited to analyzing sugar intake only in terms of frequency.
Conclusions
Children and adolescents with DS exhibited a tendency toward shorter stature in comparison to their peers, which resulted in BMI-for-age values indicating overweight or obesity. The consumption of sugars had no influence on BMI-for-age. In the DS group, the economic status and father’s education level correlated inversely with BMI-for-age. Oral hygiene practices and dietary habits remain the most significant factors contributing to the development of dental caries. The current study found that the economic status and parental education levels have no impact on dental caries. Additionally, the analysis revealed that medication intake did not have an influence on the DMFT and dmft indices. The common type of dental treatment provided to the control group was restoration, while the predominant dental intervention administered to the DS group was extraction. The children with DS followed inappropriate diet, characterized by a high intake of sugars. There is an urgent need to incorporate effective promotional programs within the educational plans of schools and centers of special needs, which would include appropriate dietary and oral health care instructions. In addition, it is imperative to educate parents and caregivers on effective oral hygiene practices and make them aware of their children’s need for assistance during the oral hygiene process. Additionally, an emphasis should be placed on the importance of treating dental caries at its earliest stages.
Ethics approval and consent to participate
The study was approved by the Ethics Committee and the Board of Scientific Research at the Faculty of Dentistry, Damascus University, Syria (approval No. DUUS-7972-12072018). In addition, official permissions were obtained from the Ministry of Health, the Ministry of Social Affairs and Labor, the Ministry of Education, and the Ministry of Higher Education and Research of Syria. Written informed consent to participate in the study was attained from parents or caregivers of all study subjects.
Data availability
The datasets generated and/or analyzed during the current study are available from the corresponding author on reasonable request.
Consent for publication
Not applicable.
Use of AI and AI-assisted technologies
Not applicable.