Abstract
Background. Resin-matrix ceramics have been developed to combine the high esthetics of ceramics with the mechanical properties of composite resin. The surface changes of these materials when exposed to highly consumed beverages are still not fully elucidated and need further research.
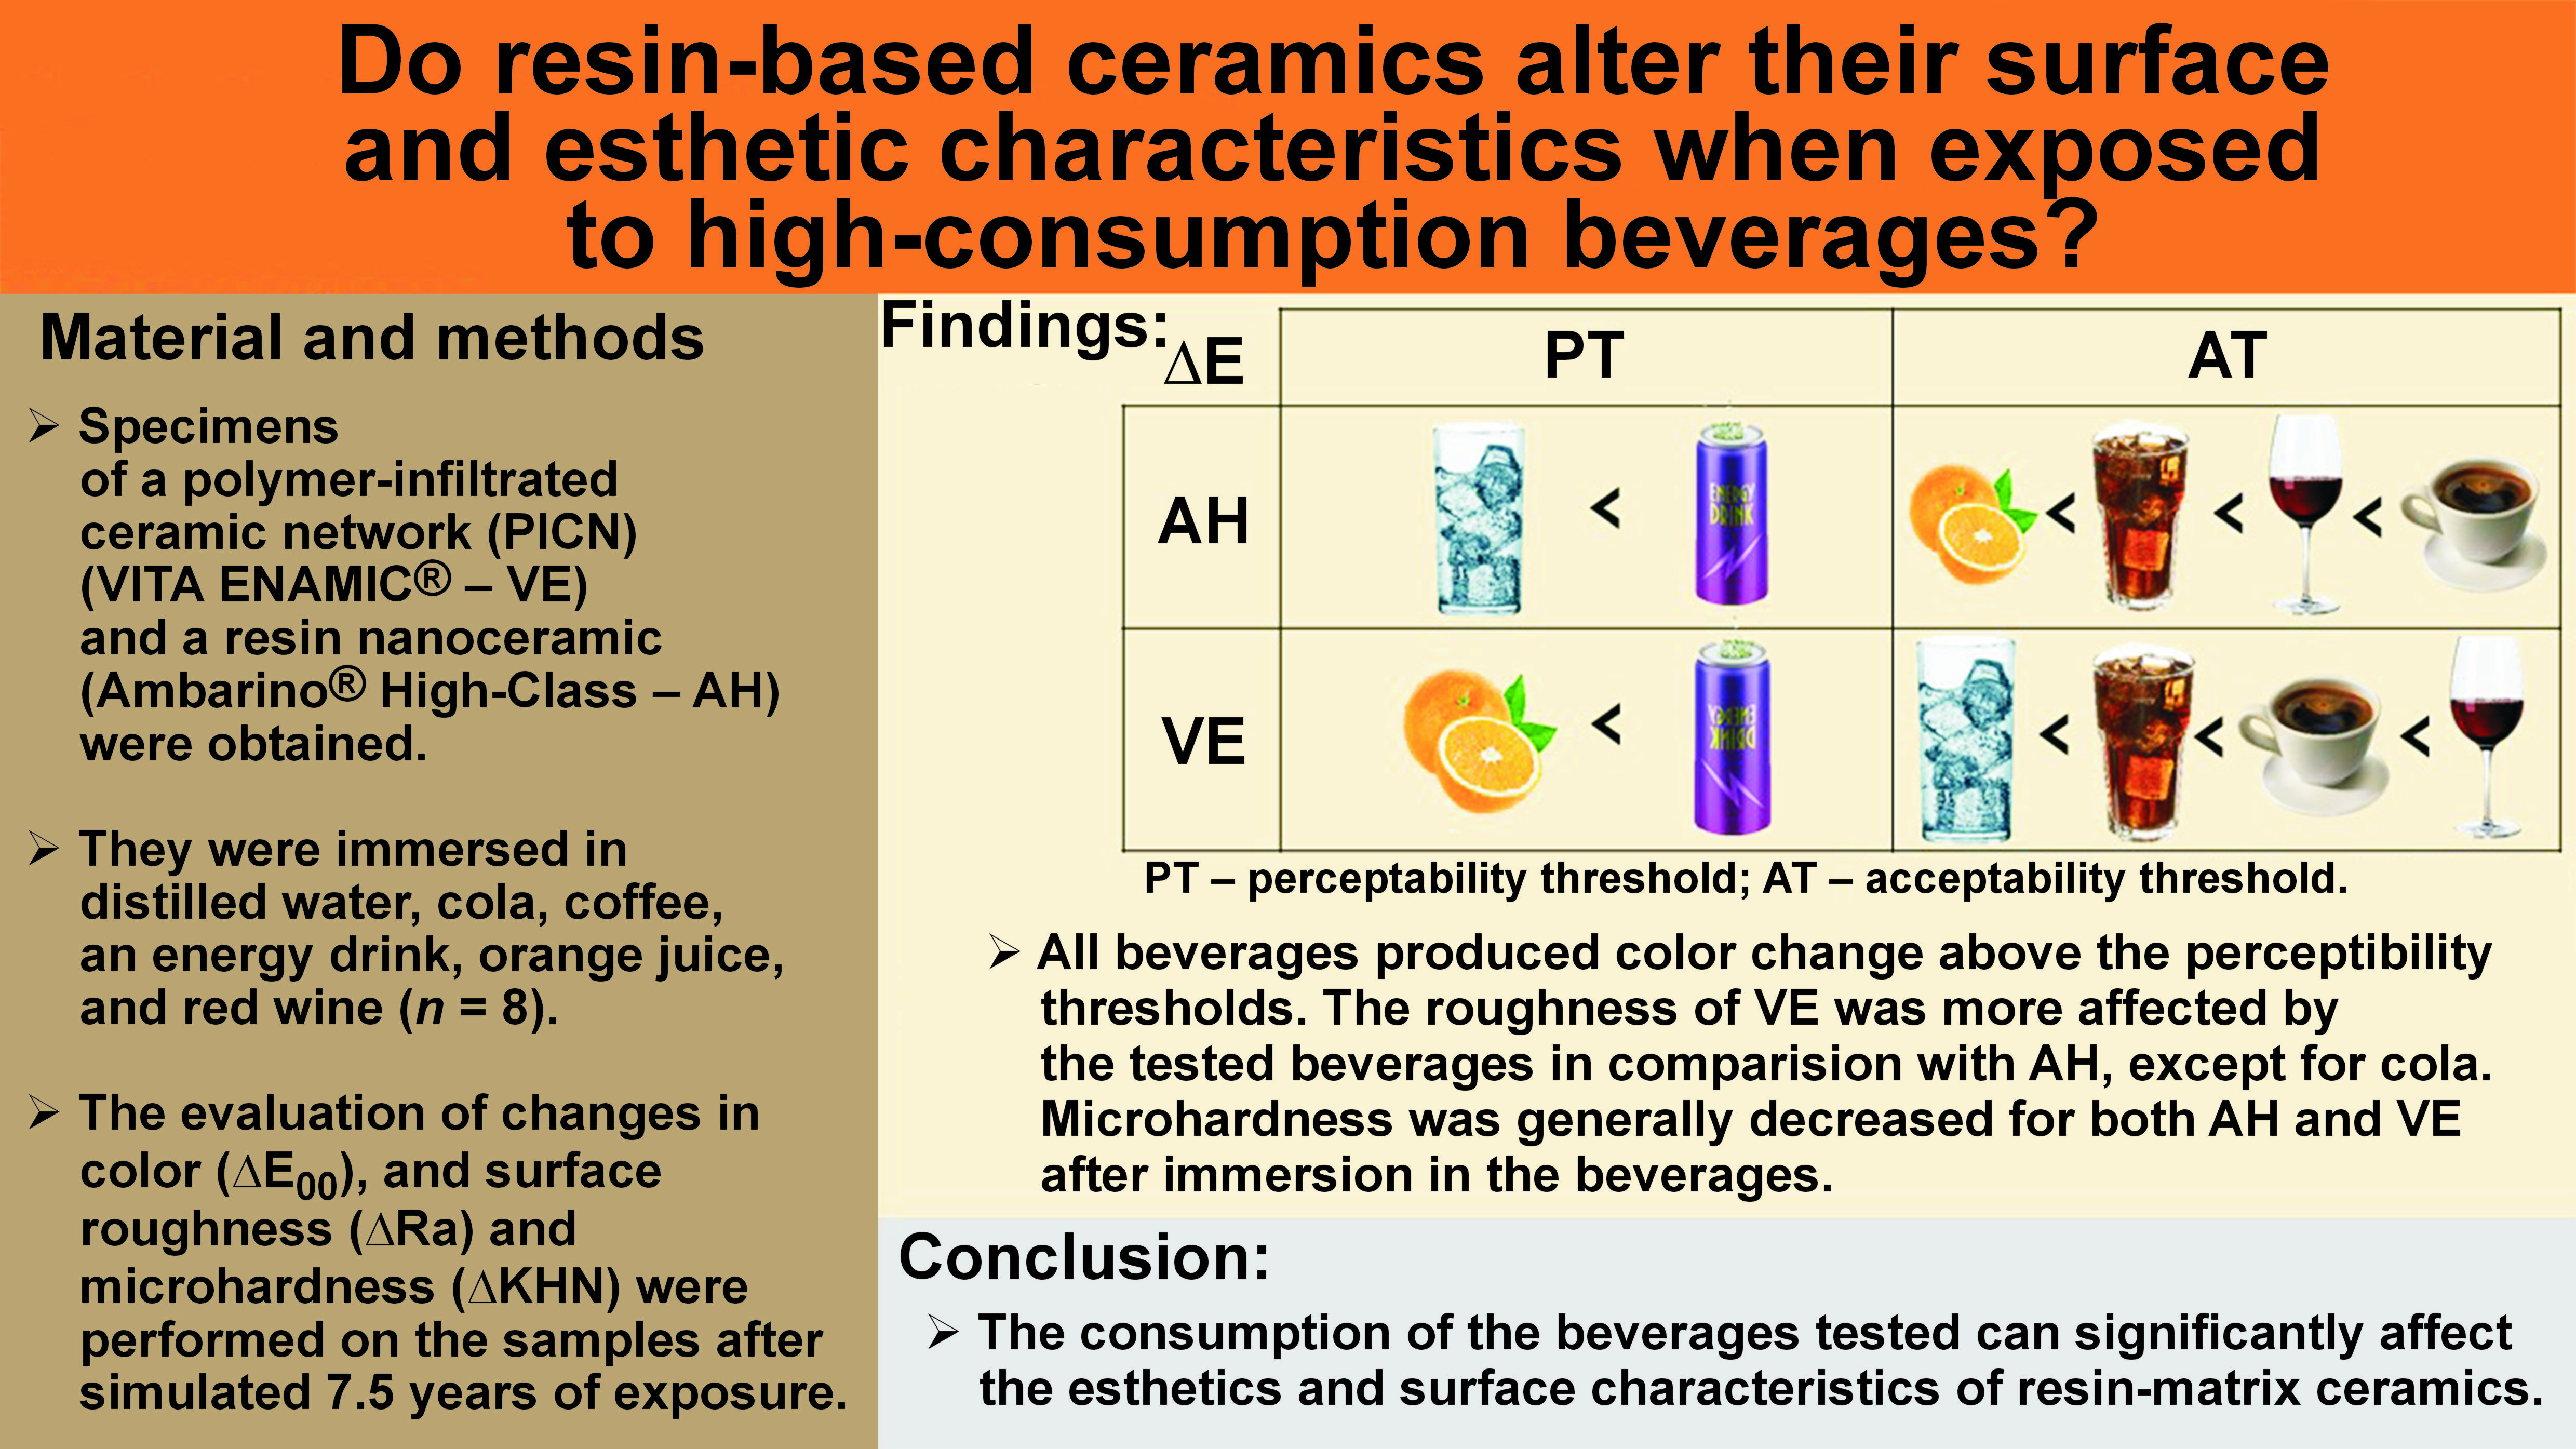
Objectives. The aim of the present study was to evaluate the color stability, and surface roughness and microhardness of a polymer-infiltrated ceramic network (PICN) (VITA ENAMIC® – VE) and a resin nanoceramic (Ambarino® High-Class – AH), used to obtain computer-aided design/computer-aided manufacturing (CAD/CAM) restorations, after immersion in high-consumption beverages.
Material and methods. A total of 96 specimens were prepared (n = 48 per group – VE and AH), further subdivided into 6 groups (n = 8) according to the beverage in which they were immersed. The color change (∆E00), surface roughness (Ra) and microhardness (KHN) measurements were made before and after immersion in the beverages.
Results. The materials presented significant differences in ∆E00 when immersed in distilled water (p = 0.043), coffee (p = 0.010) and red wine (p < 0.001). Acceptable values for ∆E00 were recorded for distilled water and the energy drink with regard to AH, and for the energy drink and orange juice with regard to VE. Regarding the Ra data, the VE samples showed a difference after immersion in all the tested beverages, while AH differed only when immersed in distilled water and the energy drink. Immersion in the beverages seemed to reduce KHN in the tested materials, although significant differences were detected only in the VE samples from the energy drink (p < 0.001) and orange juice (p < 0.001) groups.
Conclusions. Based on the results, it can be concluded that the beverages tested may affect the esthetics and surface characteristics of the materials tested.
Keywords: hardness, color, dental materials, organically modified ceramics
Introduction
The success of any dental material used during the rehabilitation of a missing tooth is directly related to the maintenance of its esthetic and mechanical characteristics over time.1, 2, 3 The oral cavity is an aqueous environment, with variations in pH and the temperature due to the ingestion of different beverages and foods. The materials exposed to such variations can alter their esthetic and mechanical properties. These alterations may occur due to acid substances, which affect the surface morphology of the material, or through the accumulation of pigment; such factors are described as extrinsic.1, 3 Also, the intrinsic characteristics of the material may lead to the failure of the restoration.1, 3, 4, 5, 6 Given a high demand from patients for biomimetic dental restorative materials, ceramics and composites have been questioned with regard to the maintenance of their properties for a long time.6, 7 Color or surface changes can limit the esthetics and longevity of restorations.3
The use of ceramics and composites has expanded and become routine in dentistry, encompassing direct and indirect application, mainly due to the development of computer-aided design/computer-aided manufacturing (CAD/CAM) systems, which allow the fabrication of high-quality restorations with the various materials available, especially ceramics.7, 8, 9 In an attempt to combine the mechanical properties of composite resin with the esthetic properties of conventional ceramics, resin-matrix ceramics have been introduced into the market for CAD/CAM restorations. They are formed by ceramic particles bonded to methacrylate-based polymeric networks. They have improved flexural strength and adhesion, and their elastic modulus is close to that of dentin.1, 5 Also, they are characterized by lower porosity, lower polymerization shrinkage and greater homogeneity of the material as compared to direct-application composites.8 Research on stress distribution,10, 11 simulation models, as well as mathematical12 or laboratory studies,13 demonstrate that resin-based ceramics present reliability,13 tend to concentrate the occlusal stress in the monolithic crown itself and along the cementation line,11 not showing a significant difference in the intensity of strain on the tooth as compared to traditional ceramics,10 and even in critical situations, e.g. in the case of bruxism, have a good expected clinical performance.12
Nevertheless, the resin matrix can degrade over time,14, 15, 16 when exposed to environmental conditions, such as low pH and variations in the temperature. Due to the degradation of the organic matrix in such conditions, the sorption of some extrinsic pigments have been observed in composites,14 potentially altering the esthetic color characteristics, as well as surface characteristics of the material, such as roughness and hardness.6, 8, 15, 16, 17, 18 The presence of water affects the structural integrity of the polymer, as the swelling of the polymer network is connected with increased distances between the network chains, which reduces the strength of the polymer.5
The stability of the esthetic characteristics of the material, as well as its performance, are affected by the conditions of the oral environment, with the frequent ingestion of certain types of foods and beverages causing pH fluctuations and staining.19 Different types of solutions have been tested; however, studies investigating the color change of the CAD/CAM resin-matrix ceramics immersed in multiple common beverages at same time are scarce.6, 8, 17, 18 The molecular size and absorption properties of these materials are strongly related to change in their color when they are immersed in coffee, and influence their roughness when they are immersed in soft drinks like cola.20 The various compounds present in red wine, such as alcohol and specific stains, may lead to color change in resin-matrix ceramics.6 Tea is another beverage that can induce color change in these materials.6, 21
The exposure of resin-matrix ceramics to the aforementioned beverages can potentially affect their optical and esthetic characteristics. Cola, coffee, energy drinks, fruit juice, and red wine are known to contain various colorants, acids and tannins, which can cause discoloration, and surface roughness and microhardness alterations. Recent reports indicate that beverages such as cola, coffee, energy drinks, fruit juice, and red wine are widely consumed.22, 23 Considering that these beverages are globally prevalent, the present realistic approach adds novelty, as it directly addresses the impact of the beverages typically drunk by people, making the findings more relevant and relatable. The findings of this investigation can inform dental practitioners about the potential risk associated with certain beverages for patients with resin-matrix ceramic restorations. This knowledge can guide recommendations and post-treatment care instructions, ultimately promoting better patient outcomes.
In view of this, the purpose of the present study was to evaluate the effects of immersion of 2 resin-matrix ceramics in high-consumption beverages on their color stability, and surface roughness and microhardness. The null hypothesis of the study was that immersion in different beverages would not influence the stainability of the materials.
Material and methods
A polymer-infiltrated ceramic network (PICN) for CAD/CAM (VITA ENAMIC® (VE); VITA Zahnfabrik, Bad Säckingen, Germany) and a resin nanoceramic for CAD-CAM (Ambarino® High-Class (AH); CREAMED, Marburg, Germany) were evaluated in the present study (Table 1). The sample size calculation was performed with the use of the OpenEpi program (https://www.openepi.com), taking into account the mean difference at a confidence interval (CI) of 95% and power of 80%, based on a previous study that used PICN.6 The color change (∆E00) values obtained for distilled water and cola were used, indicating a minimum required number of 2 samples per group. Considering the amount of material available for this research and the statistical robustness, 8 samples per group were obtained (n = 8).
Sample collection
Blocks for CAD/CAM from the 2 materials were sectioned under irrigation with a slow-speed diamond saw (IsoMet® 1000 Precision Saw; Buehler, Lake Bluff, USA). Forty-eight samples were obtained for each material with dimensions of 6 mm × 5 mm × 1 mm. The samples were polished under water cooling with 320-, 400-, 600-, and 1,200- grit sandpaper for 30 s on each grit. Then, they were immersed in a distilled water ultrasonic bath (Lavadora Ultrassônica Plus; Ecel, Ribeirão Preto, Brazil) for 10 min and gently dried with paper towels.
Staining procedures
The samples of each material were randomly divided into 6 groups (n = 8), according to the beverage used, as described in Table 2. The pH of the beverages was measured using a pH-indicator (PHS-3 BW; BEL Equipamentos Analíticos, Piracicaba, Brazil). Each sample was stored in a 1.5-millilter microtube. The beverages were distributed in the form in which they are commercialized, with the exception of coffee. Coffee was prepared by dissolving 5 g of soluble coffee in 50 mL of boiling distilled water in the proportion recommended by the manufacturer. Each microtube received 1.0 mL of a particular beverage. After dispensing the beverages, the microtubes were stored for 137 h at 37°C and 100% humidity.24 The immersion period corresponded to 7.5 years of exposure, based on the following estimate: 3 coffees per day, multiplied by 1 min of exposure per cup, multiplied by 365 days per year, resulting in 1,095 min of exposure per year.21 After the immersion period, the specimens were washed in distilled water and gently dried with paper towels.
The color, and surface roughness (Ra) and microhardness (KHN) readings were performed at 2 time points – initially and after the immersion period.
Color analysis
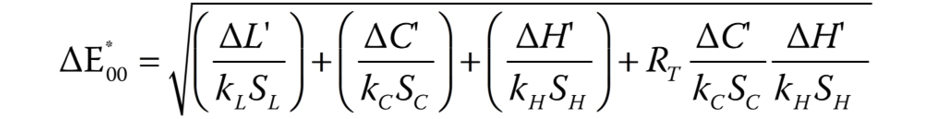
The color data was recorded using the Delta Vista 450G spectrophotometer (Delta Color, São Leopoldo, Brazil), with an opening of 6 mm, directing light at an angle of 10°. The specimens were placed against a standard white background with a D65 illuminant, which represents the spectral distribution of daylight.25 The coordinate data was collected with the use of the i7 Gold 1.0.3.5 software (Delta Color). The color difference (∆E00) is calculated based on the differences in coordinates L*, a* and b*. The L* values indicate luminosity, which ranges from black (0) to white (100). The a* values represent color change from red (+a*) to green (−a*) and b* values represent color change from yellow (+b*) to blue (−b*).24 For this study, the following formula of CIEDE2000 (Commission internationale de l´éclairage (CIE) – the International Commission on Illumination) was used to interpret the coordinates (Equation 1)20, 26, 27:
where ΔL’, ΔC’ and ΔH’ are the differences in luminosity, chroma and hue between the final and initial evaluation, and RT is the function that accounts for the interaction between chroma and hue in the blue spectrum. The SL, SC and SH values refer to the functional balance for luminosity, chroma and hue, and kL, kC and kH are parametric factors according to the visualization parameters, which are fixed at 1.26, 28
Roughness analysis
The evaluation of surface roughness (Ra) was performed using a three-dimensional (3D) confocal laser microscope (LEXT OLS4000; Olympus, Tokyo, Japan), which captured an image with ×5 magnification. The Ra value represents the average difference in the mean height from the mean plane, providing stable results. Scratches, contamination or measurement noise are minimized by using this parameter. The entire digitized surface was analyzed with the use of the microscope software system (Olympus). The mean Ra values were calculated and expressed in micrometers. The variation between the final and initial Ra was calculated as: ΔRa = Raf − Rai.
Microhardness analysis
Surface microhardness (KHN) was measured with a microhardness tester (HMV-2; Shimadzu, Kyoto, Japan), under a load of 50 gf for 15 s and ×40 magnification. The surface of each sample was subjected to 3 Knoop indentations, 1 in the center and 2 in the opposite ends, 1 mm apart from the central region. The mean KHN value was the average of the 3 values obtained on each specimen. The variation between the final and initial KHN was calculated as: ΔKHN = KHNf − KHNi.
Statistical analysis
The obtained data was tabulated, and statistical analysis was performed using the IBM SPSS Statistics for Windows software, v. 20.0 (IBM Corp., Armonk, USA). All data was normally distributed according to the Shapiro–Wilk and Kolmogorov–Smirnov normality tests (p > 0.05). The two-way analysis of variance (ANOVA) with the Bonferroni post-test was used for the statistical analysis of the color stability (ΔE00, ΔL*, Δa*, and Δb*), and surface roughness (ΔRa) and microhardness (ΔKHN) data.
Results
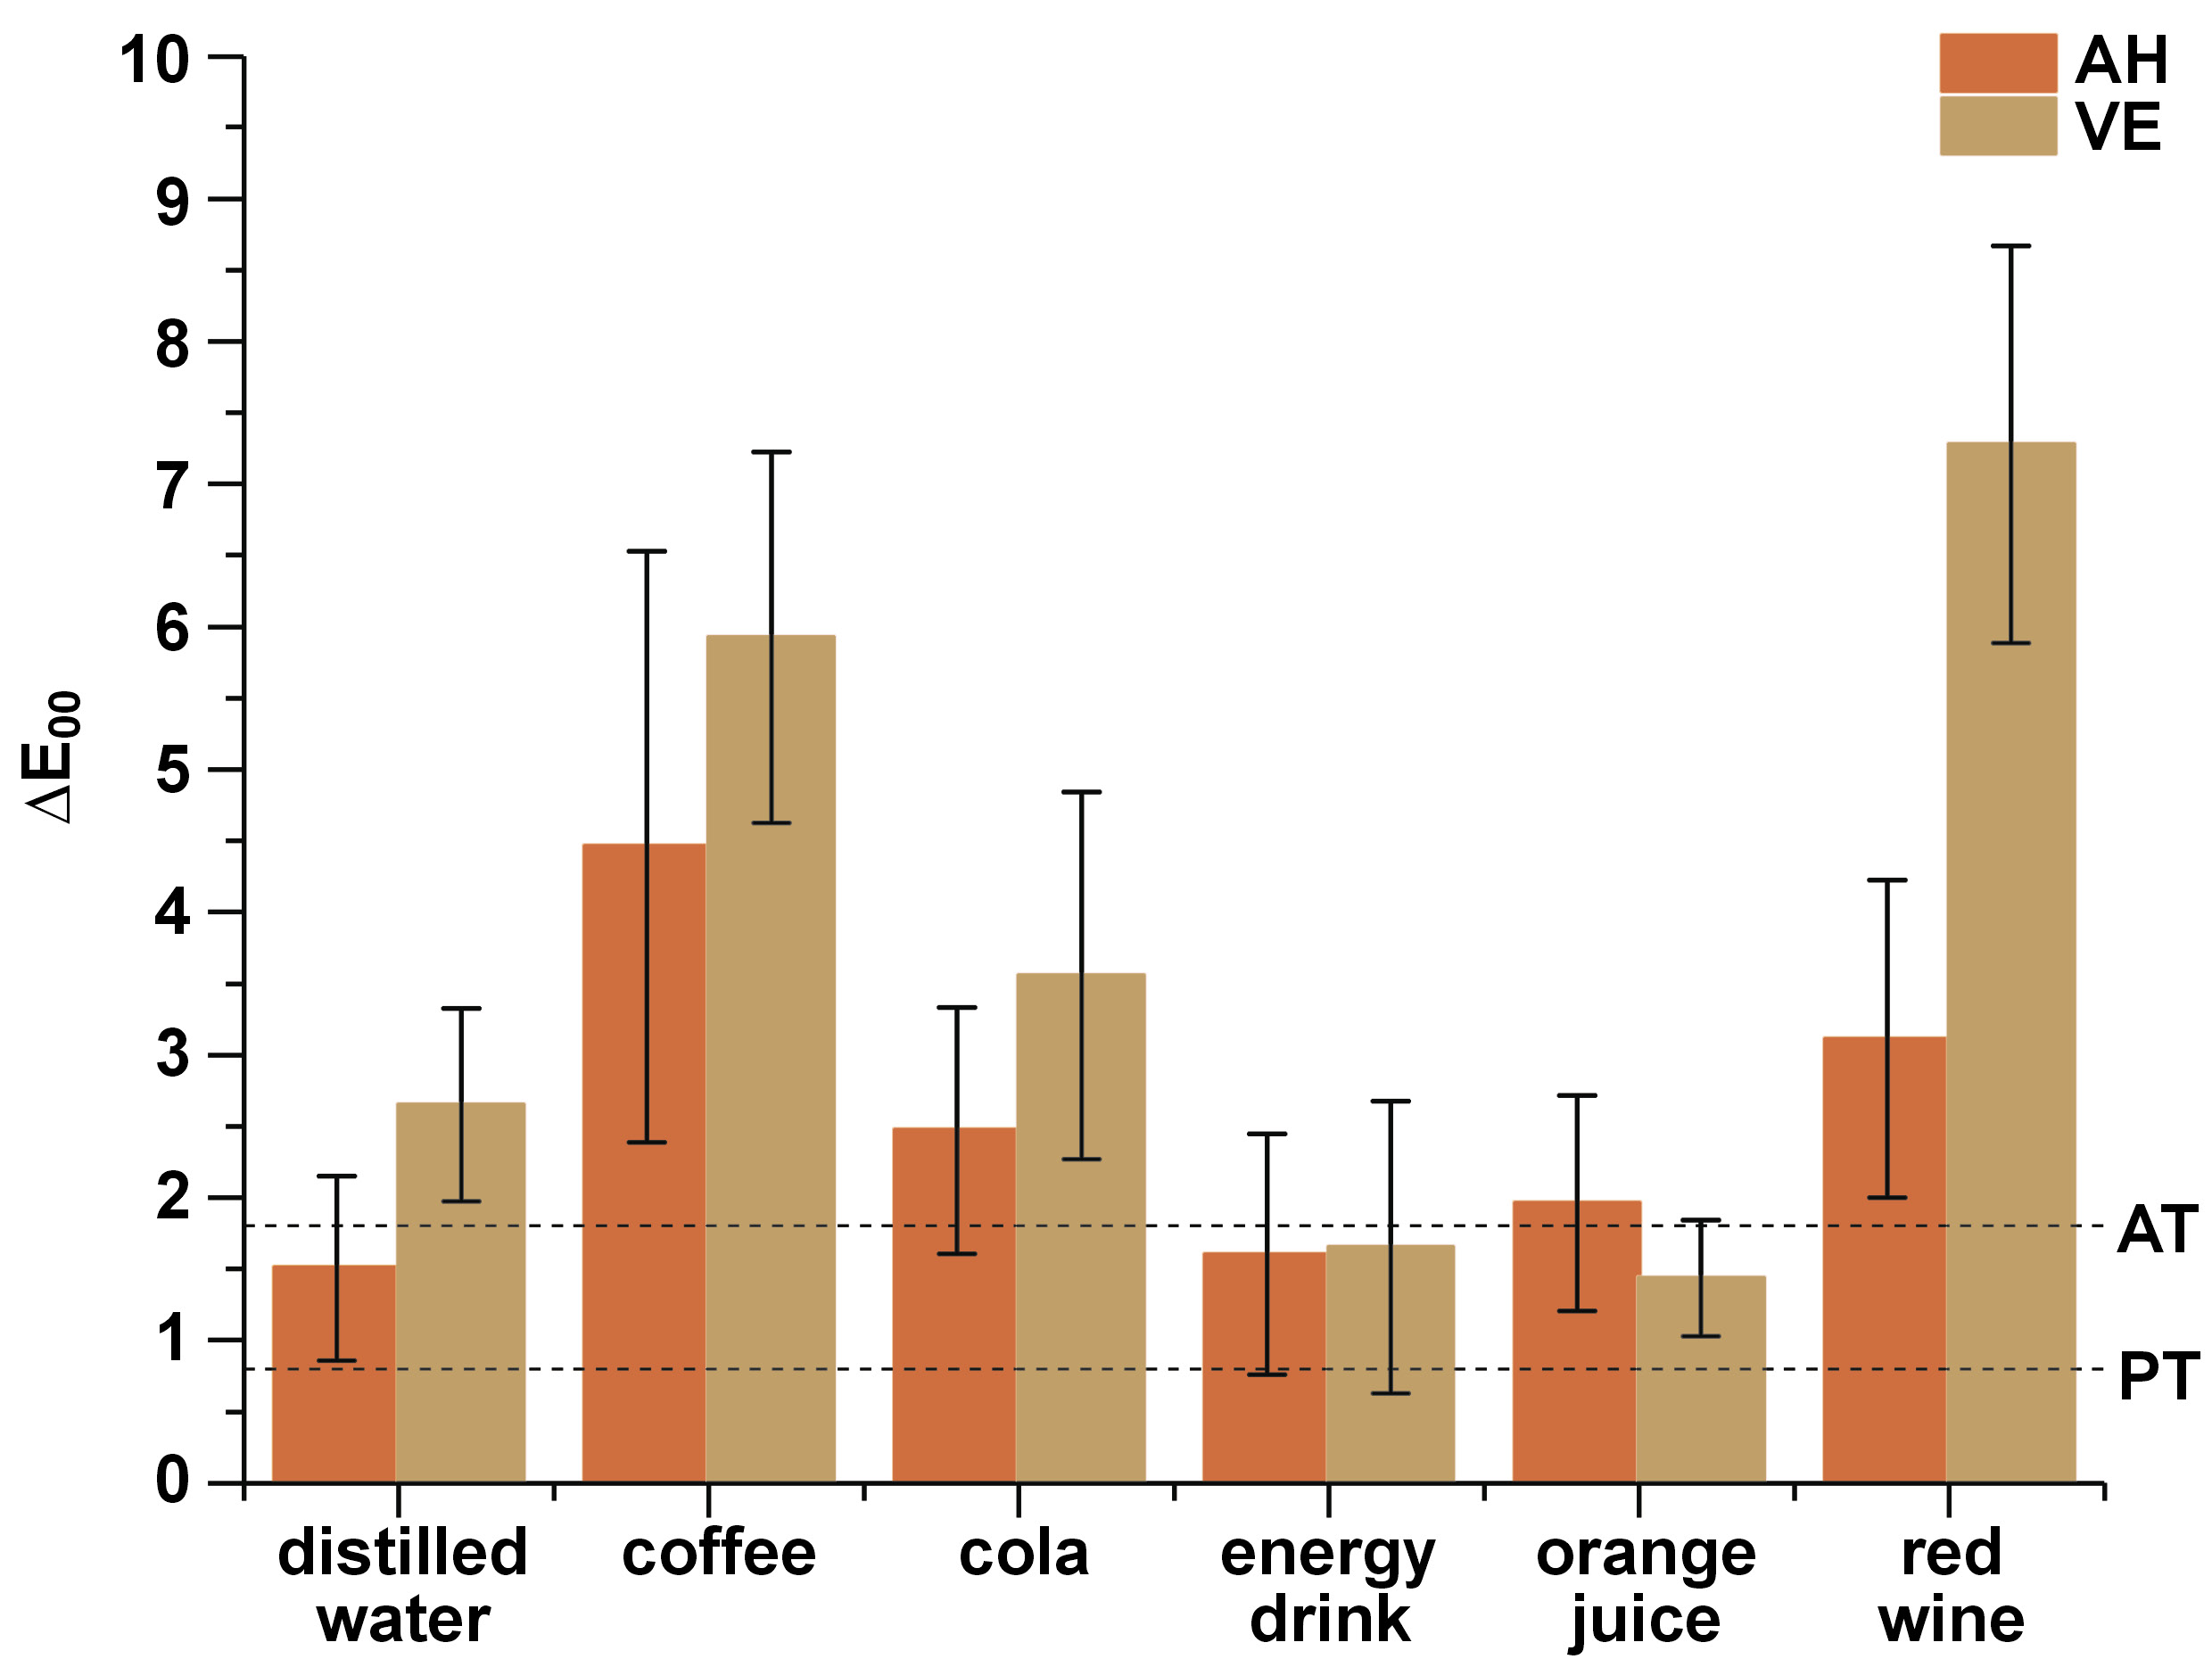
The baseline values for the color coordinates of AH and VE were, respectively, 62.58 and 61.58 for L*, −0.158 and −0.213 for a*, and 6.748 and 9.651 for b*. Table 3 and Figure 1 show the mean values of ∆E00, ∆L*, ∆a*, and ∆b* after immersion in various beverages, with differences between the 2 materials within the same beverage group and between the beverage groups within the same material.
When comparing the materials with regard to the beverage group, there was a difference in ∆E00 for the groups of distilled water (p = 0.043), coffee (p = 0.010) and red wine (p < 0.001). Exploring the coordinates, for the L* coordinate, there was a significant difference between the coffee (p < 0.001) and red wine (p < 0.001) groups. For the a* coordinate, there was a significant difference for the distilled water (p = 0.019), cola (p = 0.017), coffee (p < 0.001), and red wine (p < 0.001) groups, with greater variations presented by VE. For the b* coordinate, there was a significant difference for the cola (p = 0.002), coffee (p = 0.025) and red wine (p = 0.015) groups, with greater variations presented by VE.
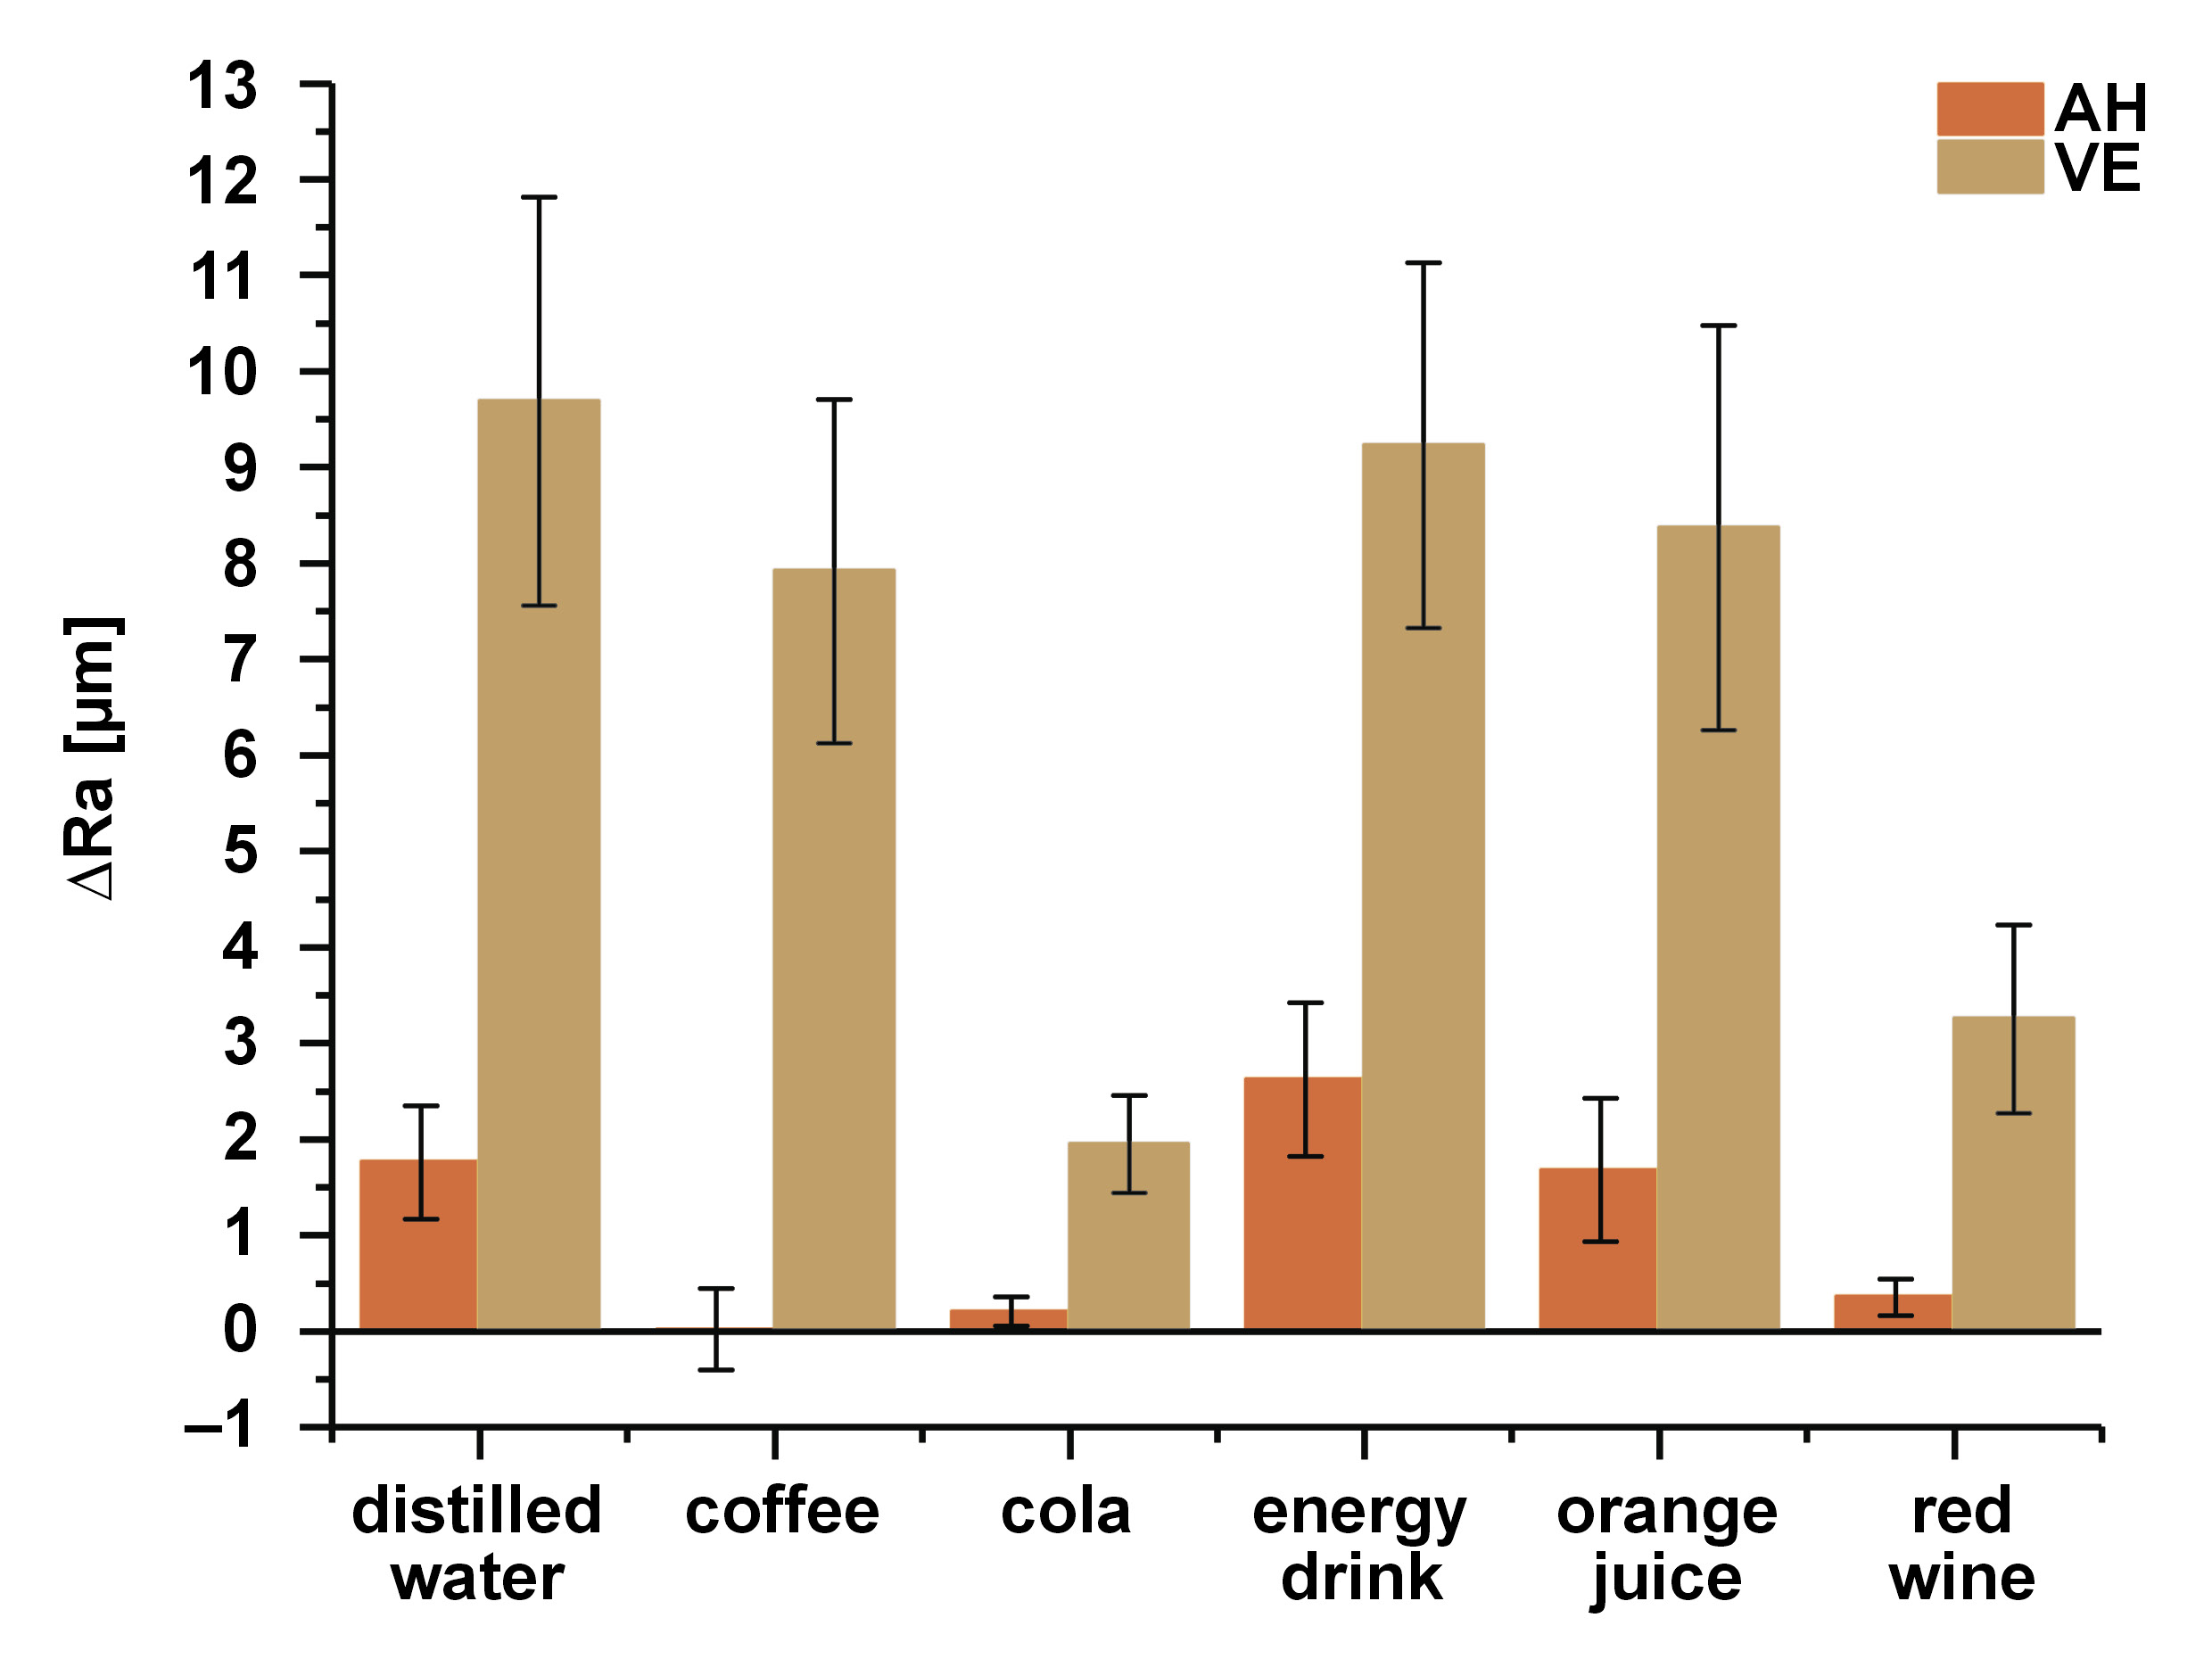
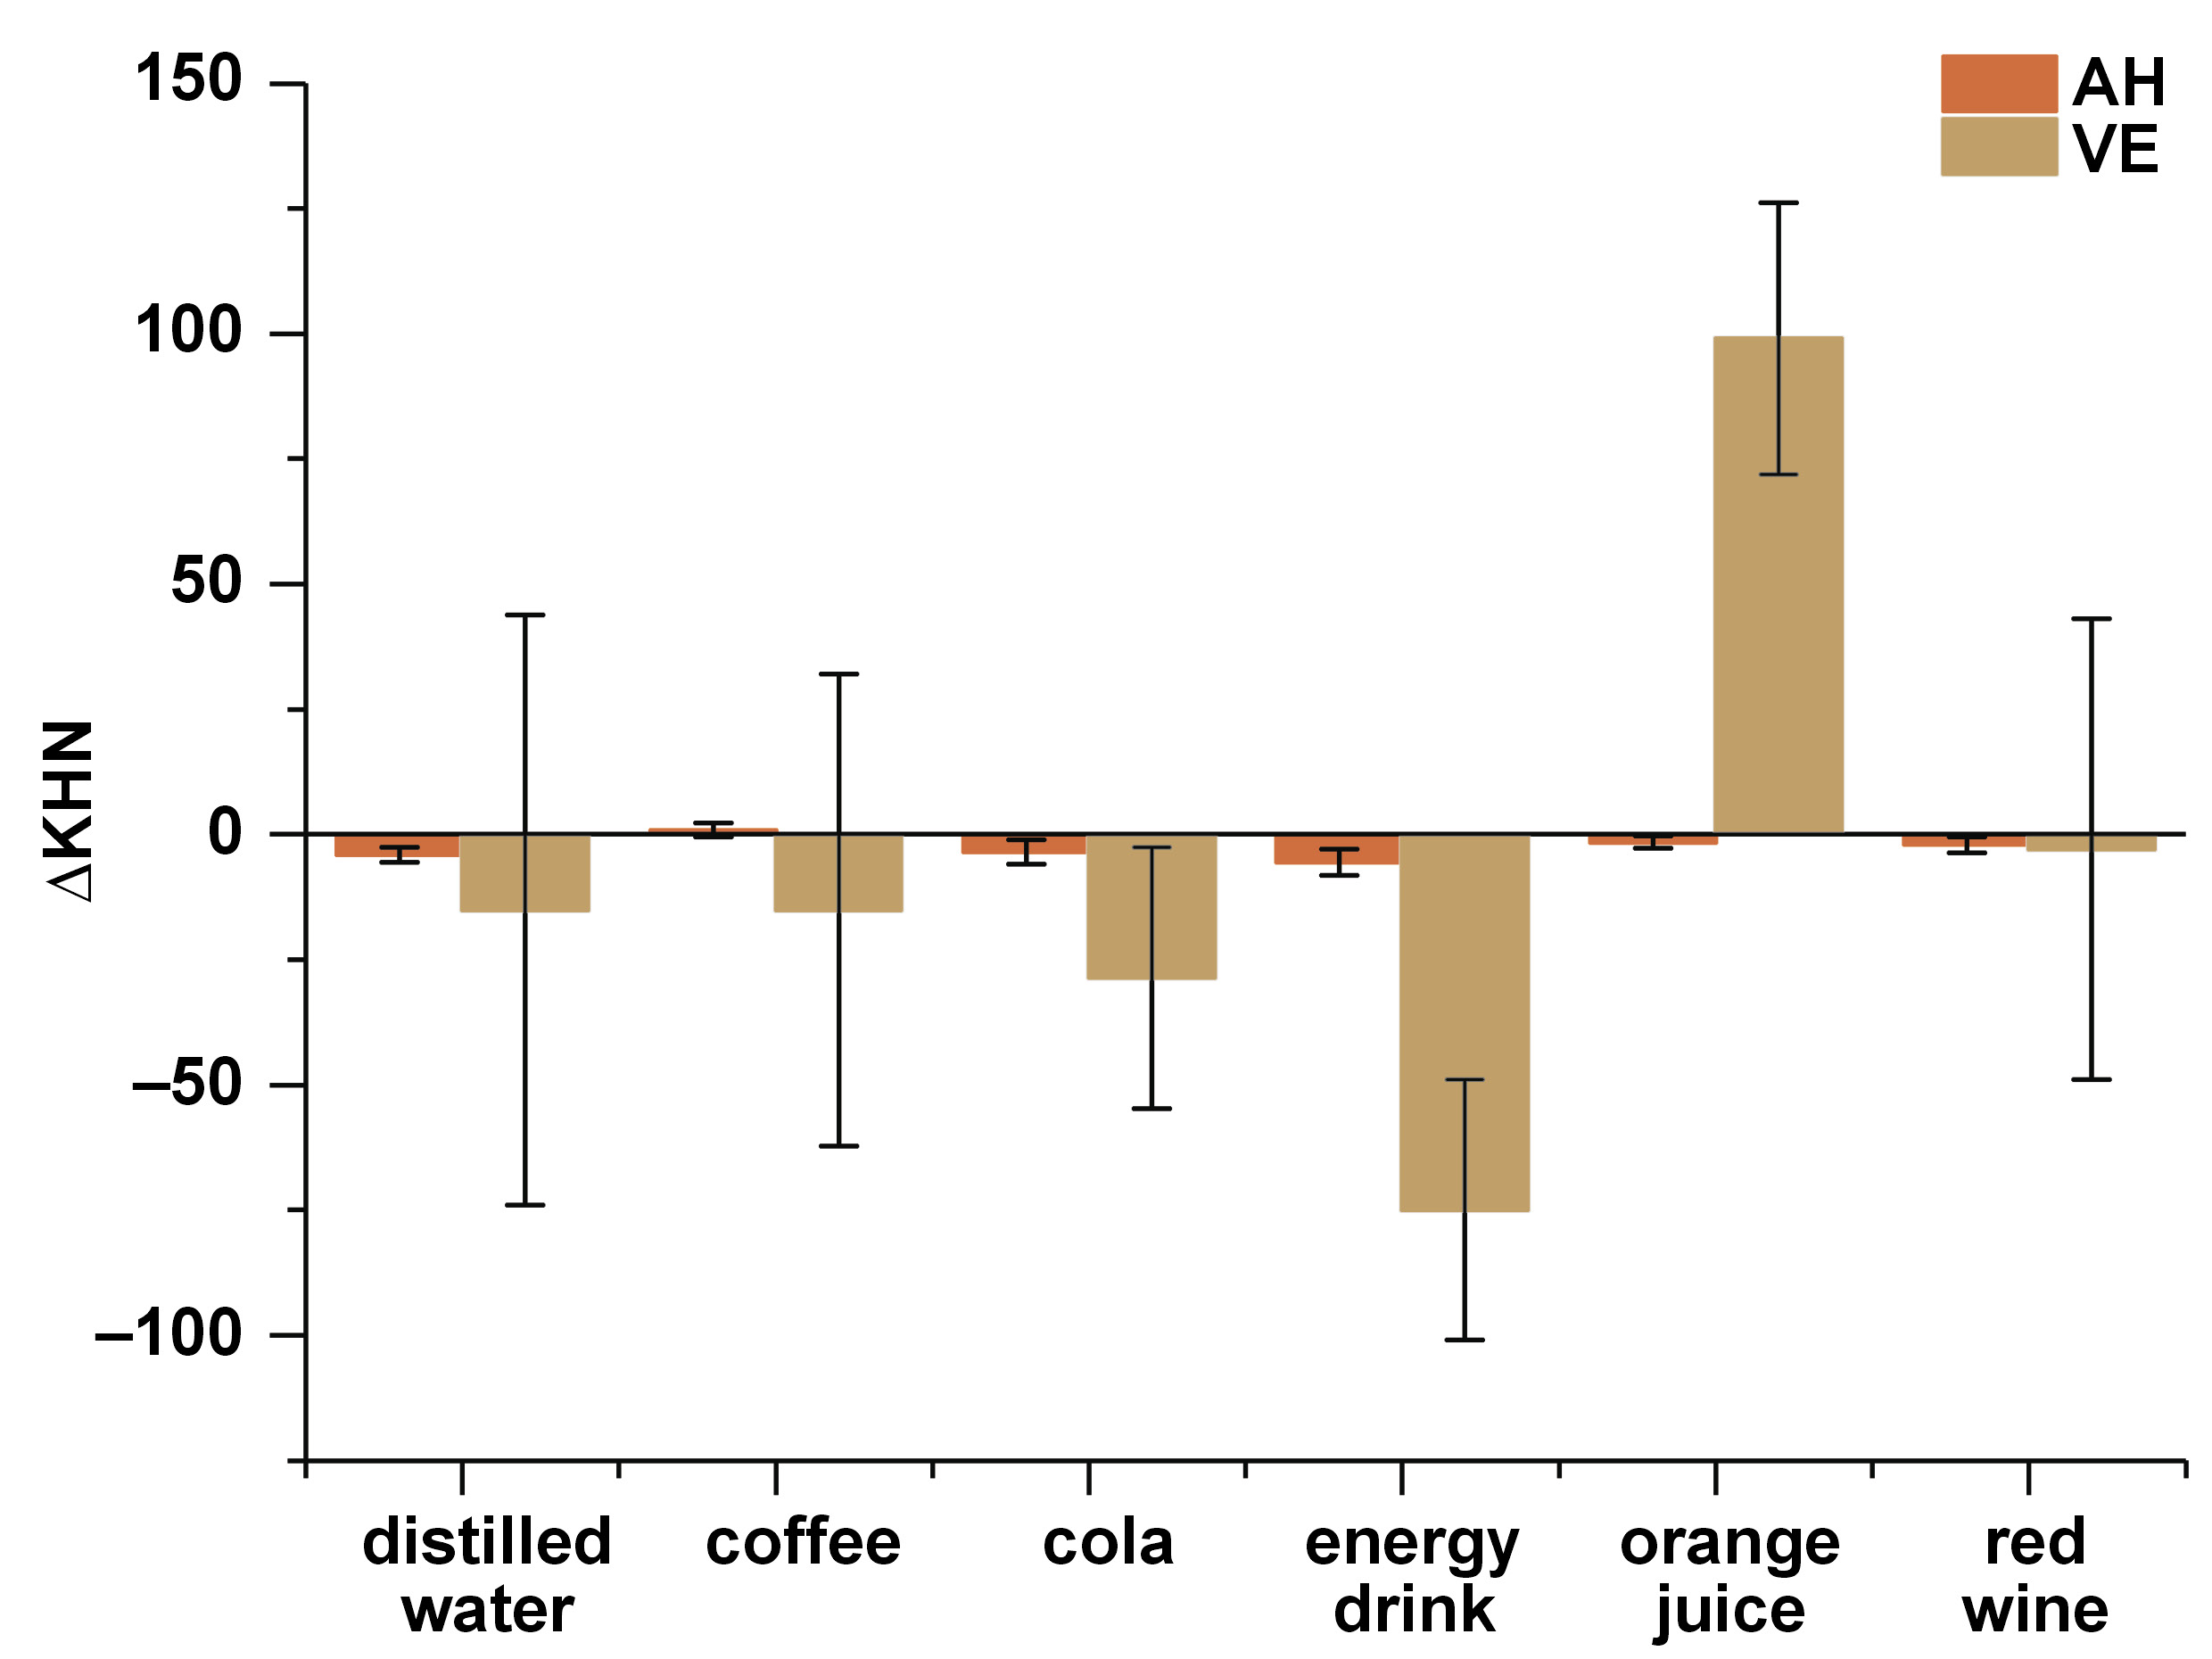
Table 4 shows the mean values of ΔRa and ΔKHN after immersion in various beverages.
The ΔRa results show that AH differed from VE (p < 0.05), except when exposed to cola (p = 0.168) (Figure 2). The type of beverage to which AH was exposed did not seem to influence the ΔRa results, while in the VE group, some differences could be detected between the beverages (immersion in cola and red wine presented a smaller roughness change as compared to other beverages tested): distilled water vs. cola (p < 0.001); distilled water vs. red wine (p < 0.001); coffee vs. cola (p < 0.001); coffee vs. red wine (p = 0.005); the energy drink vs. cola (p < 0.001); the energy drink vs. red wine (p < 0.001), orange juice vs. cola (p < 0.001); and orange juice vs. red wine (p = 0.002).
The ΔKHN results were different between AH and VE when the materials were immersed in the energy drink (p = 0.018) and orange juice (p = 0.001) (Figure 3). Regardless of the type of beverage in which AH was immersed, no significant difference was detected in ΔKHN. However, VE showed differences between the beverage groups (immersion in orange juice presented a greater microhardness change as compared to other beverages tested): distilled water vs. orange juice (p = 0.002); cola vs. orange juice (p < 0.001); coffee vs. orange juice (p = 0.002); the energy drink vs. orange juice (p < 0.001); and red wine vs. orange juice (p = 0.010).
Discussion
The predictability of the esthetics of restorations, even taking into account the possible stains present in the patient’s food, is questioned in any restorative material. The present study evaluated the color, roughness and microhardness changes of PICN (VE) and a resin nanoceramic (AH) after immersion in different beverages that have a recognized staining effect on restorative materials. The null hypothesis of this study was rejected, since the beverages had a significant effect on color, roughness and microhardness change.
Paravina et al. calculated the color difference thresholds related to perceptibility (PT: ∆E00 = 0.8) and acceptability (AT: ∆E00 = 1.8) for ceramic materials under simulated clinical settings,29 with better correlation with the human perception of color differences.30, 31 Using these reference values, ∆E00 for the resin-matrix ceramics tested in the current study exceeded the PT value; however, the resin nanoceramic AH presented acceptable values for the samples immersed in distilled water and the energy drink, and the PICN VE presented acceptable values for the energy drink and orange juice groups. The other immersion solutions produced ∆E00 values above the limits of acceptability after simulating 7.5 years of exposure.
The type of matrix influences the color stability of the resin-matrix ceramic, as it affects water sorption.1, 2 The fraction of polymers in the resin matrix is not directly correlated to ∆E00, which can be better explained by the characteristics of the monomers present in the resin matrix composition.3 Materials with greater hydrophilicity are susceptible to staining.2 VE is composed of hydrophobic urethane dimetacrylate (UDMA) and triethylene glycol dimethacrylate (TEGMA). The TEGMA present in the VE composition possibly causes an increase in water sorption by the material, which brings hydrophilic dyes to the resin matrix.1, 17, 32 Dimethacrylates form cross-linked networks with the unreacted monomers, acting as plasticizers along the polymeric network, leaving the structure open and facilitating sorption.1, 5 In addition, the polymeric matrix, when degraded, exposes the ceramic network, creating a surface more prone to the accumulation of stains.6
Another monomer, bisphenol A-glycidyl methacrylate (bis-GMA) present in the AH composition, can also trigger the same pigmentation mechanism in the polymeric matrix,3 exhibiting more hydrophilicity and water sorption than other monomers found in the composition of the resin-matrix ceramics tested in this study.3, 6, 17, 33, 34 If a polymer can absorb water, it can also absorb water-soluble pigments.8 However, the combination of monomers and the amounts used possibly affected the color stability of the resin-matrix ceramics and their ability to resist staining, since AH showed lower ∆E00 values in almost all the tested solutions as compared to VE. According to the manufacturers, AH has 30% by weight of the resin matrix, while VE has 14%. Even with a greater amount of polymers in its composition, AH showed lower values of ∆E00, which suggests that the combination and amounts of the monomers used for the AH resin matrix resulted in less pronounced sorption and embedding of water-soluble pigments as compared to the VE resin matrix.
In previous studies evaluating the color stability of a material, beverages such as coffee and red wine were usually chosen as the staining solutions.9, 14, 17, 35 In the present study, in addition to coffee and red wine, solutions such as cola, the energy drink and orange juice were included because of their large consumption, and distilled water was used for comparison.18 Due to phenolic components, such as tannins and anthocyanins, red wine has an effect on the color of restorations,3, 6 potentiated by ethanol and low pH, which cause the degradation of the resin matrix, its penetration and the absorption of colorants.6 The acidic and alcoholic properties of red wine generate an increase in Ra and alterations in the surface topography.14 The bipolar molecule of ethanol can facilitate the solubilization of hydrophilic or hydrophobic components, thus softening and decomposing the resin matrix.3 In this study, red wine caused ∆E00 above the AT value (∆E00 > 1.8), mainly in the VE group. When ∆Ra was evaluated after exposure to red wine, VE showed a greater increase than AH. This can be explained by the fact that VE has monomers in its resin matrix composition that are more hydrophilic than the monomers present in the AH resin matrix. With regard to KHN, the exposure of AH and VE to red wine did not provide statistically different results, decreasing the parameter in both groups.
Methacrylate-based materials are more susceptible to staining when exposed to coffee because of the absorption of dyes, which probably occurs due to the affinity of the polymer network to the coffee yellow stain molecules of low polarity.1, 2, 8 The results of the b* coordinate analysis show that the coffee group, when compared to distilled water, demonstrated an increase in the saturation of the yellow chroma, and AH had better resistance to staining. Coffee is naturally acidic, containing about 22 types of acid, including citric, oxalic and malic acids. When consumed, it causes chemical erosion on the surface of the resin-matrix ceramic.6 VE is composed of a ceramic network infiltrated by a polymeric matrix, which is exposed by the hydrolysis of the methacrylate ester bonds in the resin matrix36 when submitted to acid erosion, leading to a rougher surface than in the case of AH; the latter material presented a lower ∆Ra value and better resistance to staining after exposure to coffee in this study. On the other hand, water-soluble anthocyanins responsible for the red color of wine are more polar pigments than the yellow pigments of coffee, penetrating the polymeric network deeper.1 Nevertheless, red wine caused greater alterations relative to the a* coordinate in the resin-matrix ceramic VE.
Rough surfaces affect the reflection of light on the material, generating a pattern of diffused and irregular reflection, and consequently impacting the color and appearance of the restoration.36 Another property that influences the esthetics of a restoration is translucency. It depends on the thickness and superficial roughness of the material used.3, 6 In this study, immersion in the solutions did not affect the Ra of AH, while VE showed altered values for the coffee, energy drink, orange juice, and red wine groups. VE is a material that has a polymeric matrix associated with a ceramic network based on the feldspar ceramic particles. As the matrix degrades due to low pH and hydrolysis, ceramic particles can be exposed or detached, increasing Ra.6 Greater Ra favors the deposition of pigments on the material surface, decreasing brightness, and consequently increasing ∆E00.6, 14 The increased Ra of VE may also be related to the ∆E00 found.
The highest sorption values are found in the materials immersed in solutions with pH between 4 and 6.1 Sorption influences the degradation14 and staining of the polymeric matrix.1, 3 In the evaluated beverages, only coffee has pH in this range, which can explain the ∆E00 results for the AH and VE samples immersed in coffee. Alnasser et al. demonstrated in a previous study the effect of pH on a resin-matrix ceramic, where a significant increase in Ra was observed after immersion in an acidic solution (pH 2.0).36 In the present study, cola, coffee, the energy drink, orange juice, and red wine with their acidic pH showed increased Ra, but the solutions apparently had the most powerful effect on the Ra of VE, with significant differences noted for all experimental groups, except cola, when compared to AH, suggesting that the VE resin matrix is more susceptible to the changes caused by exposure to the tested solutions than AH. The control group (distilled water) in the VE samples also showed an increase in Ra, which could be related to the hydrophilicity of the polymeric matrix. However, further analysis would be necessary to state this with absolute certainty.
The literature shows decreased microhardness after thermocycling,7, 15, 37 and exposure to acidic media16, 38 and high-consumption beverages with low pH.1, 39 The results of this study show that cola, coffee, the energy drink, and red wine generally decreased KHN in both material groups, highlighting the decrease found in VE when immersed in the energy drink. However, orange juice showed decreased KHN in AH and increased KHN in VE. According to the information provided by the manufacturer, VE is a material with particles of feldspatic ceramics in its composition, besides SiO2, NaO2 and K2O in the matrix mainly composed of UDMA.1 When the UDMA matrix degrades, feldspatic ceramic particles can be exposed. The Knoop diamond penetrator used in the hardness test has a long, diagonal shape, which in view of the exposure of the particles due to the degradation of the polymeric matrix, could have influenced the results obtained in this study by affecting the complete penetration of the indentation into the surface of VE.
The Ra of the material is important in terms of the patient’s comfort and reducing the formation of surface fractures, which is often achieved by applying a glaze layer.40 The application of a glaze layer also favors the maintainance of color stability, even in the conventional glass ceramics when immersed in the staining solutions.24 In resin-matrix ceramics, stain covers give a better effect with regard to appearance and gloss, which are retained by a glaze layer.41, 42 The finishing systems are based on the application of photoactivatable stain covers and glazing, from the acid-etching or sandblasting of the surface to its silanization.41, 43 As an alternative to glazing, the creation of a smoother surface can also be achieved by polishing.32 However, the polishing and finishing systems chosen can affect the absorption of water by resin-matrix materials,44 which might affect color stability by the absortion of water-soluble pigments. Still, it appears to be a viable alternative to extrinsic stain removal.5 In this study, no surface finishing system was applied to the samples of any material. Thus, the samples might have been more susceptible to color and surface roughness changes. An issue to be highlighted is the possibility of the light-curing of the stain or performing effective polishing on the surface of a resin-ased ceramic in the chairside method.
The limitations of this study can be attributed to the fact that in the oral environment, the materials, while being exposed to different pigments, are also aided by the salivary flow, which dilutes the concentration of these pigments and has the buffer effect, which was not simulated in the experimental model used. Toothbrushing and restoration surfaces can prevent surface staining, but toothbrushing was not simulated in this study, probably affecting the results.34
There is still scope for future studies using aging methods, and the specific finishing and glazing systems. These methods can be combined with immersion in high-consumption beverages and toothbrushing to better understand the color change behavior of these materials. Specific studies for the monomers used in the resin-based matrix and their properties when combined could also be useful in the improvement and development of these materials. The use of scanning electron microscopy (SEM) could have solved some questions that occurred during the realization of this study. Images from this type of microscopy could provide a better understanding of the bonding of the resin matrix to the filler particles in the materials tested and the particle size of each material. In addition to a surface analysis that could point to different surface effects for each beverage, future studies using SEM must be conducted.
Conclusions
Based on the results, it can be concluded that the consumption of the beverages tested, given their low pH and the pigments they contain, may significantly affect the esthetics and surface characteristics of the resin-matrix ceramics tested, including their color, roughness and microhardness. Minimizing exposure to these beverages, along with good cleaning conduct during toothbrushing, should be considered whenever these materials are chosen for dental rehabilitation to minimize adverse effects and maintain the restoration with no need for substitutions over time.
Ethics approval and consent to participate
Not applicable.
Data availability
The datasets supporting the findings of the current study are available from the corresponding author on reasonable request.
Consent for publication
Not applicable.
Use of AI and AI-assisted technologies
Not applicable.