Abstract
Background. Facial characteristics are determined by the thickness of facial soft tissue and parameters of the dentoskeletal system.
Objectives. The aim of the study was to compare the soft tissue thickness in individuals with different malocclusions, based on their lateral cephalograms.
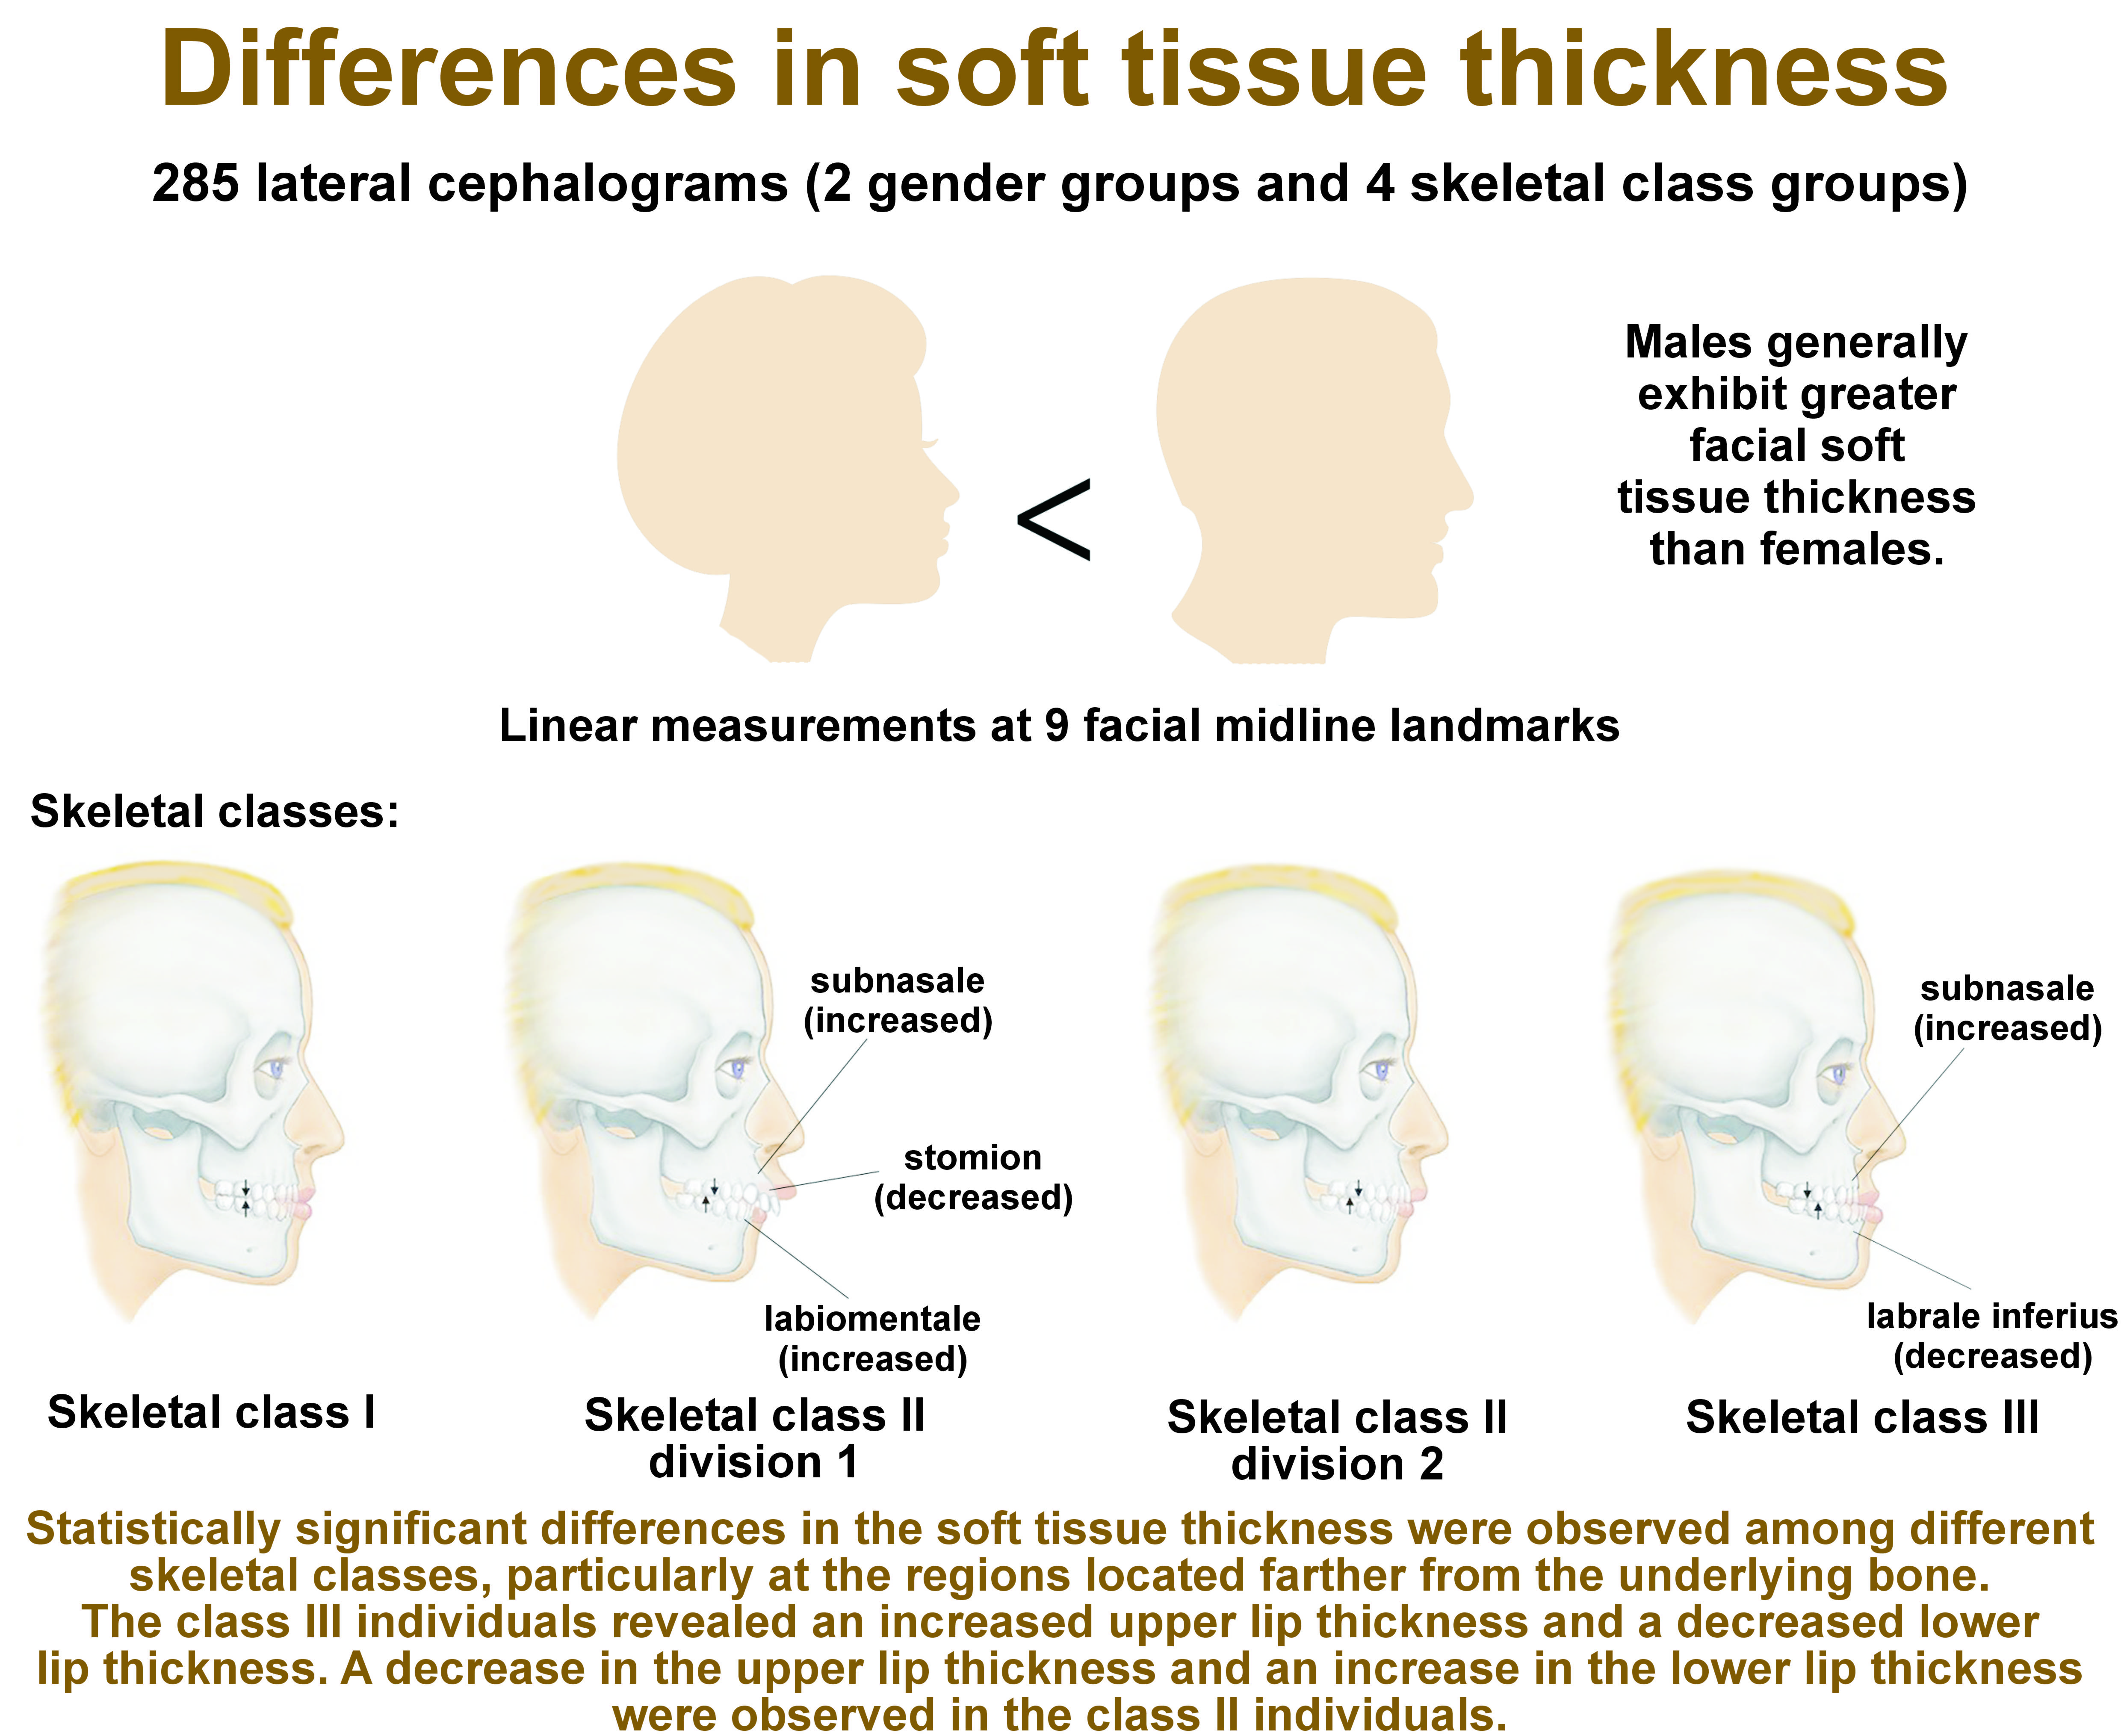
Material and methods. In this retrospective study, 285 lateral cephalograms of 141 males and 144 females aged between 18 and 40 years were evaluated in the following 4 groups of malocclusions: class I (n = 72); class II division 1 (n = 71); class II division 2 (n = 72); and class III (n = 70). Linear measurements of the soft tissue thickness were obtained at 9 facial midline landmarks. Angular measurements were made by calculating the ANB angle and the inclination angle of upper central incisors. The data was statistically analyzed using the χ2 test, the Shapiro-Wilk test, the t-test, analysis of variance (ANOVA), Tukey’s test, and Pearson’s correlation.
Results. A comparison of the soft tissue thickness revealed that male subjects demonstrated greater thickness than female subjects. This difference was statistically significant at all points in the skeletal class III individuals (p < 0.05). Different skeletal classes demonstrated significant differences in the soft tissue thickness at the subnasale, stomion, labrale inferius, labiomentale, and menton (p < 0.05).
Conclusions. Males exhibited a greater facial soft tissue thickness than females. A statistically significant difference in the soft tissue thickness was observed among the different skeletal classes, particularly at regions located farther from the underlying bone. The class III individuals revealed an increased upper lip thickness and a decreased lower lip thickness. A decrease in the upper lip thickness and an increase in the lower lip thickness were observed in the class II individuals. This pattern suggests that the underlying skeletal discrepancy is being concealed.
Keywords: malocclusion, soft tissue, cephalometry, thickness
Introduction
In orthodontics, patients are typically classified into 3 distinct categories (class I, II and III) based on the skeletal relationship between the maxilla and mandible.1 Discrepancies in this relationship can lead to a convex or concave facial profile. The facial profile does not always correspond to the skeletal profile due to variations in the soft tissue thickness among individuals. The assessment of facial appearance and profile must take into account the soft tissue and its impact on facial appearance. Thus, it is imperative to identify the standard pattern of the soft tissue thickness in different skeletal classes for each population, taking into account variations in anthropometric indices.2
As the importance of facial profile in orthodontic treatment has increased, the gold standard of orthodontic treatment results has undergone a gradual shift from hard tissue standards to soft tissue norms. Thus, finding the standard pattern and paradigm of the soft tissue thickness in different populations and racial groups can be of great significance.3, 4
Several studies worldwide have attempted to obtain a specific paradigm regarding the mean soft tissue thickness in different populations. This subject has been previously explored by Perović and Blažej4 in Serbia and Sarilita et al.5 in Indonesia. However, to date, no studies on the topic have been conducted on the Iranian population. A comprehensive understanding of soft tissue thickness patterns across different skeletal classes would facilitate enhanced aesthetic outcomes for orthodontists.
Objectives
Orthodontists unanimously agree that facial aesthetics, oral function, and the mobility of the jaws and teeth are primarily influenced by the soft tissue thickness. Altered soft tissue thickness can directly affect the treatment plan and selection of surgical or non-surgical, and extraction or non-extraction orthodontic treatment plans. Additionally, the soft tissue thickness is important in the camouflage orthodontic treatment of many patients. The understanding of the precise pattern of the soft tissue thickness is crucial in facial reconstructions, particularly in relation to the remaining hard tissue. This knowledge could also aid in forensic medicine investigations. In face-driven orthodontics, the interplay between the face and the temporomandibular joint (TMJ) is instrumental in achieving optimal orthodontic outcomes. In consideration of the aforementioned factors, the objective of this study was to compare the soft tissue thickness in individuals with different malocclusions as determined by lateral cephalograms.
Material and methods
Study design
This retrospective study was conducted on 285 lateral cephalograms of 141 males and 144 females retrieved from the archives of a maxillofacial radiology center at Parto Maxillofacial Specialty Clinic, Qazvin, Iran. The study was approved by the Ethics Committee of Qazvin University of Medical Sciences, Iran (IR.QUMS.REC.1401.197).
Linear measurements of the soft tissue thickness were made at 9 facial midline landmarks. Angular measurements were obtained by calculating the ANB angle and the inclination angle of upper central incisors. The mean thickness of the facial soft tissue was evaluated for each group.
Setting
All lateral cephalograms were obtained using the Cranex® 3D X-ray system (Soredex, Tuusula, Finland), which utilizes a protective filter with a thickness equivalent to 2.7 mm of aluminum. The exposure settings were 73 kV, 10 mA, and a 165-cm distance from the tube. The patient’s head was in its natural position and fixed by the cephalostat. The tube exhibited a 90° angle relative to the sagittal plane, and the Frankfurt plane was parallel to the horizon. The lips were relaxed, while the teeth demonstrated centric occlusion. All patients underwent a precise radiographic evaluation, and their skeletal and soft tissue profiles were analyzed using lateral cephalograms.
Participants
The inclusion criteria were lateral cephalograms of males and females aged 18–40 years, and availability of complete demographic information of participants. The lateral cephalograms had been obtained for purposes not related to this study, such as orthodontic treatment planning. The exclusion criteria encompassed developmental and congenital anomalies, mixed dentition, a history of maxillofacial trauma, a history of orthodontic treatment or cosmetic procedures, and cephalograms with distortion.
Variables
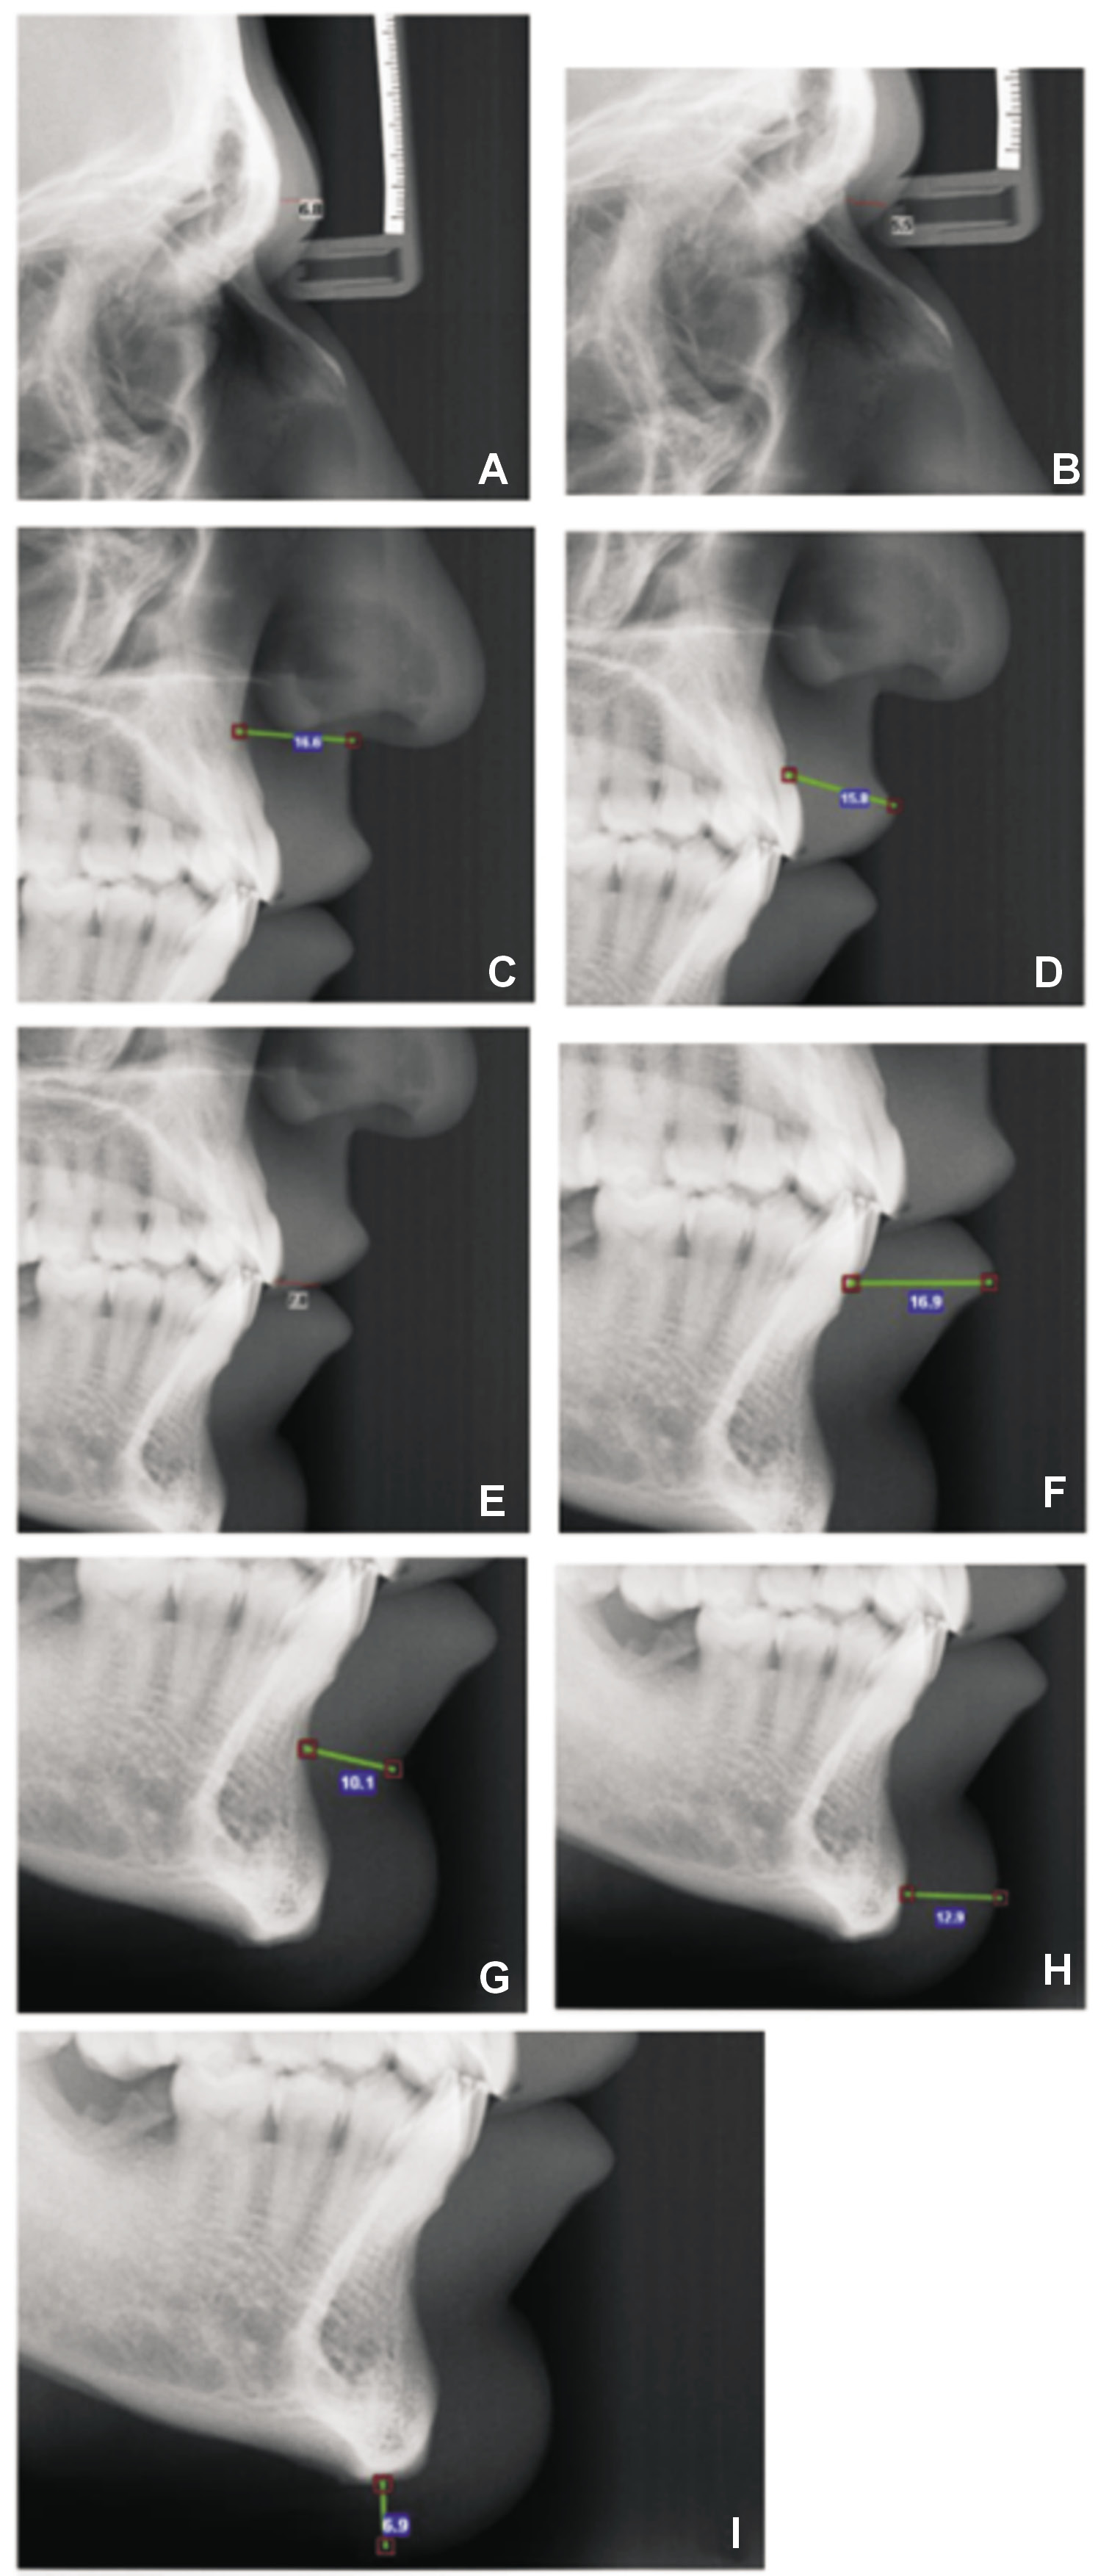
The lateral cephalograms were traced, and 9 hard tissue anatomical landmarks and their corresponding soft tissue analogs were identified according to the literature.1, 4, 5, 6, 7, 8, 9, 10 The landmarks were as follows:
– G–G’-1: glabella region, defined as the linear distance between point G (most prominent point of the frontal bone) and its corresponding soft tissue analog point (Figure 1A);
– N–N’: nasion region, defined as the linear distance between point N and its soft tissue analog point (at the fusion of frontal and nasal bones) (Figure 1B);
– A–Sn: subnasale region, defined as the distance between point A (most concave point of the maxilla) and the subnasale (Sn) (Figure 1C);
– Pr–Ls: distance between the prosthion (Pr) and the upper lip surface (labrale superius (Ls)) (Figure 1D);
– J–St: distance between point J (most labial point of upper incisors) and the contact point of the upper and lower lips (stomion (St)) (Figure 1E);
– Id–Li: distance between the infradentale (Id) (most anterior and superior point on the alveolar ridge between lower central incisors) and the lower lip surface (labrale inferius (Li)) (Figure 1F);
– B–B’: distance between point B (most concave point of the mandibular symphysis) and point B’ (labiomentale or the most concave point of the soft tissue of mandibular symphysis) (Figure 1G);
– Pog–Pog’: distance between the pogonion (Pog) or most prominent point of the chin and its soft tissue analog point (Figure 1H);
– Me–Me’: distance between the most inferior point of the mandible (menton (Me)) and its soft tissue analog point (Figure 1I).
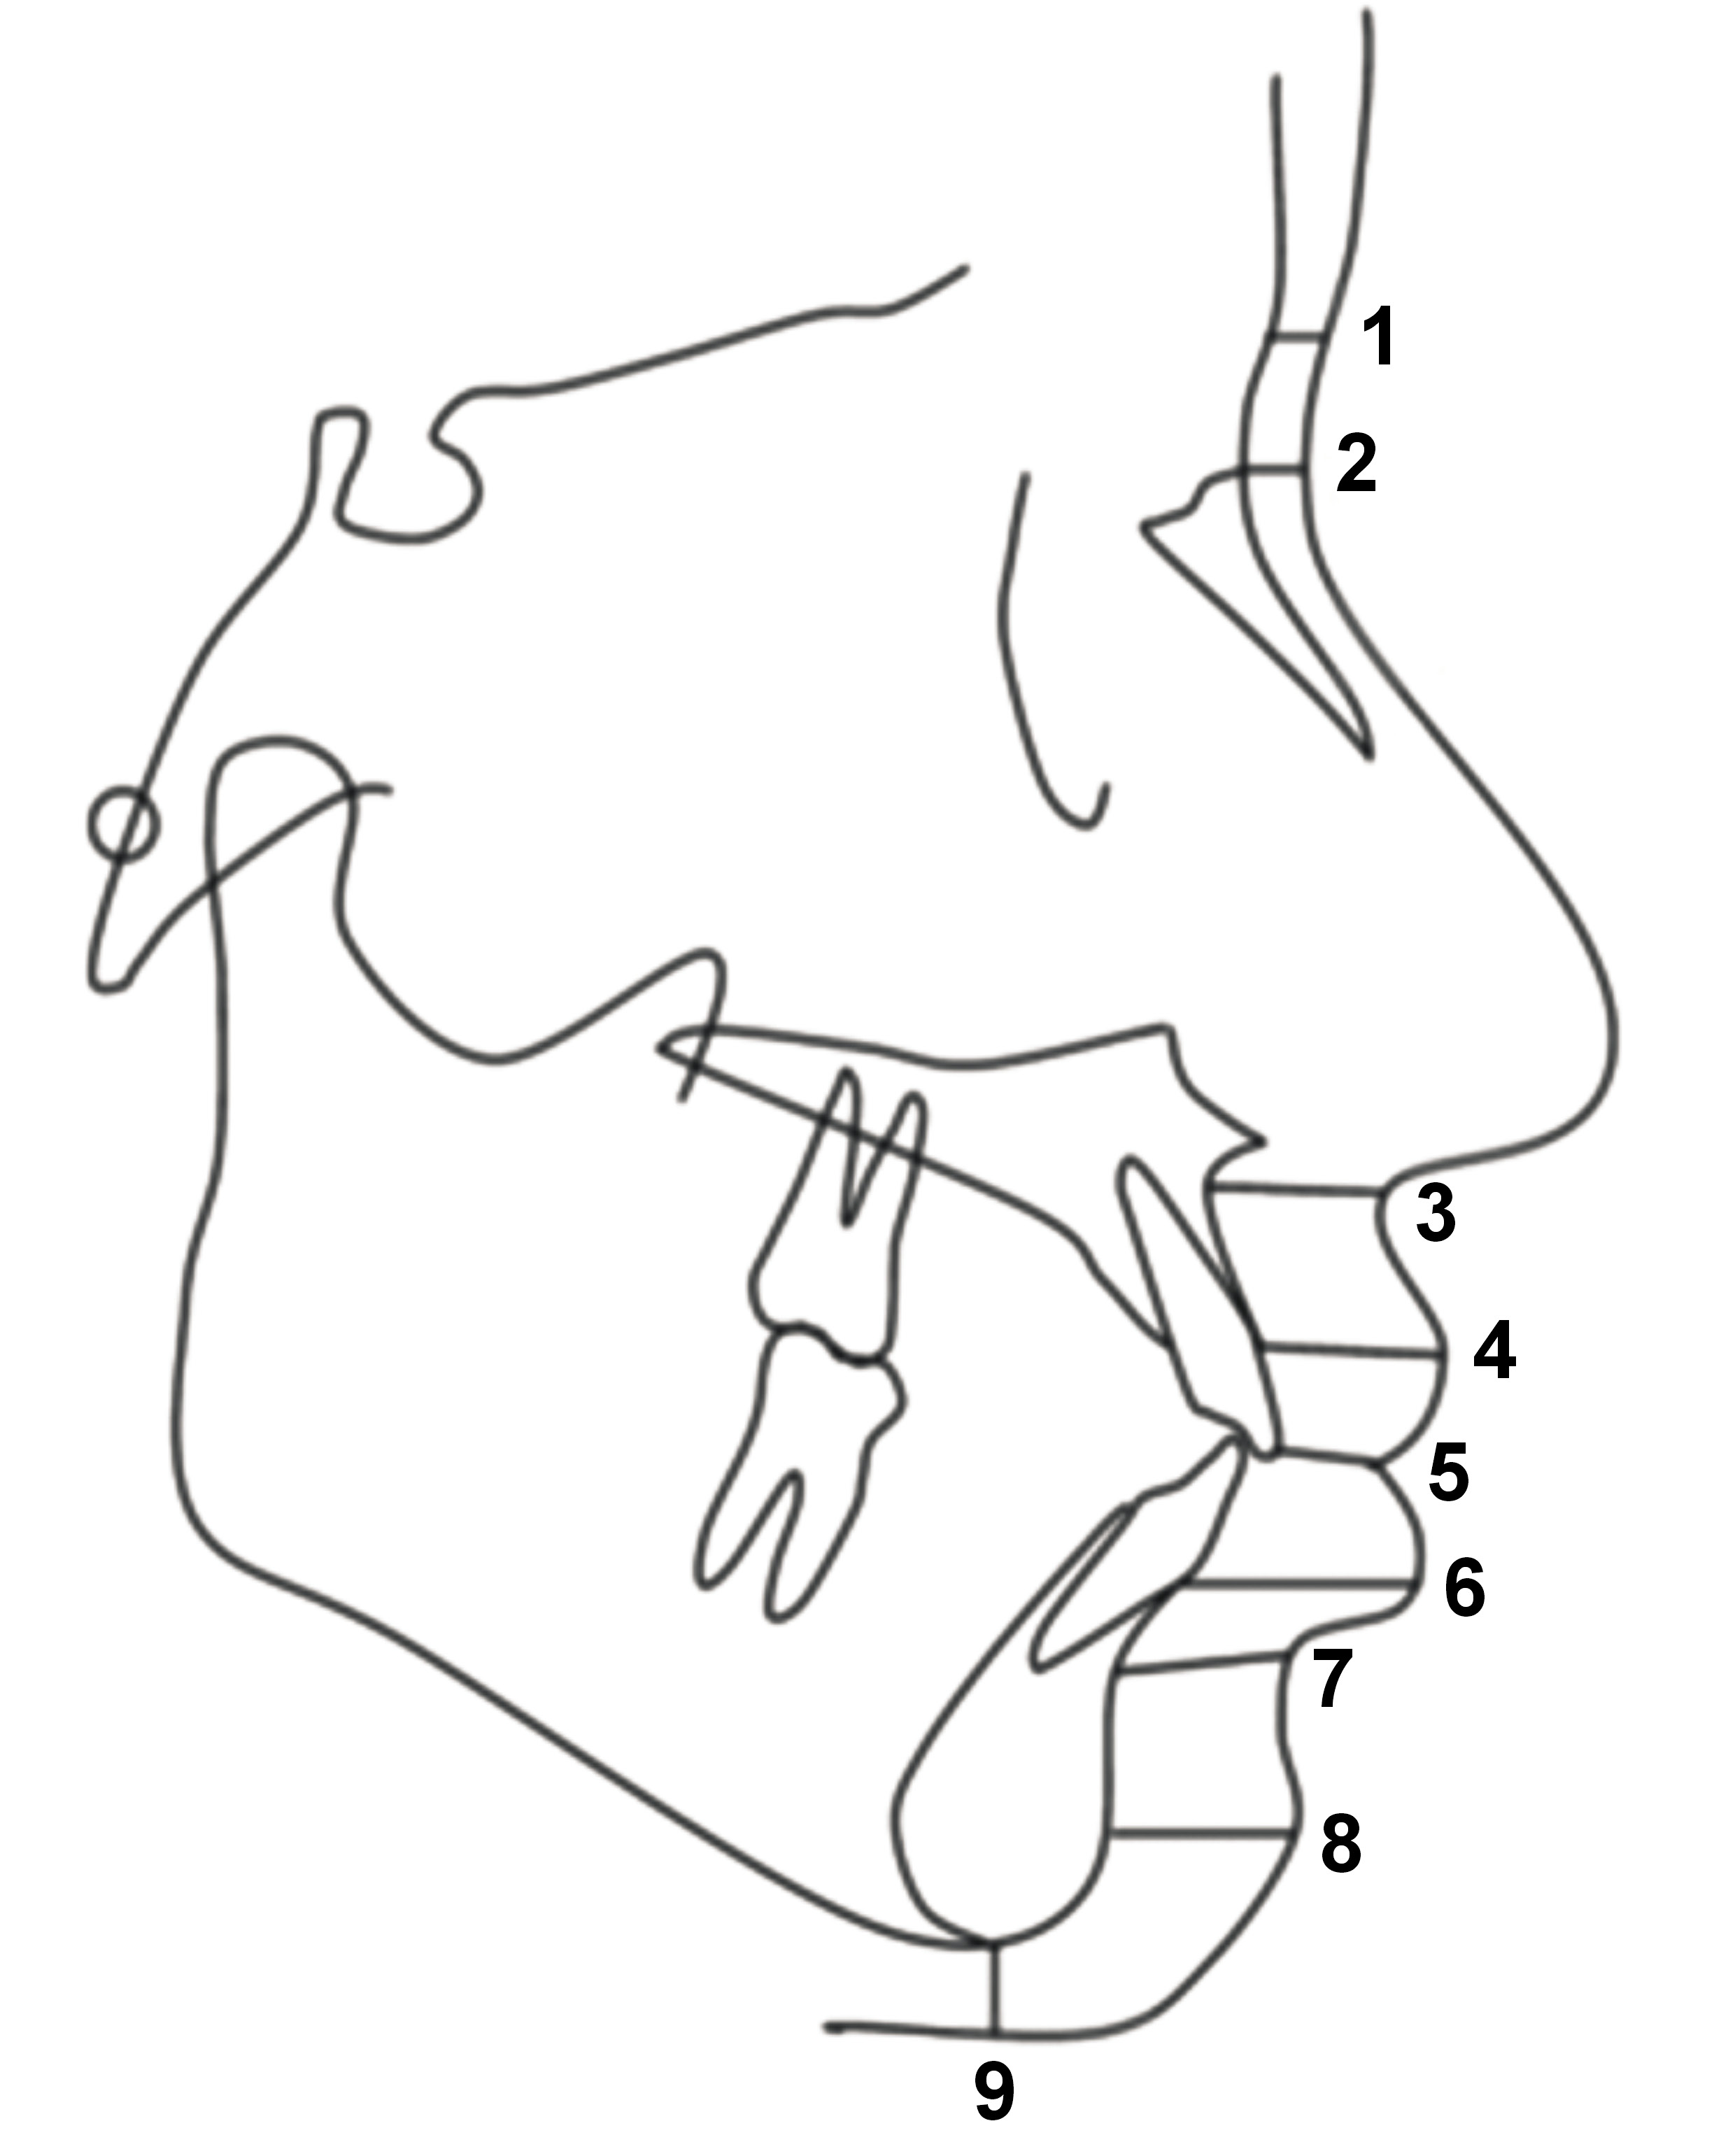
The schematic view of facial landmarks is outlined in Figure 2.
Data sources and measurement
The ANB angle was traced and measured in accordance with the American Board of Orthodontics (ABO) analysis. Subsequently, AudaxCeph software, v. 6.1.4.395 (Audax d.o.o., Ljubljana, Slovenia), was used to assess the soft tissue thickness in each group. The lateral cephalograms were evaluated and categorized by an orthodontist and an oral and maxillofacial radiologist. Next, the variables were measured by 2 trained and calibrated examiners using the Romexis® software, v. 3.8.3 (Planmeca, Helsinki, Finland); 25% of the lateral cephalograms were randomly selected and re-assessed after 2 weeks to evaluate intraobserver agreement. The measurements were calibrated using Romexis Viewer. The cephalostat in each image was measured and compared with its actual value of 45 mm to calibrate the images.
Sample size
The sample size was determined to be 36 individuals per skeletal class, in alignment with the methodologies outlined in a previous study conducted by Perović and Blažej.4 This calculation was based on the assumption that the mean soft tissue thickness at Pr–Ls was 12.75 ±2.50 mm for class II and 14.96 ±3.24 mm for class III patients, with a 95% confidence interval (CI) and 80% study power. By considering 20% possible dropouts and applying the correction coefficient, the sample size increased to 72 for each skeletal class (a total of 288 for all 4 classes).
Quantitative variables
The skeletal class (I, II or III) of participants was determined according to the Steiner ANB angle.1, 11, 12 The inclination angle (U1–NA angle) was measured to assign class II patients to division 1 or division 2. The ANB angle was measured by identifying the following points:
– point A: lowest point of the line between the anterior nasal spine and the prosthion (alveolar point);
– nasion (N): point at the intersection of the frontal and nasal bones;
– point B: lowest point of the line that connects Id and Pog (midline of the chin).
An ANB angle between 2 and 4 degrees was indicative of class I, values greater than 4 degrees indicated class II, and values less than 2 degrees indicated class III. The U1–NA angle, which was measured to determine the division of class II patients, is formed at the intersection of the longitudinal axis of maxillary central incisor and the nasion plane. The values ≤22 degrees were indicative of division 2, while those exceeding 22 degrees were indicative of division 1.1, 4, 6
The first group of participants (n = 72) exhibited orthognathic class I occlusion, with ANB angle values ranging from 2 to 4 degrees. The second group (n = 71) was categorized as class II division 1, characterized by an ANB angle >4 degrees, and a U1–NA angle >22 degrees. The third group (n = 72) was designated as class II division 2 with distal jaw deviation, an ANB angle >4 degrees, and a U1–NA angle ≤22 degrees. The fourth group (n = 70) was categorized as class III, characterized by an ANB angle <2 degrees.
Statistical analysis
The χ2 test was used to analyze the correlations between the qualitative variables. The normality of quantitative data was analyzed using the Shapiro–Wilk test. The t-test and analysis of variance (ANOVA) were applied to compare the mean values in each group. Pairwise comparisons were carried out using Tukey’s test. The Pearson’s correlation test was used to assess interobserver and intraobserver reliability. All statistical analyses were carried out using the SPSS for Windows software, v. 16.0 (SPSS Inc., Chicago, USA). Statistically significant values were defined as p < 0.05.
Results
Participants
A total of 285 lateral cephalograms were evaluated, including 144 from females and 141 from males. The sample was comprised of 72 individuals categorized as class I (25.3%; 36 males and 36 females), 71 participants categorized as class II division 1 (24.9%; 35 males, 36 females), 72 patients designated as class II division 2 (25.3%; 36 males, 36 females), and 70 individuals categorized as class III (24.6%; 34 males, 36 females).
Descriptive data
The mean age of the study participants was 25.2 ±2.1 years for males and 24.5 ±3.1 years for females, with a range of 18–40 years. One-way ANOVA revealed no statistically significant difference in the mean age between various skeletal classes (p = 0.158).
Outcome data
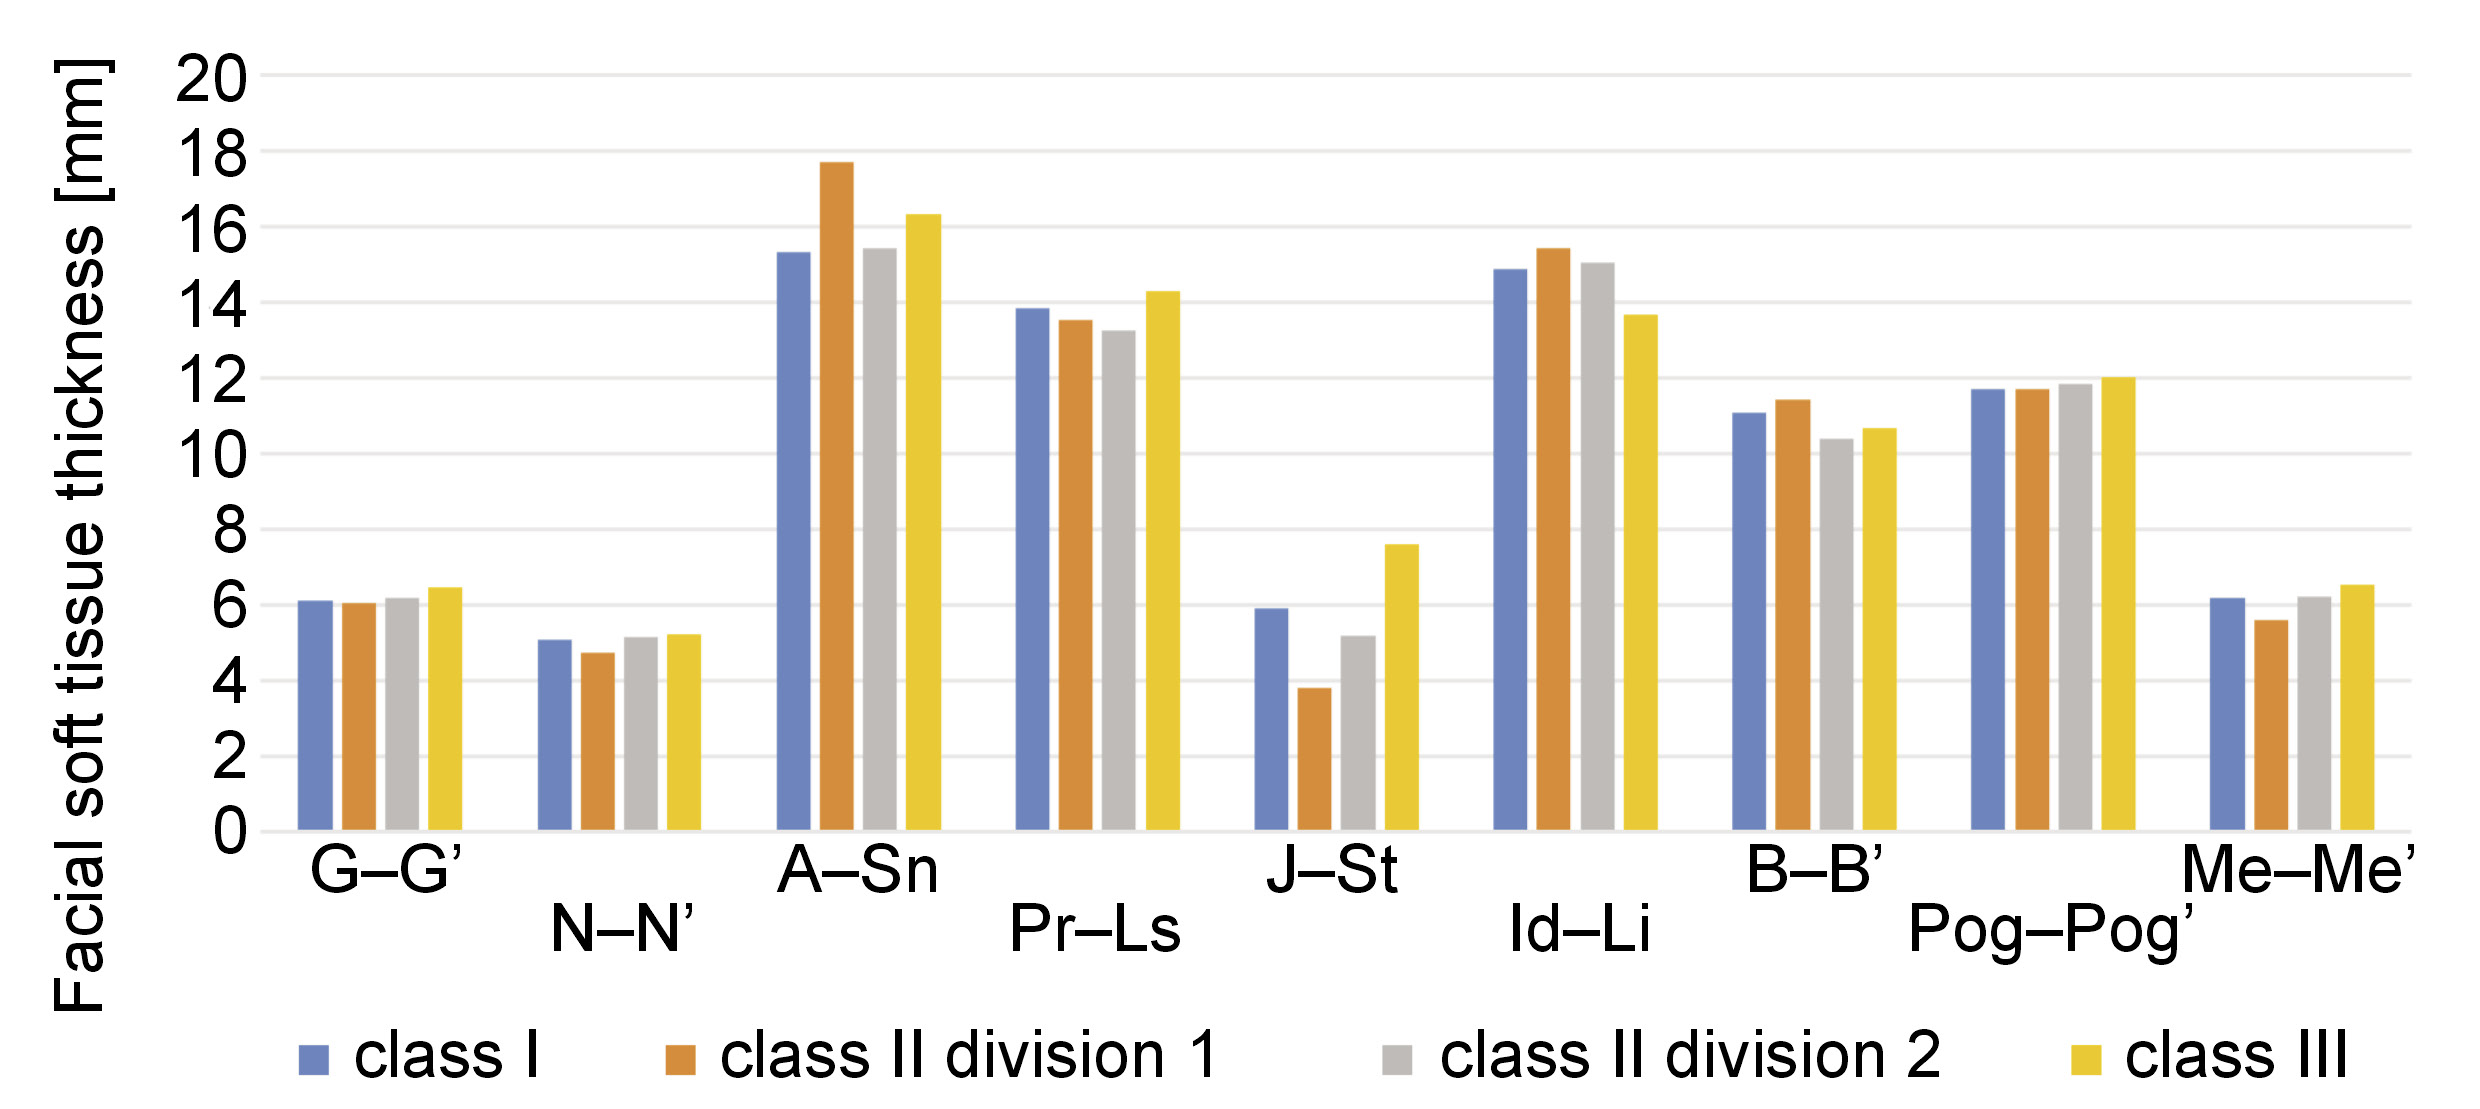
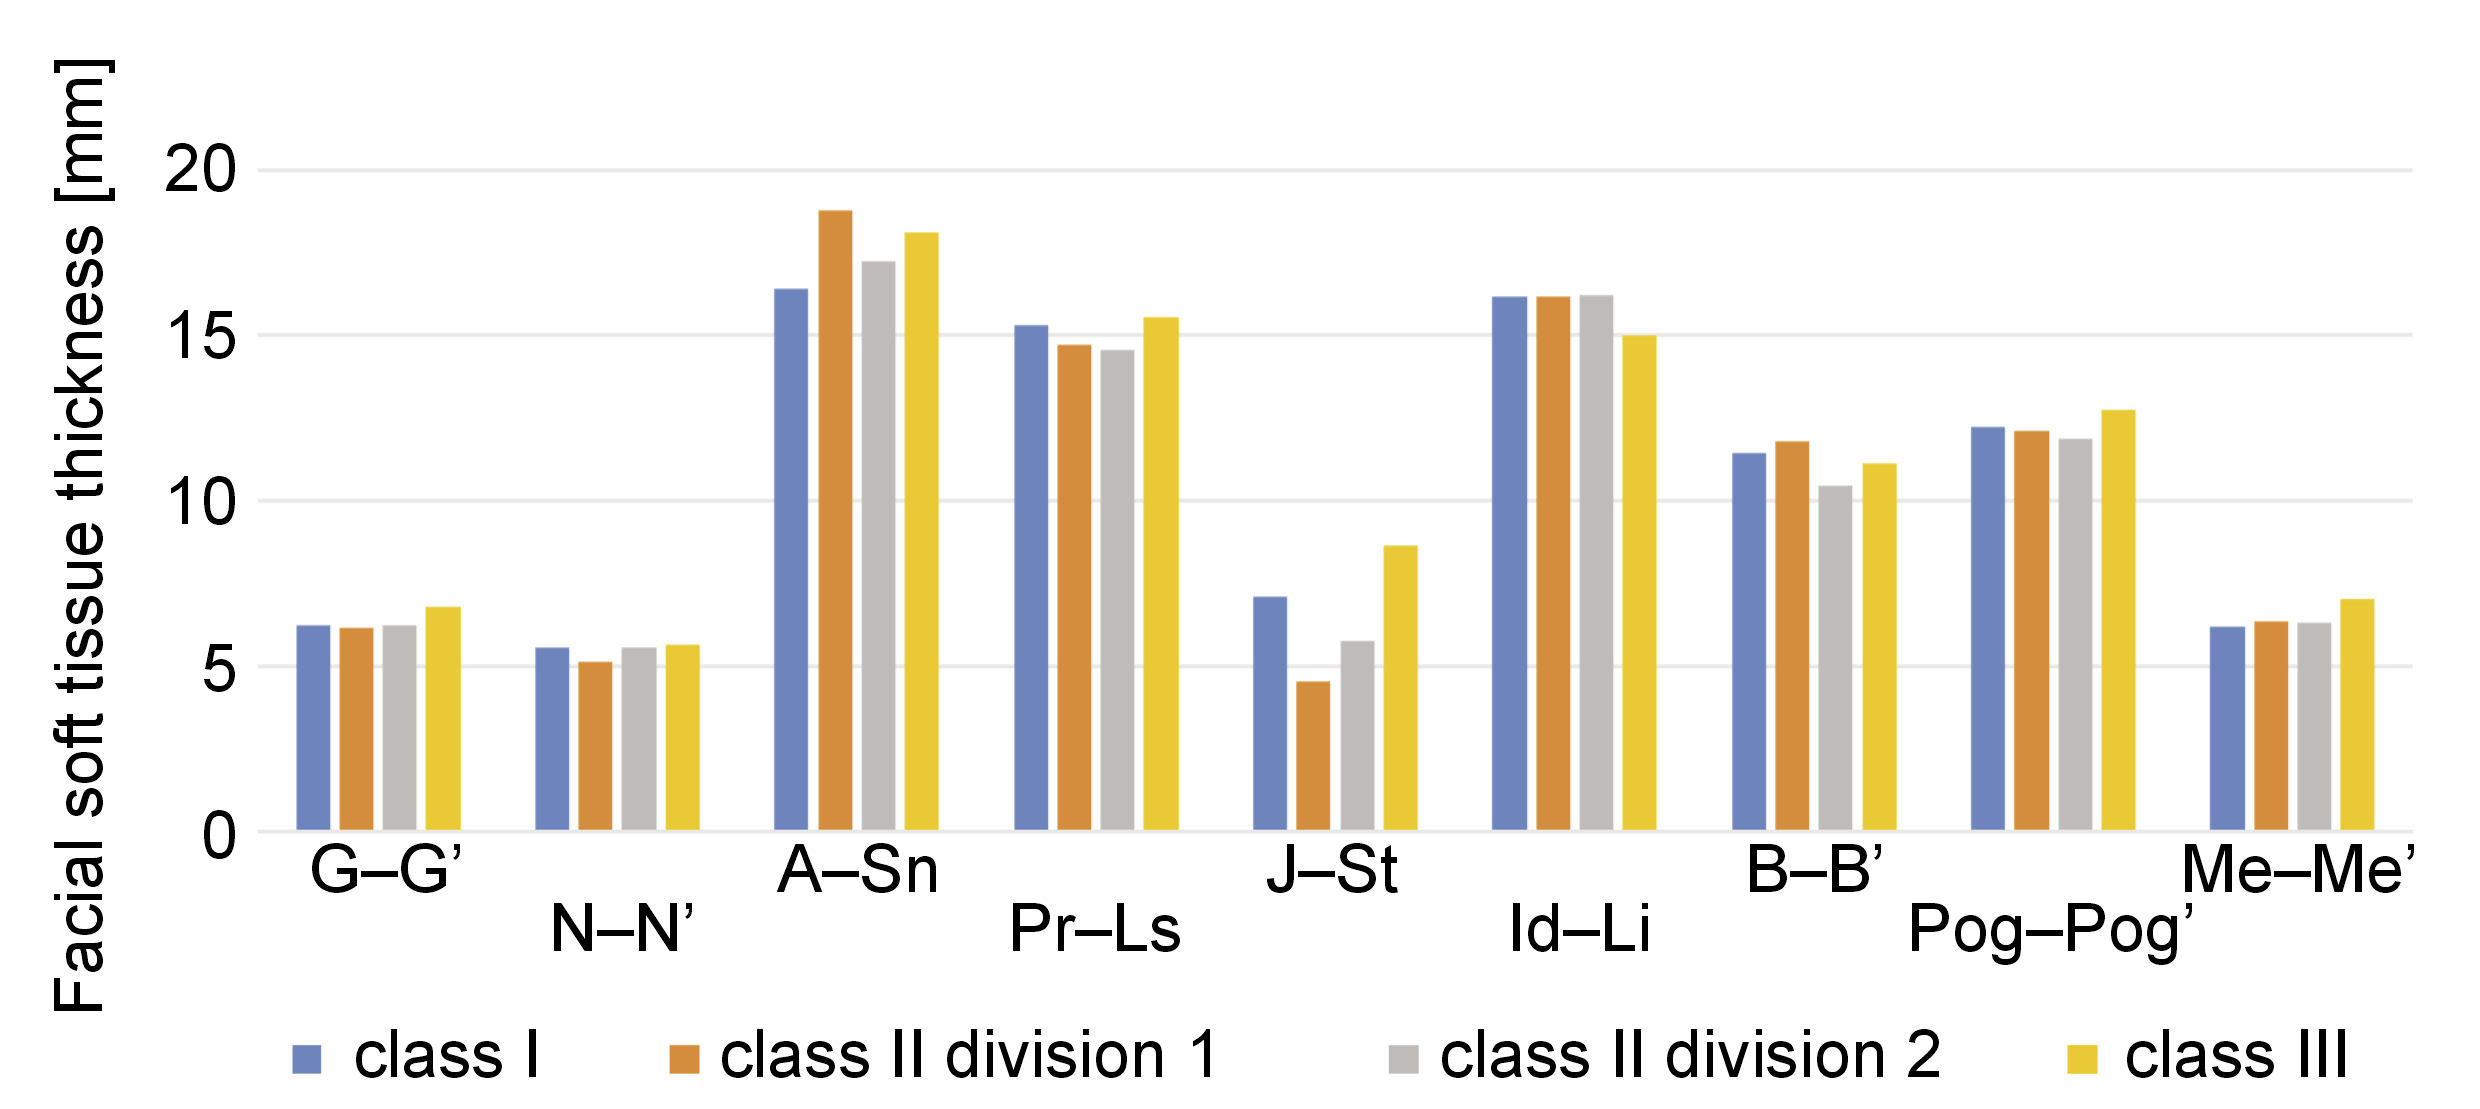
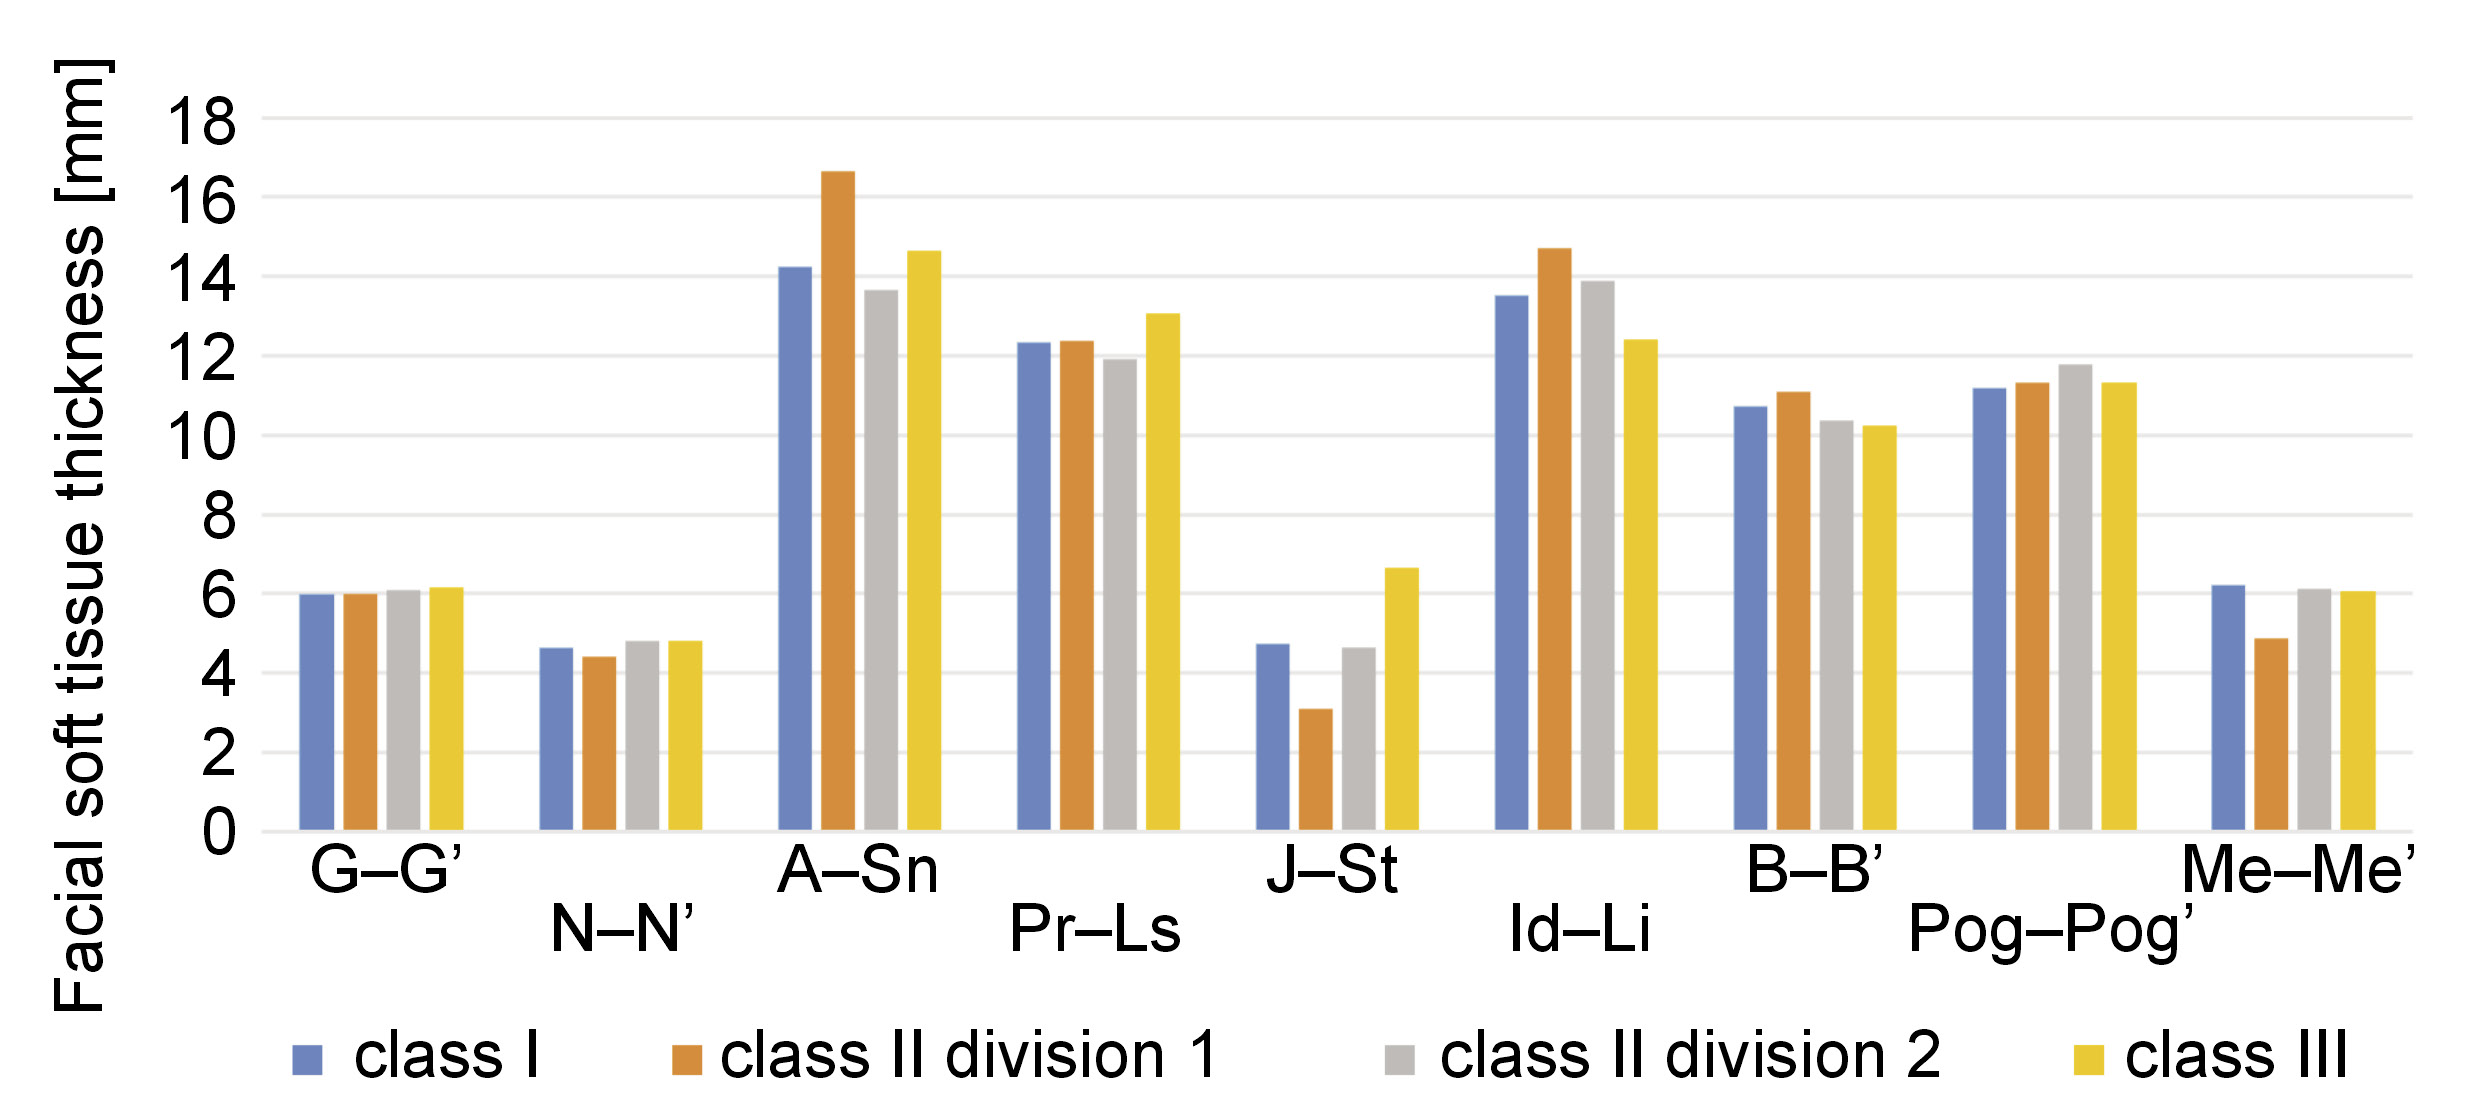
The mean values in the 4 skeletal classes were compared, irrespective of sex (Figure 3). Additionally, the analysis of the mean values of the soft tissue thickness was conducted in males and females among different skeletal classes (Figure 4,Figure 5).
Main results
The results demonstrated an increase in the soft tissue thickness at the subnasale in the class III and class II division 1 groups. Statistically significant differences in the thickness at the stomion were observed among various skeletal classes (p < 0.05). Increased thickness at this point was noted in the class I and class III groups, while a decrease in thickness was observed in the class II group. The difference in the thickness of the labrale inferius was more pronounced among the female subjects, as evidenced by the presence of a thinner lower lip across all classes. A significant difference in the soft tissue thickness at the labiomentale was observed between males categorized as class II division 1 and those designated as class II division 2. This finding suggests an increase in the soft tissue thickness at this particular site in the class II division 1 group. The difference in thickness at the pogonion was not significant between males and females in any group except class III. Nonetheless, the thickness at the menton was lower in class II division 1 females. A general observation reveals that the mean thickness of soft tissue was greater in males than in females (p < 0.05).
The lowest and highest values for males and females at different anatomical points were as follows: glabella in males (3.6–10 mm) and females (3.5–8.7 mm); nasion in males (2.6–9.8 mm) and females (2.1–8.6 mm); subnasale in males (8.2–29.3 mm) and females (9.8–21.0 mm); labrale superius in males (8.9–21.7 mm) and females (7.4–19.0 mm); stomion in males (1.8–15.9 mm) and females (0.9–15.6 mm); labrale inferius in males (10.7–21.0 mm) and females (9.5–18.1 mm); labiomentale in males (7.8–17.7 mm) and females (7.9–15.5 mm); pogonion in males (4–19.9 mm) and females (5.8–16.4 mm); and menton in males (2.6–13.0 mm) and females (1.5–10.3 mm). Table 1 presents a comparison of the soft tissue thickness between males and females, irrespective of their skeletal class.
Points at the midline exhibited significant differences across all groups and included subnasale, labrale superius, stomion, and labrale inferius (p < 0.05). As shown in Table 2, in the skeletal class III individuals, the difference between males and females was more pronounced, and became statistically significant at all points (p < 0.05).
The observed variation among the class I individuals did not reach statistical significance at the glabella, labiomentale, pogonion, and menton. In the class II division 1 individuals, the difference between males and females was significant at the subnasale, labrale superius, stomion, labrale inferius, and menton (p < 0.05). In class II division 2, the difference was significant only at the subnasale, labrale superius, stomion, and labrale inferius (p < 0.05).
Table 3 presents the intra- and interobserver reliability. The intraobserver reliability was assessed using Pearson’s correlation coefficients, which demonstrated very strong reproducibility (0.853–0.948). Similarly, the correlation coefficients for the interobserver reliability assessment displayed strong to very strong reproducibility of all measurements after a two-week interval (0.645–0.857).
Discussion
Key results
The present study assessed the soft tissue thickness of an Iranian adult population with different malocclusions according to their lateral cephalograms. The results demonstrated that, in males, the soft tissue thickness at the subnasale in the class III and class II division 1 individuals was significantly greater compared to the class I individuals. Additionally, in males, the soft tissue thickness at the stomion was significantly lower in the class II division 1 individuals due to the proclination of upper incisors. An increase in thickness at this point was noted in the class I and class III subjects. The increase in the class III group was so high that the difference between class III and class I became statistically significant. On the other hand, lower lip thickness in class III exhibited a significant difference compared to the class I and class II division 2 groups, and class II division 1. A significant difference in labiomentale was also identified between the class II division 1 and 2 individuals. Similar results were noted in the female subjects. At the subnasale, a difference in thickness was identified between class II division 1 and class I, as well as between the class III and class II division 2 groups. An increase in thickness at this point was noted in class III and class II division 1, while a reduction in thickness was identified in the class II division 2 and class I groups. As observed at the stomion, the differences among the various skeletal classes in females were similar to those reported for males. At the labrale inferius, significant differences were noted between the majority of the groups. The thickness was higher in class II and lower in the class III individuals. At the menton, the class II division 1 group showed significantly lower thickness than the other groups.
The present results revealed a significantly higher soft tissue thickness in males at all points, irrespective of their skeletal classes. The comparison of the soft tissue thickness between males and females in each skeletal class demonstrated that the mean soft tissue thickness in males was higher than in females at all points.
Interpretation
Kamak and Celikoglu found significant differences in the facial soft tissue thickness among the 3 skeletal classes at the labrale superius, stomion and labiomentale in a Turkish population.13 Utsuno et al. revealed significant differences in the soft tissue thickness among different skeletal classes at the subnasale, labrale superius, stomion, labiomentale, and pogonion in Japanese females.14 Jeelani et al. conducted a study on a Pakistani population, which identified substantial variations in the soft tissue thickness among different skeletal classes at the glabella, labrale superius and stomion in males and labrale superius, labrale inferius, labiomentale, and pogonion in females.9 Sarilita et al. indicated significant differences in the soft tissue thickness between the class II and class III groups at the lower lip in males, and at the subnasale, upper and lower lips, stomion, and labiomentale in females.5 They also confirmed a general pattern of an increased lower lip thickness in class II compared with class III individuals, as well as a thicker upper lip in class III compared to class II subjects.5
The observed differences between the present findings and the results of previous studies can be attributed to racial differences among the study populations. Bacon et al. in their review confirmed the presence of a difference in soft tissue profile among different ethnic and racial groups.15 Additionally, the difference in the soft tissue thickness among various classes was not significant at points where soft tissue was close to the underlying bone, such as the nasion and the pogonion. Similar results were reported by Kurkcuoglu et al.16 and Jeelani et al.9 The thickness of the facial soft tissue decreased at the pogonion and labiomentale with mandibular prognathism.17 This observation was replicated at the labiomentale in the present study.
A comparison of 4 skeletal classes revealed that the class III and class II division 1 groups exhibited an increased soft tissue thickness at the subnasale. This phenomenon may be attributed to hypoplasia of the base of the maxilla in such individuals. In the case of patients exhibiting a routine developmental jaw disproportion, the overlying soft tissue envelope is typically normal, albeit distorted by the underlying skeletal disharmony. On the other hand, normal variations in skin thickness and quality, sweat gland density, fat distribution, and pigmentation are to be expected. An example of soft tissue distortion, as opposed to deformity, is seen in maxillomandibular deficiency (i.e., short face growth pattern). The presence of chubby cheeks and excess fat in the neck is a common observation. The restoration of normal facial contours and curvatures is achieved through maxillomandibular (skeletal) advancement and vertical lengthening.18 Moreover, class III showed an increased soft tissue thickness at the labrale superius and stomion, accompanied by a decreased soft tissue thickness at the labrale inferius and labiomentale. It has been observed that the pattern of increased upper lip thickness and decreased lower lip thickness can contribute to the camouflage of the underlying skeletal discrepancy. Similarly, decreased upper lip thickness and increased lower lip thickness in class II patients serve to camouflage the skeletal class II relationship.9
The class III group demonstrated an increased soft tissue thickness at the glabella. However, these results did not attain statistical significance. This difference was particularly pronounced in class III males when compared to females, a finding that may be attributable to the larger frontal sinus dimensions observed in this skeletal group and in males.19, 20, 21, 22, 23 Yassaei et al. noted a significant correlation between the frontal sinus dimensions and mandibular body length, suggesting that the dimensions of the frontal sinus can serve as an index to assess the remaining growth of the mandible.19 Yet, further studies are necessary to confirm this statement. The difference in the soft tissue thickness at the glabella may also be due to frontal bossing, a consequence of mandibular prognathism. These conditions are prevalent among individuals with elevated growth hormone secretion levels.24
Changes in the facial soft tissue thickness can be related to the inclination angle of upper incisors. Accordingly, in the class II division 1 cases, the lower lip has a proclined and downward position, affecting the soft tissue thickness at the labiomentale and labrale inferius. Moreover, the significant difference in the soft tissue thickness at the stomion between the class II division 1 and 2 groups is associated with the inclination angle.
Jeelani et al. conducted a study on Pakistani adults, in which they reported significantly higher soft tissue thickness at the glabella, nasion, subnasale, labrale superius, and labrale inferius in males.9 Sarilita et al. evaluated an Indonesian population and reported a significantly higher soft tissue thickness in males at the nasion, rhinion, subnasale, upper and lower lips, and stomion.5 Uysal et al. found significant differences in the soft tissue thickness at the labrale superius, labrale inferius, pogonion, and menton between male and female Turkish adults.11 Kamak and Celikoglu observed a significantly higher soft tissue thickness at all points except for the glabella, labiomentale and pogonion in Turkish males.13 Furthermore, Utsuno et al. assessed Japanese adults and found sex-related differences in the facial soft tissue thickness at all points between the skeletal class I and III groups.14
The present study assessed the soft tissue thickness between males and females separately in each skeletal class. The results demonstrated that the mean soft tissue thickness in males was higher than in females at all points. The differences were particularly pronounced in class III at all measured points. Nonetheless, the differences were not significant in some groups at specific points when the distance from the underlying bone was minimal.
Few studies utilized cone beam computed tomography (CBCT) to evaluate soft tissue dimensions in malocclusion patients. Jazmati et al. evaluated the cone-beam computed tomography (CBCT) scans of 96 patients in 3 skeletal sagittal classes.25 In male patients, the values of U1-stom, nasal width and mouth width were significantly greater in class I as compared to class II patients. Also, class I patients had a lower lip thickness than class III patients. In female patients, the upper lip height and the labiomental fold thickness were significantly greater in class II in comparison with class I patients. Conversely, class I patients had a greater lower lip height than class III patients. Class III patients had greater Ls-Pr, U1-stom and face width at Cheilion as compared to class II patients. Class II patients indicated lower values of the lip thickness, the lower lip height and the upper lip height as compared to class III patients. Males had a greater soft tissue thickness than females. Nonetheless, the differences between males and females in the variables assessed in each skeletal class did not reach statistical significance.25
It is important to acknowledge that congenital deformities can influence the facial soft tissue thickness, as evidenced by cleft palates. Paradowska-Stolarz et al. assessed the relationship between clefts, determining that cleft palate may influence soft tissue formation and can be limited to the uvula.26 There are exceptions where the soft tissue envelope is directly affected due to a malformation (e.g., Treacher Collins syndrome, hemifacial microsomia, cleft lip, hemifacial hypertrophy), previous trauma (burns, lacerations), or scarring after infection. In cases where a jaw deformity is associated with a syndrome, clefting, or a soft tissue traumatic deformity, the impact on facial aesthetics and head and neck functions is exacerbated, and the soft tissue envelope necessitates particular consideration.18 The present study encompassed healthy individuals who did not suffer from any congenital disease.
Generalizability
The significance of soft tissue analysis and determination of skeletal class prior to facial reconstructions is further highlighted in the presence of a significant difference in the soft tissue thickness at different anatomical points among the 4 skeletal classes. Also, it is important to take into account the differences in the soft tissue thickness between males and females, as well as among different skeletal classes, in the context of orthodontic treatment planning.
Limitations
The present study was subject to certain limitations. It has been documented that the body mass index (BMI) may have an impact on the soft tissue thickness.7 However, the retrospective design of the present study precluded the control of this confounder. Additionally, the study was conducted in 1 city; thus, the results may not be generalizable to the entire population of Iran. Future studies should compare the soft tissue thickness of different ethnic groups within the Iranian population.
Conclusions
A thicker facial soft tissue was observed in males compared to females across all skeletal classes, and this difference was more pronounced in the class III individuals. A statistically significant variation in the soft tissue thickness was observed among different skeletal classes, particularly at regions that were farther from the underlying bone. The class III individuals exhibited increased thickness in the upper lip soft tissue, accompanied by a decrease in the lower lip soft tissue thickness. In the class II individuals, a decrease in upper lip thickness and an increase in lower lip thickness were observed. This pattern suggests that the underlying skeletal discrepancy is being concealed.
Ethics approval and consent to participate
The study was approved by the Ethics Committee of Qazvin University of Medical Sciences, Iran (IR.QUMS.REC.1401.197).
Data availability
The datasets generated and/or analyzed during the current study are available from the corresponding author on reasonable request.
Consent for publication
Not applicable.
Use of AI and AI-assisted technologies
Not applicable.