Abstract
Background. Changes in the fatty infiltration and/or muscle volume of neck muscles can alter cervical spine alignment and cranial load distribution, which may cause pain in the orofacial region.
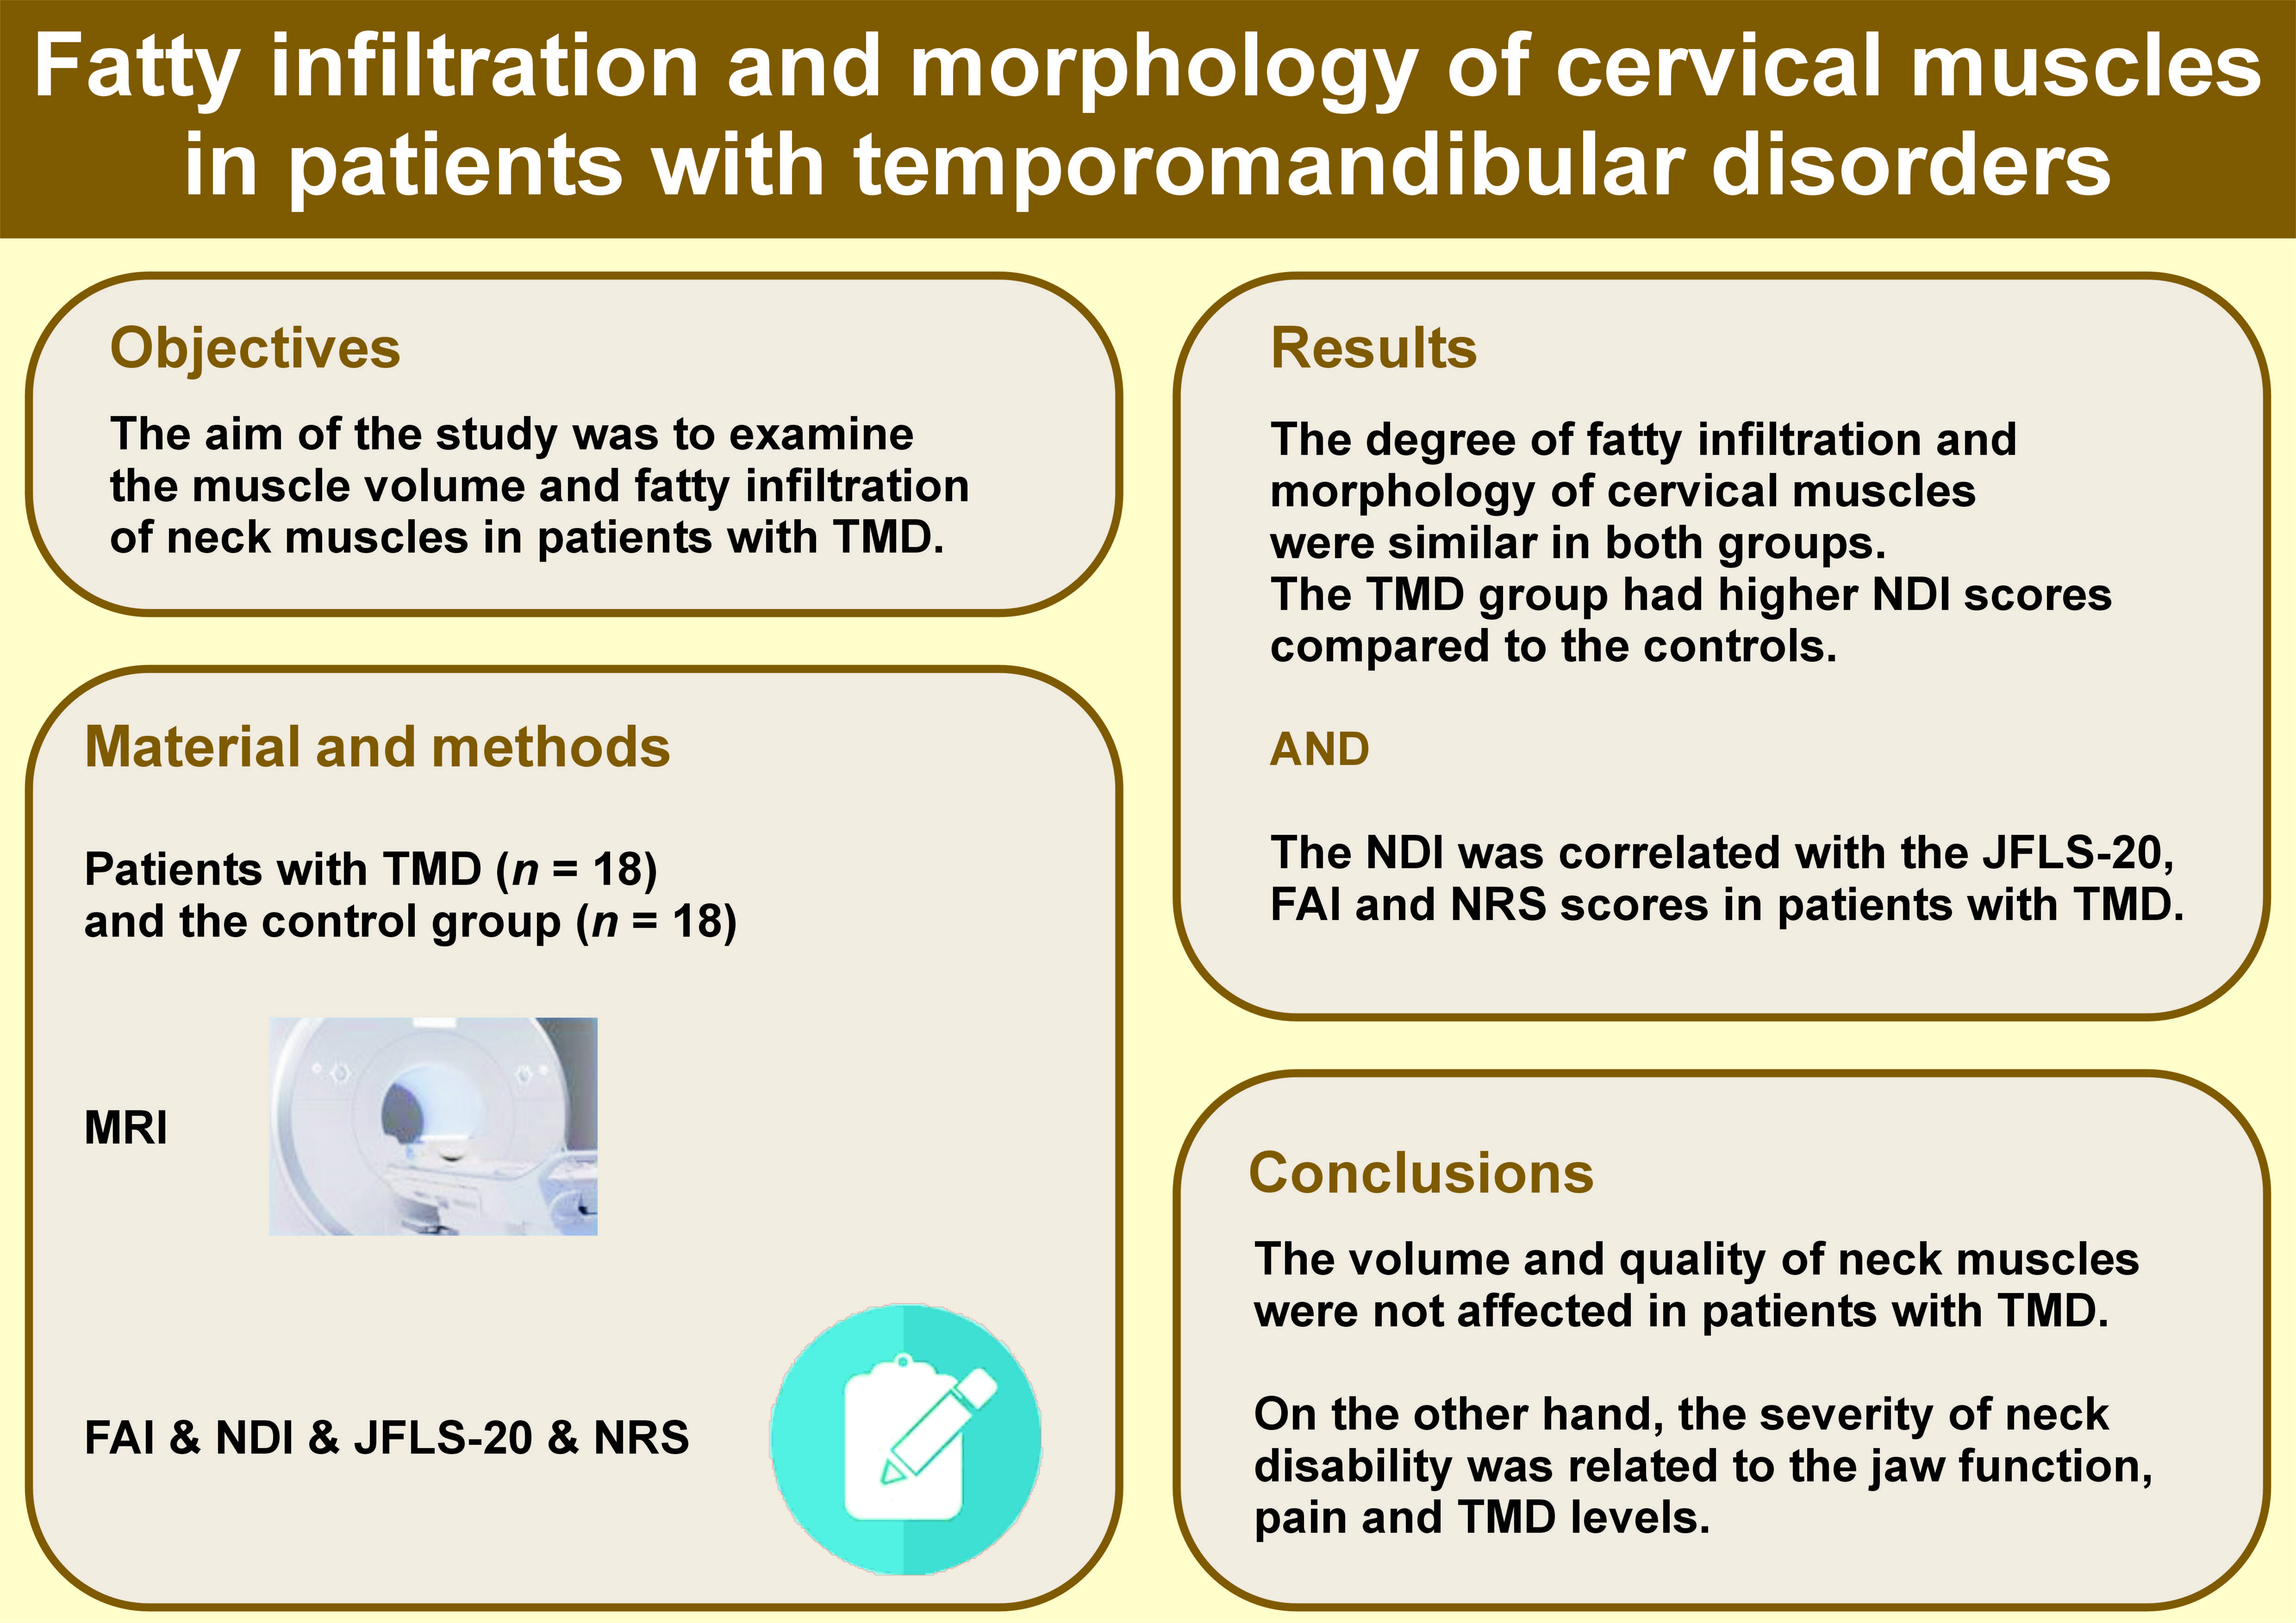
Objectives. The aim of the study was to examine the muscle volume and fatty infiltration of neck muscles in patients with temporomandibular disorders (TMD).
Material and methods. This case–control study included 18 patients with TMD and 18 age- and sex-matched controls. The muscle volume and fatty infiltration of the neck muscles of the participants were measured using magnetic resonance imaging (MRI) and ITK-SNAP software. The 3D models of the sternocleidomastoid (SCM), splenius capitis (SPLC), semispinalis cervicis (SC)–semispinalis capitis (SCP), and multifidus (M) muscles within the C3–C7 range were created using ITK-SNAP, a semi-automatic segmentation software. The models were used to determine the volumes and fatty infiltration levels. The Neck Disability Index (NDI) was used to assess neck pain-related disability. The severity of TMD was determined using the Fonseca Anamnestic Index (FAI), while jaw-related disability was measured with the Jaw Functional Limitation Scale-20 (JFLS-20). Pain levels were recorded at rest and during chewing using the numeric rating scale (NRS).
Results. There were no statistically significant differences in total muscle volume, fatty infiltration volume and fatty infiltration percentage of the SCM, SPLC, SCP, SC, and M muscles between the 2 groups (p > 0.05). The patient group had higher NDI scores compared to the controls (p < 0.001). The NDI scores correlated positively with the JFLS-20 (r = 0.831, p < 0.001), FAI (r = 0.815, p < 0.001) and NRS scores at rest (r = 0.753, p < 0.001) and during chewing (r = 0.686, p < 0.001).
Conclusions. The present study did not identify any significant differences in the neck muscle volume or fatty infiltration between the TMD patients and controls. However, the severity of neck disability was found to correlate with jaw function, pain and TMD levels.
Keywords: muscle, volume, temporomandibular disorders, fatty infiltration, neck
Introduction
Temporomandibular disorders (TMD) are a common group of musculoskeletal conditions, affecting around 31% of the general population and leading to pain and/or dysfunction in the temporomandibular joint, masticatory muscles and related structures.1, 2, 3 The impact of TMD symptoms on an individual’s quality of life is comparable to that of low back pain or severe headaches.4
Temporomandibular disorders often manifest with symptoms that affect the cervical region, such as neck pain, tender points, cervical spine dysfunction, and changes in cervical spine posture and head posture.2, 5, 6, 7, 8, 9 Studies have shown a correlation between orofacial disorders and neck disorders, which can be attributed to physiological, neuronal, biomechanical, and anatomical connections between the craniofacial and cervical spine regions.2, 5, 6, 7, 8, 9 Alterations in the cervical spine posture can affect jaw movements and the activation of masticatory muscles due to the existence of muscular and ligamentous connections between the temporomandibular joint and the cervical spine.10, 11 In addition, cervical pain can lead to pain in the orofacial region through reflex and neural connections involving mechanoreceptors and nociceptors within the cervical muscle system and the temporomandibular joint.12, 13, 14 Nociceptive signals originating from the cervical region result in an increase in central sensitization in the trigeminocervical nucleus, thereby causing pain in the orofacial region.12
There is extensive evidence of neurological and anatomical connections between the cervical region and TMD. However, there is a dearth of research related to the motor control, endurance and strength of the neck muscles. To date, there have been a limited number of studies investigating the endurance and/or strength of neck muscles in patients with TMD. Previous studies have reported a decrease in the endurance and strength of neck flexor muscles and the endurance of neck extensor muscles in patients with TMD.5, 15, 16, 17 However, to the best of our knowledge, no study has investigated the fatty infiltration and muscle volume of neck muscles using magnetic resonance imaging (MRI) in patients with TMD. Muscle volume is a major determinant of muscle force production.18 Additionally, measuring fatty infiltration provides important information about muscle quality.19 The cervical muscles play an important role in the maintenance of neutral alignment, cranial load distribution and horizontal gaze during neck motion.17, 20, 21 Changes in the fatty infiltration and/or muscle volume of neck muscles could affect the force production of neck muscles18, 19 and alter cervical spine alignment and cranial load distribution, potentially causing orofacial pain.10, 11, 20, 21, 22 The identification of potential changes in the volume and fatty infiltration of neck muscles in patients with TMD could help clinicians make adequate treatment decisions. Therefore, the aim of this study was to examine muscle fatty infiltration and muscle volume ratio in neck muscles of patients with TMD and to compare these findings with those of asymptomatic participants. It was hypothesized that there would be a reduction in muscle volume and an increase in the fatty infiltration in the neck muscles of patients with TMD in comparison to asymptomatic participants.
Material and methods
Sample size calculation
To determine the minimum number of cases to be included in the study, a power analysis was conducted using specialized software (SPSS Sample Power 3.0; IBM Corp., Armonk, USA). The sample size calculation indicated that a minimum of 13 participants per group is required, assuming an alpha level (α) of 0.05 and a desired power (β) of 80% to detect a minimum difference of 6.9% in the fatty infiltration of the multifidus (M) and semispinalis cervicis (SC) muscles. This calculation was based on a mean muscle fatty infiltration of 23% in the control group, with a standard deviation (SD) of 6.3%.23
Participants
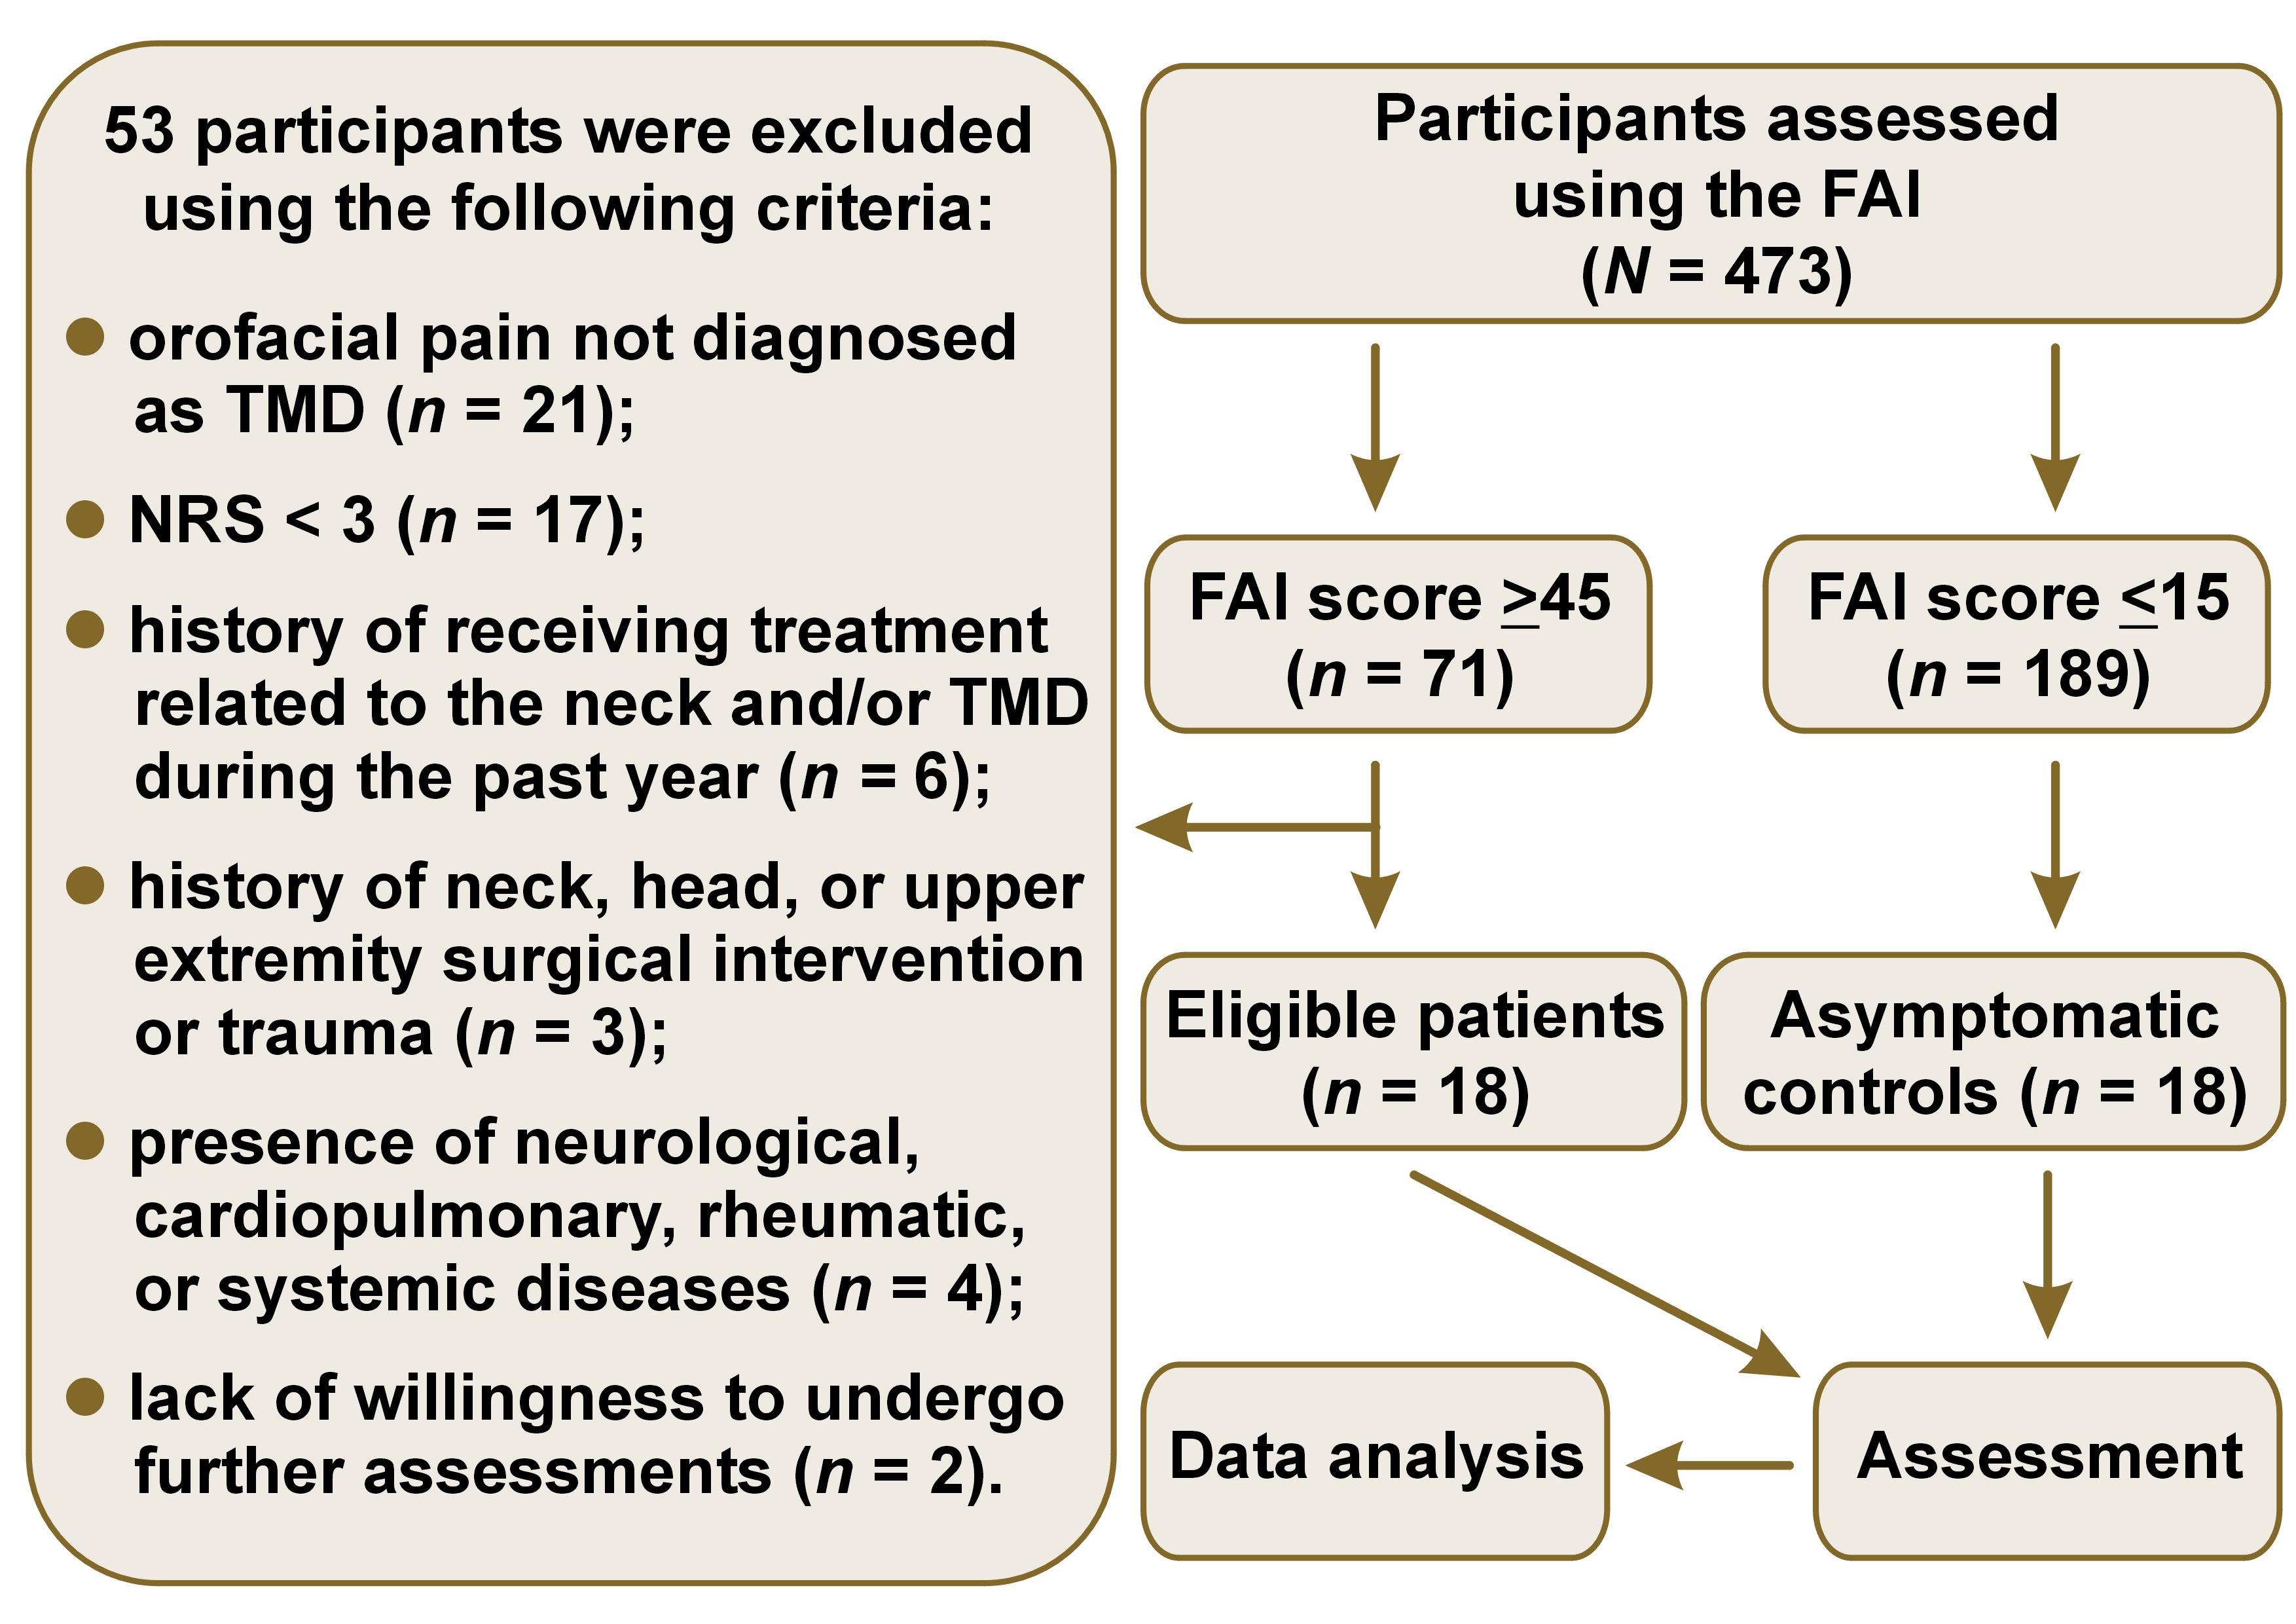
This case–control study included the staff and students of Toros University (45 Evler Campus), Mersin, Turkey, and was conducted between March 2020 and November 2022. The presence of TMD was evaluated using the Fonseca Anamnesis Index (FAI), which has demonstrated high diagnostic accuracy.24 Individuals with moderate or severe TMD (FAI score ≥45) and individuals without TMD (FAI score ≤15), according to the FAI, were invited to participate.25, 26 Only patients with moderate and severe TMD were included in the study, because the differences in the examined parameters were expected to be more pronounced. The individuals who agreed to participate were evaluated by an oral surgeon who had received training in the diagnostic criteria for TMD (DC/TMD) and had 25 years of clinical experience. Individuals who met the DC/TMD (Ia) were included in the TMD group. The TMD group consisted of individuals who had experienced pain in the temporomandibular joint and/or masticatory muscles for at least 6 months before the study, with a pain severity rating of at least 3 on the numeric rating scale (NRS). The control group consisted of asymptomatic individuals who had not experienced pain related to the neck region, temporomandibular joint, or masticatory muscles for at least 1 year before the study. At the end of the clinical evaluations, 18 participants with TMD (10 males, 8 females) aged 27–57 years and 18 controls (9 males, 9 females) aged 26–58 years were included in the study (Figure 1). Participants who reported any of the following were excluded from the study: a history of receiving treatment related to the neck and/or TMD in the past year; a history of neck, head, or upper extremity surgical intervention or trauma; presence of neurological, cardiopulmonary, rheumatic, or systemic diseases. The study was conducted in accordance with relevant guidelines and regulations, including the Declaration of Helsinki.
Pain assessment
The severity of pain experienced by the participants was evaluated at rest and during chewing using the NRS, which is a reliable and valid tool for the assessment of pain severity.27, 28 On the NRS, a score of 0 indicates no pain, while a score of 10 represents the worst pain imaginable.
Assessment of disability and symptom severity
The severity of TMD was determined by the FAI, which has been validated and shown to be reliable in the Turkish-speaking population.24 The index consists of 10 questions, each offering 3 possible responses: no (0 points); sometimes (5 points); and yes (10 points). The FAI scores range from 0 to 100. The total score is used to classify the severity of TMD as follows: no TMD (≤15); mild TMD (20–40); moderate TMD (45–65); and severe TMD (70–100).25
The Jaw Functional Limitation Scale-20 (JFLS-20) was used to evaluate disability related to jaw function. This scale has been validated and proven reliable for evaluating jaw-related disabilities.29 It consists of 20 questions, with each question scored on a scale of 0 (no limitation) to 10 (severe limitation).
The Neck Disability Index (NDI) was used to determine disability related to neck pain. The index has been validated and shown to be a reliable instrument for assessing neck pain-related disability in the Turkish-speaking population.30 The scale consists of 10 questions. There are 5 optional answers for each question, ranging from 0 (no disability) to 5 (complete disability).
MRI measures and analysis
All MRI studies were conducted using a 1.5 Tesla system (Philips Ingenia Ambition MRI system; Philips Healthcare, Best, the Netherlands) with a 16-channel receiver coil. The MRI protocol consisted of a T1-weighted turbo spin echo (TSE) array (repetition time/echo time (TR/TE) = 567/15 ms; TSE factor 3, slice thickness = 3 mm) and a T2-weighted array. The images were acquired with the subject’s mouth closed. Axial images were obtained using the T1-weighted MRI protocol. The T2-weighted parasagittal images were acquired using the axial localizer image.
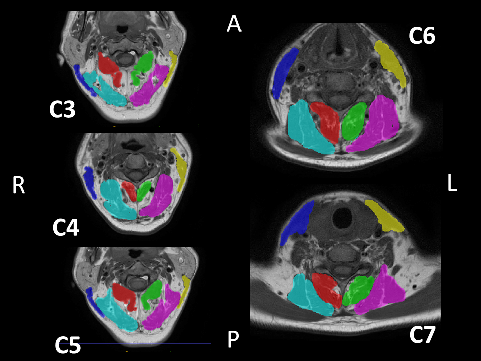
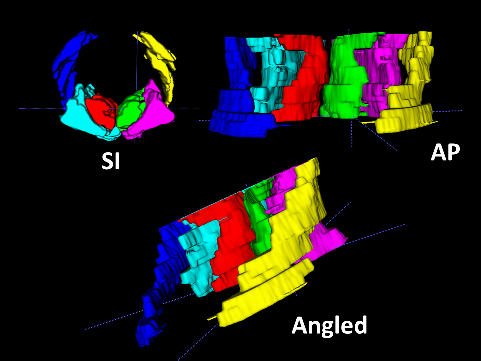
A semi-automatic segmentation software, ITK-SNAP (http://www.itksnap.org/pmwiki/pmwiki.php), was used to generate a 3D model of the sternocleidomastoid (SCM), splenius capitis (SPLC), SC–semispinalis capitis (SCP), and M muscles within the C3–C7 range, as well as to calculate their volumes (Figure 2,Figure 3). The MRI files were converted from the Digital Imaging and Communications in Medicine (DICOM) format to the Neuroimaging Informatics Technology Initiative (NIfTI) format using dcm2niix software (https://people.cas.sc.edu/rorden/mricron/dcm2nii.html).31 Subsequently, the files were uploaded to ITK-SNAP, where the boundaries of the deep neck muscles and the SCM muscle were delineated in 3D coordinates. For each scan, the boundaries of the muscles were determined using the active contour segmentation method. The muscle body contrast was created using the clustering 3/1 option, and the adipose tissue contrast was created using the clustering 3/2 option.32, 33 Each muscle and adipose tissue region was enclosed in a bubble created within the ITK-SNAP interface, and the 3D model was filled by determining the processor speed. The volumes were recorded in mm3 from the volumes and statistics tab of the software.34 All measurements were performed by the same investigator who was blinded to the study groups.
Statistical analysis
The data was analyzed using the IBM SPSS Statistics for Windows software, v. 22.0 (IBM Corp., Armonk, USA). Visual and analytical methods were used to assess whether the evaluated parameters were normally distributed. As the parameters did not show a normal distribution, the demographic data and the assessed parameters are presented using the median (M) (interquartile range (IQR)). The Mann–Whitney U test was used to compare the differences between the parameters in different groups. The Wilcoxon test was employed to assess differences between the right and left sides in patients with TMD and the control group. Correlation coefficients were calculated using the Spearman’s test to determine the relationships between the NDI score and the JFLS-20, FAI and NRS scores in patients with TMD. A p-value <0.05 was considered statistically significant.
Results
No statistically significant differences were observed between the TMD and control groups in terms of age (p = 0.389), height (p = 0.650), weight (p = 0.584), and body mass index (BMI) (p = 0.888). The M (IQR) for the FAI, JFLS-20, NDI, and NRS scores at rest and during chewing in patients with TMD were 55 (50–65), 40 (28–65), 14 (9–17), 4 (3–5), and 5 (3–6), respectively. The TMD group had higher FAI (p < 0.001), JFLS-20 (p < 0.001) and NDI (p < 0.001) scores compared to the control group (Table 1). There were no significant differences between the groups with regard to the mean total volume of the M+SC, SCP+SPCL and SCM muscles on the left and right sides (p > 0.05). Similarly, no differences were observed between the TMD and control groups with regard to the total fatty infiltration volume and fatty infiltration percentage of the assessed muscles (p > 0.05) (Table 2). In addition, no differences were found between the right and left sides within the TMD group regarding the mean total volume of M+SC (p = 0.500), SCP+SPCL (p = 0.699) and SCM (p = 0.744), as well as the total fatty infiltration volume of M+SC (p = 0.679), SCP+SPCL (p = 0.679) and SCM (p = 0.191). There were no differences between the right and left sides in the control group for the mean total volume of M+SC (p = 0.372), SCP+SPCL (p = 0.408) and SCM (p = 0.586), as well as for the total fatty infiltration volume of M+SC (p = 0.257), SCP+SPCL (p = 0.896) and SCM (p = 0.191).
Correlation analyses revealed a positive correlation between the NDI scores and the JFLS-20 (r = 0.831, p < 0.001), FAI (r = 0.815, p < 0.001) and NRS at rest (r = 0.753, p < 0.001) and during chewing (r = 0.686, p < 0.001) in the TMD group.
Discussion
To the best of our knowledge, this study is the first to investigate changes in the muscle volume and fatty infiltration of neck muscles in patients with TMD. We hypothesized that there would be differences in these parameters between patients with TMD and asymptomatic controls. This hypothesis is based on the premise that reductions in the muscle volume and increases in the fatty infiltration may impair motor function and power generation of neck muscles, potentially affecting the orofacial region due to physiological, neuronal, biomechanical, and anatomical connections between the craniofacial and cervical spine regions.2, 5, 6, 7, 8, 9 However, contrary to our hypothesis, we found that the muscle volume and fatty infiltration of the SCM, SPLC, SCP, SC, and M muscles were similar in patients with TMD and controls.
Previous studies have investigated neck muscle function in patients with TMD by evaluating muscle strength or endurance using clinical tests.5, 15, 17 These studies have reported a reduction in the endurance of the flexor neck muscles15 and a decline in the extensor neck muscles in patients with TMD.5 However, the strength of the extensor neck muscles was found to be similar between TMD patients and controls.17 Our findings can be compared with those of previous studies investigating fatty infiltration, muscle volume, or muscle cross-sectional area of neck muscles in other musculoskeletal conditions related to the neck, such as cervical myelopathy, neck pain, or whiplash-associated disorders (WAD).
Previous studies have reported greater fatty infiltration in the deep cervical muscles, including the SCP, M, SC, SCM, SPLC, and trapezius muscles in patients with WAD,35, 36, 37 cervical myelopathy,38 or chronic neck pain.39, 40 However, the results regarding changes in neck muscle morphology in patients with neck disorders are inconclusive. Some studies have reported a decrease in the cross-sectional area of extensor neck muscles in patients with WAD37 and chronic neck pain41, 42; conversely, other studies have indicated an increase in the cross-sectional area of neck muscles in patients with WAD43 or chronic neck pain.44 Previous studies have suggested that neck pain can cause changes in muscle morphology and muscle quality. Our results are in contrast with previous findings, possibly due to the level of neck disability observed in patients with TMD in the present study. Our study found higher neck disability scores in patients with TMD compared to controls, although nearly all patients with TMD had mild or moderate neck disability according to the NDI (scores ranged from 6 to 23).45 In contrast, previous studies have included patients with severe or complete neck disability (NDI > 25), suggesting that the morphology and quality of neck muscles may be affected only in individuals with severe neck disability.
Furthermore, we conducted side-to-side comparisons to determine whether the degree of fatty infiltration and muscle volume of the neck muscles were consistent across patients with TMD and the controls. No significant differences were observed in the fatty infiltration and volume of the neck muscles between the left and right sides in both patient groups. Similar results were reported in previous studies. Specifically, it was found that the fatty infiltration of the cervical extensor muscles in patients with WAD,36 the cross-sectional area of the extensor neck muscles in patients with WAD,43 the cross-sectional area of the M muscle in patients with chronic neck pain,42 and the cross-sectional area and fatty infiltration of the M muscle and short rotators in asymptomatic participants35 showed no significant differences between the left and right sides.
Similar to previous studies,46, 47, 48, 49 we observed higher neck disability scores in patients with TMD compared to the asymptomatic group. Furthermore, there was a strong correlation between the severity of neck disability and the severity of TMD, jaw-related disability, and pain severity in patients with TMD, indicating an association between neck-related symptoms and TMD-related symptoms. These results suggest that it may be useful to routinely assess neck-related problems in patients with TMD and address these problems in the treatment plan.
Similar to our results, Alves da Costa et al. reported a positive relationship between the severity of neck disability and pain severity in patients with TMD.46 However, Coskun Benlidayi et al. identified a weak correlation between the severity of neck disability and the TMD pain score.50 Moreover, Silveira et al. reported a strong correlation between jaw disability and neck disability in patients with TMD.51 Furthermore, de Abreu Figueirêdo et al. found a moderate positive correlation between TMD severity and the severity of neck disability.52 In contrast to our results, another study indicated that there was no correlation between the severity of neck disability and TMD pain severity in patients with TMD.53
Limitations
The present study had several limitations. Firstly, it was a cross-sectional study conducted at a single time point, thus causality could not be inferred from the findings. Secondly, nearly all participants with TMD included in this study had mild or moderate neck disability, as indicated by the NDI. The extent of neck muscle involvement may differ across patients with both TMD and severe neck disability. Furthermore, the study did not assess the strength or endurance of the neck muscles. Therefore, more information about the relationship between the cervical spine region and TMD could have been obtained if neck muscle strength or endurance had been examined and the relationship between the neck muscles and/or endurance and neck muscle fatty infiltration and volume had been analyzed. Lastly, the number of cases in this study was insufficient to determine the relationships between MRI results and other clinical outcomes, including the NDI, FAI, NRS, and JFLS-20.
Conclusions
The results showed no statistically significant differences in the volume of the SCM, SPLC, SCP, SC, and M muscles in the C3–C7 region between the patients with TMD and the controls. Furthermore, the degree of fatty infiltration of these muscles was similar in both groups. However, the TMD patients had higher neck disability scores compared to the control group. Moreover, the severity of neck disability was positively correlated with the severity of jaw-related disability, TMD pain severity and the severity of TMD. These results suggest that the cervical region should be evaluated in patients with TMD, and that interventions targeting this region should be included in TMD treatment programs.
Ethics approval and consent to participate
The study was approved by the Non-Interventional Clinical Research Ethics Board of Mersin University, Turkey (protocol No. 2019/567). Before the experiment, all subjects were informed about the nature of the study and their written informed consent was obtained.
Data availability
The datasets generated and/or analyzed during the current study are available from the corresponding author on reasonable request.
Consent for publication
Not applicable.