Abstract
Background. Despite the superiority of glass-ionomer cements (GICs) over composites in treating white spot lesions (WSLs), there is still a concern about their preventive and antibacterial properties. Efforts have been made to improve the strength of their bond to demineralized enamel, fluoride release and antibacterial properties by adding nanoparticles of chitosan, which seems to be a promising method.
Objectives. The aim of the present study was to assess the antibacterial effect, the microshear bond strength (µSBS) to enamel at the WSL area, and the fluoride and nano-chitosan release after modifying the polyacrylic acid liquid phase of a traditional GIC with different nano-chitosan volumes.
Material and methods. A total of 120 samples were prepared, and then divided into 4 groups (n = 30): G1 – non-modified GIC, which served as a control group, while G2, G3 and G4 were modified with different nano-chitosan volumes (50%, 100% and 150%, respectively). Microshear bond strength was assessed using a universal testing machine (UTM) after storage in distilled water for 24 h. Fluoride and nano-chitosan release was measured with the use of spectrophotometers at different time points (initially, and at 1 h, 24 h, 48 h, 72 h, 1 week, 2 weeks, 3 weeks, and 6 weeks) after storage in distilled water. The antibacterial effect against the Streptococcus aureus strain was assessed with the agar diffusion test. The data was statistically analyzed.
Results. After 24-hour storage, G2 recorded a slight, yet non-significant, increase in the µSBS values (4.1 ±0.94 MPa) as compared to G1 (3.9 ±1.30 MPa). With regard to fluoride release, the amount recorded for G1 was significantly greater at the end of the 24-hour storage period (0.70 ±0.30 µmf/cm2) than modified nano-chitosan GIC groups; G1 was followed by G4 (0.54 ±0.34 µmf/cm2). The highest amount of nano-chitosan release after 24-hour storage was noted for G3 (0.85 ±0.00 µmf/cm2). The highest inhibition zone value was recorded for G2.
Conclusions. Glass-ionomer cement modified with 50% nano-chitosan was shown to positively affect µSBS and the antibacterial effect, while modification with 150% nano-chitosan significantly increased fluoride release.
Keywords: preventive, glass-ionomer, nano-chitosan, antibacterial, initial caries
Introduction
White spot lesions (WSLs) are areas of non-cavitated sub-surface demineralization, which are considered initial caries. Initial enamel caries is due to bacterial activity that leads to demineralization and causes micro-porosities between enamel rods. The refractive index is altered and enamel translucency decreases, showing chalky white marks on enamel surface, with darker patches.1 White spot lesions occur as a result of fixed orthodontic treatment. Thus, it is mandatory for a treatment protocol for these patients to have additional steps to manage WSLs during and at the end of the treatment.2
Many approaches have been used to manage WSLs, such as topical fluoride application, in which the structure of the tooth is altered due to fluoroapatite, thus becoming more resistant to caries. Another approach consists in compensating for the loss of minerals by utilizing fillings capable of mineral release. Other approaches manage the already defected part by utilizing composite restoration, or combining the effects of restoration and preventing further decay activity by utilizing glass-ionomer restorations.3
Many investigations conducted over the last 2 decades have shown that glass-ionomer cements (GICs) are superior to resin composites in managing the decalcification of WSLs due to their anti-cariogenic activity through fluoride release.4 However, GICs have some drawbacks related to their greater sensitivity to water contamination, brittleness and poorer mechanical characteristics as compared to resin composites.1
To overcome some of these limitations, GICs have undergone significant alteration through incorporating various additives, such as zirconia, glass fibers, hydroxyapatite, bioactive glass particles, and casein phosphopeptide-amorphous calcium phosphate (CPP-ACP).5 Glass-ionomer cements have antibacterial qualities owing to their low pH during the setting reaction as well as fluoride release by ion leaching, lowering demineralization, enhancing remineralization, and preventing the development of pellicles and biofilm, and bacterial metabolism and growth. However, the antibacterial efficacy of traditional GICs is still insufficient with regard to the adhesion, cell viability and biofilm formation of Streptococcus mutans.6 As a result, clinical advantages may be obtained by combining antibacterial additives or modifiers with traditional GICs without sacrificing their mechanical and physical properties, fluoride release, and adhesion to hard tooth structures.7
Chitosan is a naturally occurring linear biopolyaminosaccharide produced by alkaline deacetylation of chitin found in crab and shrimp shells. It is widely used as a biopolymer. Chitosan is a weak base that is insoluble in water and organic solvents, but it may be dissolved in diluted aqueous acidic solutions like acetic acid. It is also characterized by biodegradability, biocompatibility, muco-adhesion, and a broad range of antibacterial and antibiofilm capabilities against both Gram-positive and Gram-negative microorganisms.8, 9 Meanwhile, pharmaceutical companies frequently employ nanosized chitosan formulations as medication delivery systems. It has been suggested that nanoscale chitosan (nano-chitosan) particles may have an advantage over larger chitosan particles due to their increased surface area and charge density, which may improve their interaction with the medium (i.e., tooth surface).10
Therefore, the present study aimed to investigate the effect of modifying the polyacrylic acid (PAA) liquid phase of a traditional GIC with different nano-chitosan volume content on microshear bond strength (µSBS) to enamel at the WSL area, fluoride and nano-chitosan release, and antibacterial properties in comparison with a traditional GIC. The null hypotheses were that the highest nano-chitosan volume GIC would be superior in all of the following: (1) µSBS of GIC to the enamel lesion; (2) fluoride and nano-chitosan release; and (3) antibacterial properties.
Material and methods
Nano-chitosan was prepared from chitosan (medium-molecular-weight deacetylated chitin, poly-D-glucosamine 75–80% deacetylation; Sigma-Aldrich, St. Louis, USA). First, a 1% aqueous acetic acid solution was prepared. Then, 0.7 mg of nano-chitosan powder was magnetically stirred in 100 mL of the aqueous acetic acid solution for 24 h at room temperature. The pH value was adjusted to 3.7 with the Tris hydroxymethyl amino methane HCl buffer. The nano-chitosan solution was properly sealed and stored in a refrigerator until needed for addition to the GIC (Promedica Dental Material, Neumünster, Germany).8, 10
Study design
A total of 120 samples were prepared, of which 80 samples were disk specimens for material preparation, and the remaining 40 samples were human permanent premolar teeth. The samples were divided into 4 equal groups (n = 30), taking into account the amount of GIC powder divided by the PAA liquid to nano-chitosan ratio of the utilized GIC. According to the manufacturer’s instructions, 0.12 mg of powder was mixed with 0.5 mL of PAA liquid (1/1 V) to prepare the control GIC (CGIC) disks (the control group G1). The cement was manually mixed using a spatula on a paper pad. One volume of PAA liquid was substituted by adding different chitosan solutions (0.125 mL, 0.250 mL and 0.375 mL) and was mixed with 1 volume of CGIC powder to form different investigated groups: G2: 1/(1:~0.5 V); G3: 1/(1:1 V); and G4: 1/(1:1.5 V), i.e., nearly 50%, 100% and 150% by volume nano-chitosan-modified GIC for groups G2, G3 and G4, respectively. Group G1 (conventional glass-ionomer powder/PAA liquid (1/1 V)) served as a control group,
Each group was then further subdivided into 3 equal subgroups according to the test utilized (n = 10): SG1 – µSBS test; SG2 – fluoride and nano-chitosan release; and SG3 – bacterial culture.
Selection of the teeth
A total number of 40 caries-free human permanent premolar teeth extracted for orthodontic purposes were utilized.11 The teeth were carefully checked, then rinsed with water and scaled with a periodontal scaler to remove any blood, attached periodontal tissues, plaque, and calculus. To avoid microbial growth, they were kept in an incubator with distilled water and 0.5% thymol.12
Production of artificial enamel white spot lesions
Teflon rings (15 mm in height and an internal diameter of 38 mm) were utilized to mount the selected teeth vertically in acrylic resin blocks.13 An enamel window (3 × 3 mm) was scratched in the middle of cervical one-third on the buccal surface of the tooth, utilizing a diamond stone size 12 with gentle pressure and abundant irrigation. To achieve a consistent standard surface, enamel surfaces were hand-polished in a clockwise circular motion, using silicon carbide paper (grit 240, 400 and 600) for 30 s each under copious water coolant. Before applying the cement, the scratched enamel surfaces were treated with PAA for 30 s.14
Microshear bond strength test
Specimen fabrication
A transparent polyethylene tube obtained from a scalp vein infusion set (23 G; JMS Singapore, Singapore) was cut into small tubes ~0.75–1-millimeter-long, using a sharp lancet. The transparent polyethylene tubes (an external diameter of 2.35 mm and an internal diameter of 0.93 mm) were utilized to help in loading GIC and different modified nano-chitosan sample types with a small condenser (Primadent, Germany) in slight excess from the side to be bonded to tooth enamel.15
After the cement was fully hardened, the polyethylene tubes were carefully removed by lancet No. 11, leaving the cement micro-cylinders bonded to enamel surfaces. Then, the samples were checked using a magnifying glass ×6 for any defects or air bubbles. The bonded specimens were kept in an incubator with distilled water for 1 day.16
Specimen testing
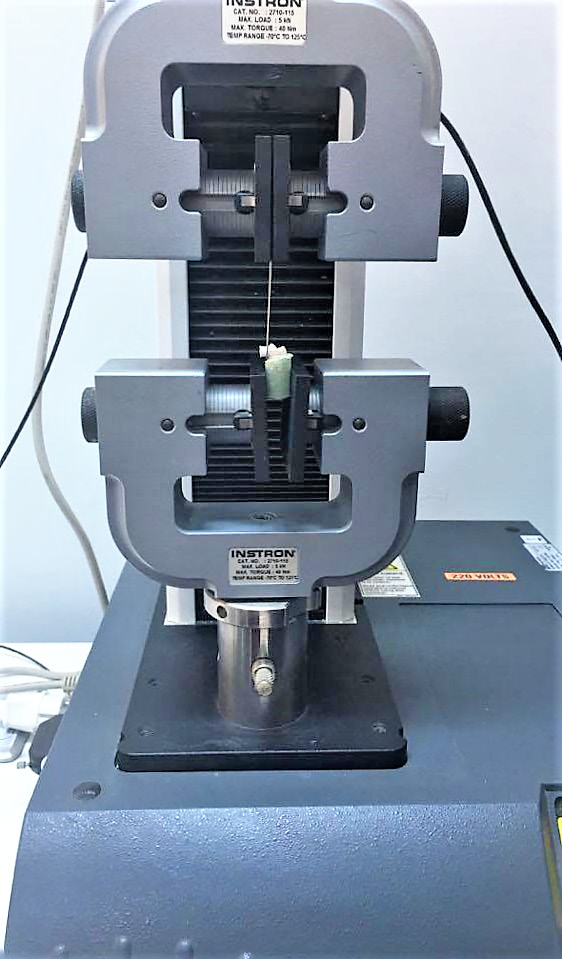
After 24 h of storage, 4 tightening bolts were utilized to secure each specimen with its bonded GIC micro-cylinder to the lower half of a specifically designed attachment. The universal testing machine (UTM) had lower fixed and upper movable compartments (model LRX Plus; Lloyd Instruments Ltd., Fareham, UK), which were utilized to adjust the attachment jig with screws, with a load cell of 5 kN. The bonded GIC micro-cylinders were secured tight at their bases by utilizing a wire loop made from orthodontic stainless steel ligature wire (180 µm in diameter).17
Microshear load was applied by the tensile mode of force, utilizing the testing equipment with a crosshead speed of 0.5 mm/min (Figure 1). Computer software was used to record the data (NEXYGEN™ MT; Lloyd Instruments Ltd.).18 Microshear bond strength was then calculated in megapascals by dividing the load at failure [N] by the bonding area [mm2].17 The calculated results were tabulated and statistically analyzed.
Determination of fluoride and nano-chitosan release
Sample preparation
Cement disks (10 mm in diameter, 1.5 mm in thickness) were prepared utilizing a Teflon mold at room temperature (23 ±1°C) and controlled relative humidity (50 ±5%) according to ISO specification #9917-1:2007.19 After the infusion of the cement into the mold, nylon thread was introduced into each cement disk during packing to allow suspension in the test medium.20
The surface of the cement materials was covered with Mylar strips and held between 2 glass slabs under constant finger pressure to expel excess cement, and allowed to set inside the mold for 20 min through chemical curing. Then, they were removed from the molds.6
Storage medium
Each disk was suspended vertically by nylon thread, and then immersed in a polyethylene vial containing 10 mL of deionized water for 6 weeks. Measurement readings were taken at different time intervals: initially, and at 1 h, 24 h, 48 h, 72 h, 1 week, 2 weeks, 3 weeks, and 6 weeks.21
Sample measurements
Fluoride release measurement
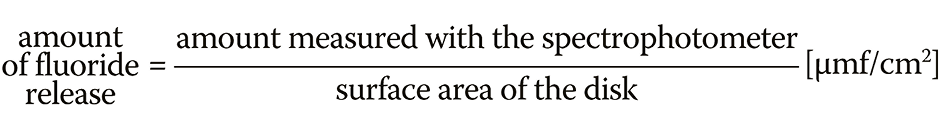
To determine the amount of fluoride release, a spectrophotometer with a fluoride ion-specific electrode (2007 Edition 2; Hach Company, Berlin, Germany) was connected to an ion digital analyzer for fluoride release reading at different time intervals. The amount of fluoride release was then calculated according to the following formula (Equation 1)22:
Nano-chitosan release measurement
To assess the amount of nano-chitosan release at the different time intervals, an ultraviolet (UV) double-beam spectrophotometer (LAMBDA™; PerkinElmer, Boston, USA) was utilized. The maximum absorbance color was recorded at 254 nm at wavelengths of 190–800 nm.23, 24 The concentration of nano-chitosan released in distilled water was calculated using the Beer–Lambert law (Equation 2)25:
where:
A – absorbance [A.U.];
ε – molar absorptivity [L·mol–1·cm–1];
b – path length of the beam in the absorbing medium [cm]; and
c – concentration of the absorbing species [M].
Bacterial culture test
Using the agar diffusion technique, disks from each cement mixture group were subjected to bacterial testing for Staphylococcus aureus (ATCC 25922), which was cultured on Muller–Hinton Broth, and then incubated at 37°C for 18 h. All cement mixture disks were sterilized with UV before the subsequent procedure.26
Bacterial suspension was vigorously agitated with a vortex mixer just before use. Then, saline was added gradually with matching turbidity, equivalent to a 0.5 McFarland standard.27 The Muller–Hinton agar in the amount of 30 mL was spread to a thickness of 2 mm in Petri dishes (10 cm in diameter). Muller–Hinton Broth containing S. aureus was cultured over the Muller–Hinton agar.28
Four standard GIC mixture disks were placed within the agar, using fine-pointed sterile forceps. The disks were pressed firmly to ensure complete contact with the agar. After the incubation of the plates at 37°C for 24h, the degree of sensitivity was determined by measuring the easily visible and clear zone of inhibition produced by the diffusion of the antimicrobials from the disks into the surrounding medium. Finally, the sizes of inhibition zones were calculated by subtracting the diameter of the specimen from the average of the 5 halo measurements.26
Statistical analysis
All the collected data was statistically analyzed. The data is presented as mean and standard deviation (M ±SD). The repeated measures analysis of variance (ANOVA) was used to compare between the different tested groups and follow-up periods for all parameters, followed by pairwise comparison with the Bonferroni correction. The significance level was set at p ≤ 0.05. Statistical analysis was performed with IBM SPSS Statistics for Windows, v. 25.0 (IBM Corp., Armonk, USA).
Results
Microshear bond strength
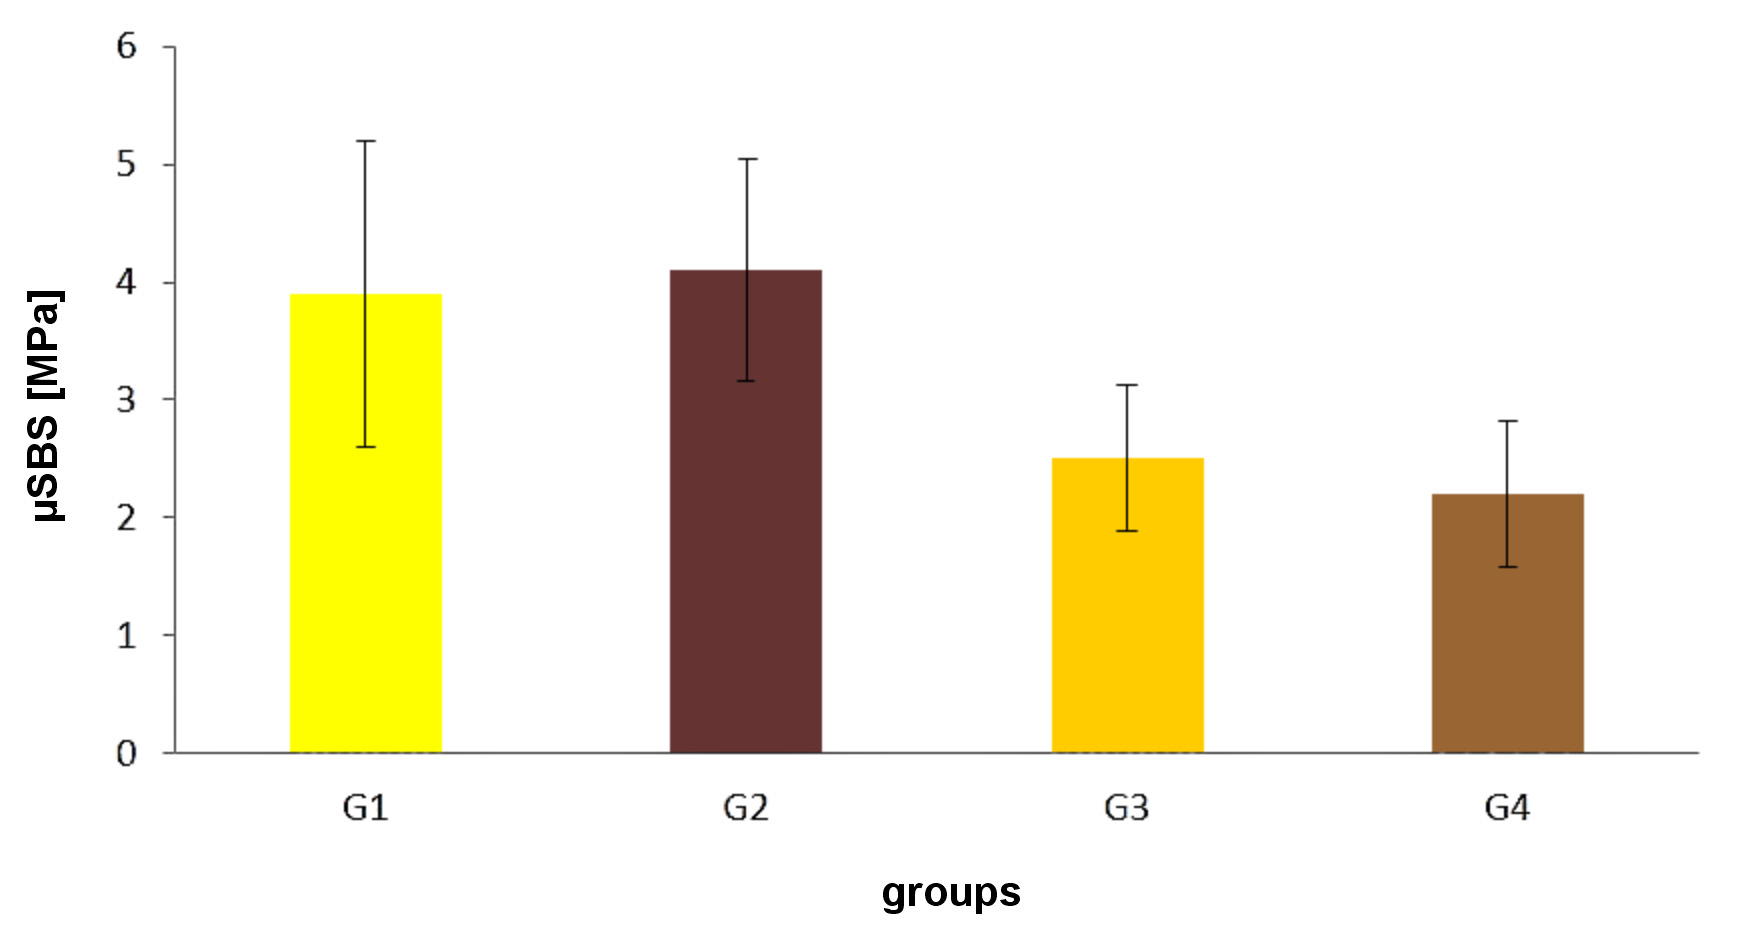
The results of the µSBS test for different investigated groups are presented in Table 1 and Figure 2. After 24 h of storage, the enamel structure of G2 showed a slight, yet non-significant, increase in the µSBS values (4.1 ±0.9 MPa) as compared to G1 (3.9 ±1.3 MPa), whereas G3 and G4 recorded significantly smaller µSBS of their enamel structure (2.5 ±0.62 MPa and 2.2 ±0.62 MPa, respectively). However, statistical analysis revealed no significant differences between both groups.
Rate of fluoride release
The results of the rate of fluoride release after immersion and storage in a distilled water solution at different time intervals (initially, and at 1 h, 24 h, 48 h, 72 h, 1 week, 2 weeks, 3 weeks, and 6 weeks) for different investigated groups are presented in Table 2.
Group G1 recorded a significantly greater rate of fluoride release initially (1.70 ±0.21 µmf/cm2) and at the end of the 24-hour storage period (0.70 ±0.30 µmf/cm2) than the modified nano-chitosan GIC groups. Among the latter, G4 recorded the greatest amount of fluoride release after 24 h (0.54 ±0.34 µmf/cm2), followed by G3 (0.40 ±0.90 µmf/cm2); G2 recorded the lowest fluoride release (0.30 ±0.20 µmf/cm2).
The minimum rate of fluoride release was recorded in the period between 48 h and 1 week from immersion for all the investigated groups.
The maximum rate of fluoride release was recorded after 2 weeks from immersion for G1, G2, G3, and G4 at 4.31 ±0.74 µmf/cm2, 4.13 ±0.75 µmf/cm2, 4.37 ±0.76 µmf/cm2, and 4.15 ±0.68 µmf/cm2. Changes in the fluoride release rate for the samples immersed for 2 weeks as compared to 3 weeks were non-significant.
Rate of nano-chitosan release
The results of the rate of nano-chitosan release after immersion and storage in a distilled water solution at different time intervals (initially, and at 1 h, 24 h, 48 h, 72 h, 1 week, 2 weeks, 3 weeks, and 6 weeks) for different investigated groups are presented in Table 3.
The highest amount of nano-CS release was recorded for G3 – initially (1.09 ±0.00 μmf/cm2) and after 24 h (0.85 ±0.00 μmf/cm2). Groups G2 and G4 recorded the lowest amount of nano-chitosan release; they also showed the same values – initially (0.53 ±0.01 μmf/cm2) and after 24 h (0.60 ±0.00 μmf/cm2).
After 1 week, the rate of nano-chitosan release was constant for all the investigated groups (0.30 ±0.00 μmf/cm2, 0.30 ±0.00 μmf/cm2 and 0.78 ±0.00 μmf/cm2 for G1, G2 and G3, respectively).
The minimum rate of nano-chitosan release was recorded after 6 weeks from immersion, with significant differences in regard to different immersion periods (0.03 ±0.00 μmf/cm2, 0.03 ±0.00 μmf/cm2 and 0.01 ±0.00 μmf/cm2 for G1, G2 and G3, respectively.
Antibacterial test
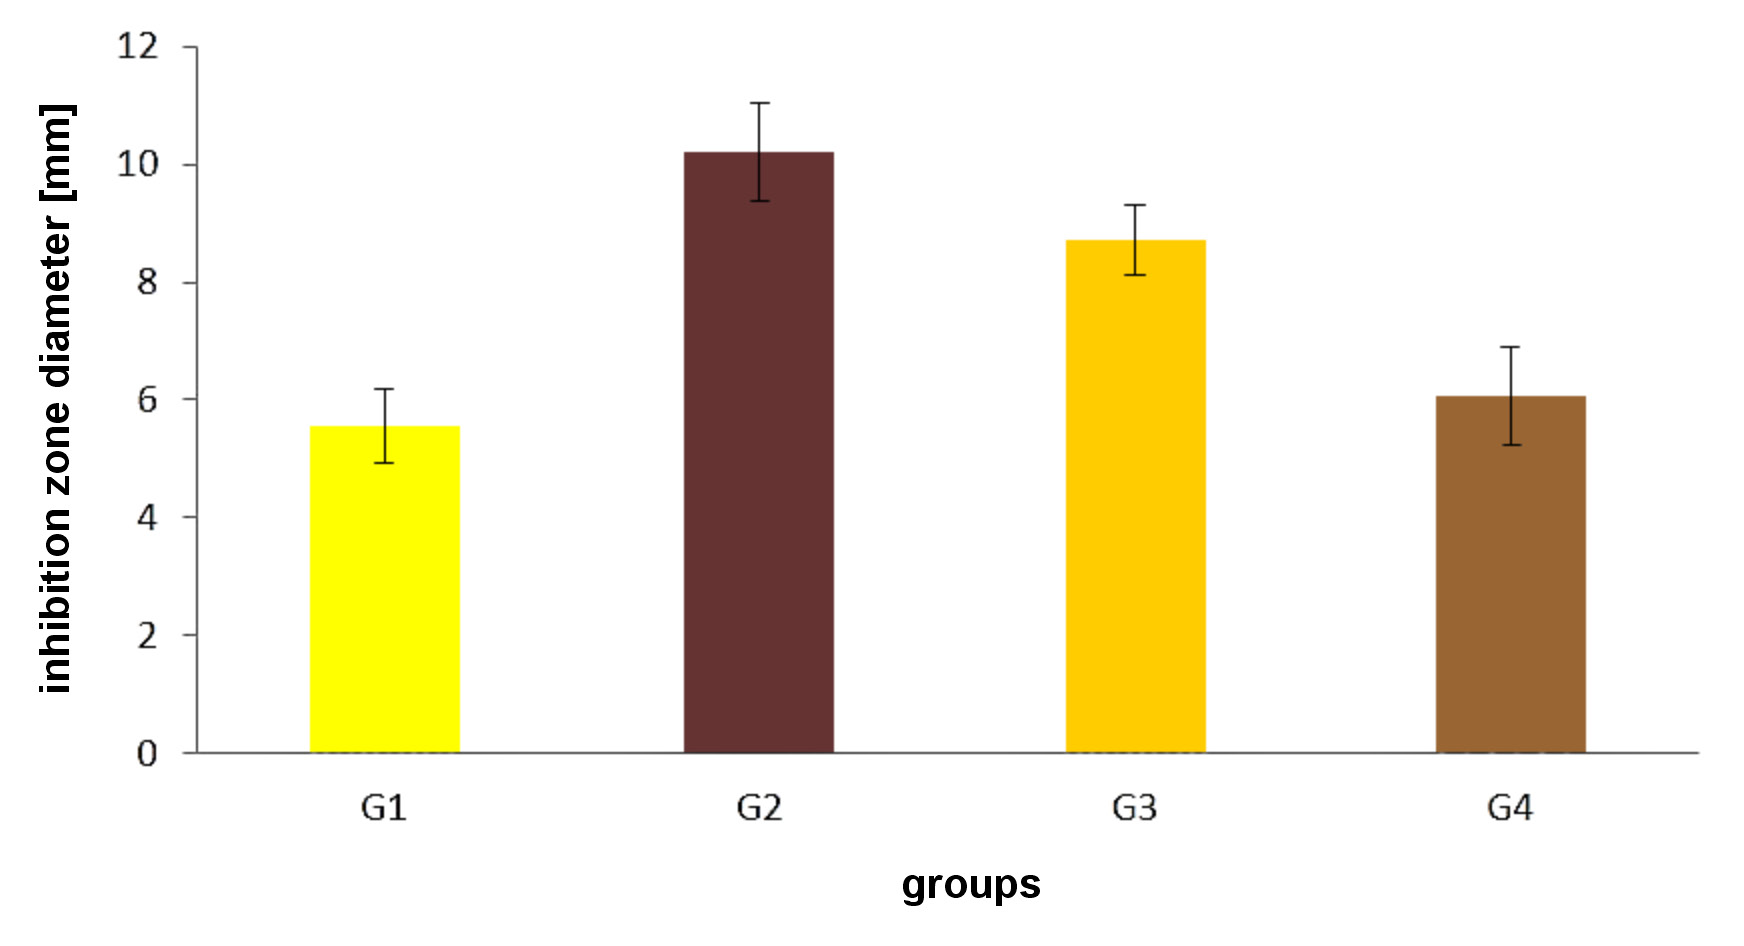
The results of the antibacterial test for S. aureus for different investigated groups are presented in Table 4 and Figure 3. Statistical analysis revealed the highest value of the inhibition zone for G2 (10.20 ±0.83 mm), followed by G3 (8.70 ±0.62 mm). Groups G1 and G4 had the smallest inhibition zones of 5.56 ±0.63 mm and 6.08 ±0.81 mm, respectively.
Discussion
Glass-ionomer cements are extensively utilized in dentistry for restoring and preventing WSLs because of their unique characteristics. Nano-chitosan is one of the recent additives hybridized with traditional GICs to improve their antibacterial activity and remineralization potential, without sacrificing their mechanical and physical properties, fluoride release, and adhesion to hard tooth structures.8
According to certain theories, nano-chitosan particles, which were utilized in this study, may interact with the medium more effectively than larger chitosan particles because of their greater surface area and charge density. Moreover, these properties encourage the usage of nano-chitosan as a preventive and therapeutic agent to manage dental caries due to its powerful antibacterial activity against oral biofilm, particularly S. mutans.29, 30 Therefore, the present study aimed to investigate the effect of modifying the liquid phase of a traditional GIC with different nano-chitosan volume content on µSBS to enamel at the WSL area, fluoride and nano-chitosan release, and antibacterial properties.
In the present study, the µSBS test was used as a substitute for the conventional shear test in agreement with Banomyong et al., who replaced the blade with a looped orthodontic wire, as stress distribution in the µSBS test is more concentrated at the interface, reducing the risk of cohesive failure in materials that do not have reliable adhesion at the interface.31 Generally, similar µSBS has been reported with regard to dentin when comparing chitosan-modified and traditional GICs.32, 33, 34 Moreover, GIC bonding to enamel is an important aspect in determining the strength of the bond between the material and WSLs. Nevertheless, there are very limited published works available in the dental literature assessing the bonding of modified GICs to enamel.32
Therefore, in this study, the 1st objective was to examine the influence of modifying GIC liquid with nano-chitosan on µSBS as compared to an unmodified GIC. Any GIC modification must not compromise its capacity to adhere to enamel and/or dentin.33 The 1st null hypothesis of this study is rejected, since the addition of 50% v/v nano-chitosan to a traditional GIC improved the µSBS of the GIC to enamel WSLs. In the current study, the µSBS test revealed that the GIC modified via the incorporation of 50% nano-chitosan (G2) resulted in slightly, but non-significantly increased values as compared to the traditional GIC (G1) (4.1 ±0.94 MPa and 3.9 ±1.30 MPa, respectively) (Table 1, Figure 2). These results are in agreement with Karthick et al., who found that the µSBS of 50% v/v chitosan-modified GIC was higher than in the case of a traditional GIC.34 It might be due to the presence of polar and ionic reactivity between the carboxylic groups of PAA and hard tooth surfaces. More PAA chains would diffuse into enamel to displace the phosphate and calcium ions from hydroxyapatite crystals, since chitosan is a powerful chelating agent.33, 34 In their recent study, Patel et al. notices that chitosan chains include several acetamide and hydroxyl groups that can bind with the hydroxyl groups of GIC particles and the carboxyl groups of PAA by hydrogen bonding interaction.11 The network produced by chitosan and PAA around inorganic GIC particles may lower the interfacial tension among GIC components, which can enhance or maintain its mechanical characteristics. One may postulate that NPs with lower particle sizes may operate as fillers after the GIC has set, filling the empty microscopic gaps between the larger unreacted GIC glass particles and providing extra bonding sites for the polyacrylic polymer, thereby reinforcing the GIC set material.35
Conversely, when nano-chitosan content increased to 150% v/v (G4), µSBS decreased (2.2 ±0.62 MPa) (Table 1, Figure 2). This might be due to the segregation of chitosan chains with increasing chitosan content; they interact with each other, and no longer with PAA and/or GIC particle surfaces in addition to tooth calcium and phosphorus. These results are consistent with those of previous studies by Petri et al.,30 Ibrahim et al.32 and Karthick et al.34 In addition, it is possible that increasing nano-chitosan content to 150% v/v (G4) results in the mechanical weakening of GIC rather than the failure of chemical bond formation to hard tooth structures.32 This might be attributed to the agglomeration of NPs and the occupation of all free charges, which can lead to a rapid increase in viscosity that results in dimensional changes in the set cement. Such changes may lead to the formation of cracks and the loss of marginal adaptation due to the development of contraction stress on the tooth wall. Consequently, water sorption increases, which in turn decreases bond strength.36 Although GIC bonding to enamel is crucial in determining the bond strength of the material, enamel and nano-chitosan-modified GICs show adhesive bonding failure, with no cohesive failure.33
One of the milestones in suppressing further growth of caries at WSLs was implementing fluorides as an anti-cariogenic agent. Fluoride has been shown to reduce demineralization and promote remineralization. Furthermore, secondary caries was observed to be greatly reduced. The anti-cariogenic impact of fluoride-releasing restoration is determined by the amount and duration of fluoride release.1 Therefore, in this study, the 2nd objective was to examine the influence of modifying GIC liquid with nano-chitosan on fluoride and nano-chitosan release, and to compare it to a traditional GIC. The 2nd null hypothesis of this study is partially accepted, since the addition of high concentrations of nano-chitosan to a traditional GIC increased fluoride release as a function of time.10
The results of the present study showed a significantly greater rate of fluoride release by traditional GIC samples (G1) as compared to the nano-chitosan-modified GIC groups (G2–G4) (Table 2). The G1 samples had an initial release rate of 1.70 ±0.21 µmf/cm2 and a rate of 0.70 ±0.30 µmf/cm2 after 24 h. These results could be due to the lower pH value initially and after 24 h. Additionally, these findings resemble the “burst effect” from a traditional GIC described by De Almeida Brandão Guglielmi et al.4 and Panpisut and Toneluck,21 who found that an acid-base reaction causes early fluoride release from a GIC, with the amount of fluoride released proportional to the fluoride concentration in the material. The “burst effect” is characteristic of large concentrations of fluoride being released within the first 2 days.
After 24 h, G4 recorded the highest fluoride release rate (0.54 ±0.34 µmf/cm2), followed by G3 (0.40 ±0.90 µmf/cm2). Group G2 recorded the lowest fluoride release rate (0.30 ±0.20 µmf/cm2) (Table 2). The addition of nano-chitosan may have increased the burst action of the released fluoride.10, 30 These results are in agreement with Kumar et al., who found the addition of nano-chitosan to a GIC to have a catalytic effect on fluoride release, thereby aiding the rapid diffusion of fluoride through the GIC matrix.10 In addition, the entropic gain associated with fluoride emission could explain the catalytic action. Since the entropy associated with small ions diffusing into the medium is always greater than that associated with free macromolecules in the solution, the adsorption of a polymer that causes the displacement of small ions always moves the system to a more favorable energy condition.30 According to Kim et al., GICs containing chitosan increase the water sorption value and increase the diameter of the reacted structure.37 Consequently, the increased friction of the electrostatic charge with repulsive action leads to temporarily stable conditions for fluoride ion bursting. The minimum rate of fluoride release was recorded in the period between 48 h and 1 week from immersion for all the investigated groups (Table 2). These findings can be explained by the fact that the fluoride level is controlled by diffusion that is accompanied by a reduced concentration, which is linear to the square root of time. Therefore, the initial high concentration of fluoride rapidly decreased after 48 h before dropping quickly during the 1st week and eventually stabilizing. These findings are in accordance with Panpisut and Toneluck21 and Baroudi et al.38
The addition of nano-CS to a traditional GIC enhanced its antibacterial activity, positively affecting the anti-cariogenic effect and antibiofilm capabilities. The antibacterial activity of nano-chitosan is linked to its molecular weight and viscosity. Low- and medium-molecular-weight nano-chitosan with low and medium viscosity infiltrates into the bacterial cell and attaches to the microbe DNA, preventing transcription and subsequent translation, and causing bacterial death.35 The S. aureus strain is one of the most important Gram-positive pathogen involved in dental caries.28 Therefore, it was selected as a model bacterial strain examined in this study. The 3rd hypothesis of this study that an increased nano-chitosan concentration would enhance the antibacterial effect in comparison with a traditional GIC was not confirmed.
Among all groups, the greatest inhibition zone against S. aureus was recorded for G2 (10.20 ±0.83 mm). Group G4 revealed the smallest zone of inhibition (6.08 ±0.81 mm) (Table 4, Figure 3). This might be attributed to the lesser segregation of the polymer chain (nano-chitosan) and a high amount of free, unattached negative charges in G2. According to Ibrahim et al.35 and Thurnheer and Belibasakis,39 the unattached charges can bond easily to the positive charges of the bacterial cell wall, penetrating the DNA of S. aureus and damaging the hydrophobic bacterial cell wall. Since Gram-positive bacteria have a simple cell wall – only a stiff peptidoglycan layer with large holes present – it is easy for foreign substances to enter the cells. Hence, the interaction between the attached polymers and the charged membrane facilitates the destruction of microbes. Moreover, Zeimaran et al. demonstrated a network with plenty of pores inside the peptidoglycan layer of the cell wall of S. aureus.40 So, nano-chitosan could enter the cell without difficulty via penetrating through the cell wall.
On the other hand, increasing the amount of nano-chitosan decreased the number of negative charges due to the segregation of the polymer chain.30, 32, 33 Hence, the inhibition effect on the bacterial cell wall decreased, as shown in G3 and G4 (Table 4, Figure 3). Even though G3 and G4 recorded the highest amount of fluoride release, they showed a weaker antibacterial effect as compared to G2. This might be attributed to the nature of the released fluoride. The fluoride ion is bonded to the cationic groups of chitosan. Fluoride ions block free sites on chitosan. These results are supported by a higher amount of nano-chitosan release for those groups. The synchronization of fluoride and nano-chitosan release depressed the antibacterial effect. These findings are in agreement with previous research performed by Ibrahim et al.35 and Thurnheer and Belibasakis.39
Limitations
This in vitro research has certain limitations. The oral cavity is constantly subjected to dynamic stresses, mastication wear and pH changes caused by consuming various meals and beverages. Further research is needed to assess nano-chitosan-modified GICs in such dynamic settings, utilizing a larger sample size and a longer observation period. In addition, from a geometrical standpoint, the disks utilized do not entirely resemble a dental restoration.
Conclusions
Within the limitations of this study, the following conclusions can be drawn:
The addition of nano-chitosan (v/v) to a traditional GIC up to 50% of PAA liquid has been shown to increase the µSBS of the affected enamel surfaces and the antibacterial effect against S. aureus, which could potentially help to reduce the risk of secondary caries after restoring the enamel defect.
The synergistic effect of the nano-chitosan-modified GIC 150% (v/v) of PAA liquid significantly increased fluoride release, which might improve remineralization capacity while adversely impacting the antibacterial effect.
Ethics approval and consent to participate
The present study was approved by the Medical Research Ethics Committee (ref. No. 03/06/2022) at the Faculty of Oral and Dental Medicine, Nahda University, Beni Suef, Egypt.
Data availability
The datasets generated and/or analyzed during the current study are available from the corresponding author on reasonable request.
Consent for publication
Not applicable.