Abstract
Background. Diagnosis in dentistry begins with the correct reading and interpreting of the dental radiograph.
Objectives. The aim of the present study was to examine the effects of the imaging technique used, the dentistry specialty and the years of experience on the gray-level perception among dentists.
Material and methods. A custom web application was developed. Dentomaxillofacial radiologists (DentRads), endodontists (Ends) and general dental practitioners (GDPs) were invited via e-mail to participate in the study. A total of 46 participants met the requirements of the test. The test comprised 2 webpages. On the 1st page, the participants were asked for information such as gender, specialty, the years of experience, and the imaging techniques they used. Then, on the 2nd page, they were welcomed with instructions and directions, and asked to rearrange 85 gray color tones represented by square bars of equal dimensions. These mixed gray bars were placed in 4 rows according to the principles of the Farnsworth–Munsell 100-hue test (FM). Each clinician’s test results were recorded in a database. The individual’s level of recognition of gray tones was evaluated through the total error score (TES), which was calculated using a web-based independent scoring software program. Lower TES values were a desirable result, indicating fewer misplacement, while higher scores indicated more misplacements of gray tones. The testing time (TT) was recorded automatically.
Results. The years of the participants’ experience as dentists or specialists did not affect TES or TT. The dentists who used the charge-coupled device-complementary metal oxide semiconductor (CCD-CMOS) had lower TES values than those who used analog radiographs (p < 0.05).
Conclusions. While the specialty and the years of experience did not affect the clinicians’ ability to recognize gray tones, the digital imaging techniques (photostimulable phosphor (PSP) and CCD/CMOS) could improve the clinicians’ gray-level perception.
Keywords: grayscale, dental radiology, contrast resolution
Introduction
Dental radiology procedures are among the most necessary and common ones in modern dentistry; they are used for the diagnosis of apical and periapical abnormalities, treatment plans, supporting treatment, the evaluation of care, and forensic situations.1 Therefore, radiographic image interpretation plays an important role at the forefront in all branches of dentistry before, during and after treatment. The ability to identify subtle differences in grayscale images, combined with good knowledge of anatomy, often leads to a successful diagnosis.
Contrast resolution is defined as the number of possible shades of gray that a pixel can carry, which also expresses the bit depth. Digital images have a bit depth from 8 (256 shades of gray) to 16 (65,536 shades of gray).2 However, even if the monitor has a wide contrast range, the observer may not be able to perceive details.3 One of the most recognized methods in medical imaging used to measure the limits of the human visual system (HVS) is Barten’s model.4 It comprises a series of experiments at different luminance levels that characterize the contrast sensitivity of HVS. Based on Barten’s model, a calibration standard has been described for medical imaging monitors. The standard, called Digital Imaging and Communication in Medicine (DICOM®) Grayscale Standard Display Function (GSDF), states the precise display luminance that should be produced for a given input value.4
The GSDF provides that different monitors can be set to have the same grayscale response, resulting in the improvement of the perceptual linearity of observers.3 While GSDF calibration in medical-grade grayscale monitors is accomplished during the manufacturing process, for consumer-grade monitors, the calibration may be achieved with medical application software.5 However, considering that clinical dental practice requires relatively high room illuminance, and that medical-grade monitors and the additional software are costly, dental radiographs are most often interpreted on consumer-grade monitors.6 Furthermore, most of the affordable and practical imaging monitors support only 8 bits.4 Therefore, GSDF has not been greatly implemented.
In dentomaxillofacial radiology, contrast resolution refers to the dental image quality in terms of clear differences in gray shades with regard to enamel and dentin, root canal morphology, the pulp system, the marginal bone levels, air, and the trabecular bone pattern.7, 8 Diagnosing root fractures, resorptions or fractured root canal instruments, and determining the working length or accessory canals are some of the challenging radiological tasks for dentists, requiring the ability to differentiate fine details. In addition, the correct interpretation of the root canal system in terms of canal morphology and number of canals is fundamental for the successful outcome of endodontic therapies.8, 9 Thus, contrast sensitivity is an important competence when evaluating dental radiological images.10 Ganesan et al. concluded that the observer’s experience has a great impact on their visual search pattern.11
To evaluate the quality of the radiographic imaging system, there are some suggested methods, such as the perceptibility curve tests or the receiver operating characteristic (ROC) curve tests.12 However, when it comes to evaluating the perception of the observer, there is no quantitative study in the literature that assesses the ability of dentists to differentiate gray tones. The Farnsworth–Munsell 100-hue test (FM) is widely used for color discrimination, including 85 colored caps.13 The accuracy of the observer in arranging the caps (forming a gradual transition in chroma) is gauged with the total error score (TES). The TES increases with the number of misplacements. Starting from this point, the authors of the present study claim that FM, which provides a numerical score, might be modified for the discrimination of gray tones.
Diagnosis in dentistry begins with the correct reading and interpretation of the dental radiograph.14 All dentists, whether specialists or not, use radiographs in their clinical routines. However, some branches of dentistry use radiographs not only for diagnosis, but also in all process steps. Endodontists (Ends) use radiographs pre-, during and post-treatment. Dentomaxillofacial radiologists (DentRads) routinely focus on normal and pathological differences on the scans obtained with cone-beam computed tomography (CBCT) and all other radiographic imaging systems in daily clinical practice. To the best of the authors’ knowledge, no studies have evaluated the ability of dentists to interpret contrast resolution. Therefore, the present study aimed to examine the influence of the imaging technique used, the dentistry specialty and the years of experience on the ability to perceive gray tones among dental professionals, as well as the testing time (TT). The null hypotheses were as follows:
1. There is no difference in the perception of gray tones and TT between the dentistry branches.
2. Neither the years of experience nor the imaging techniques used by clinicians have an effect on the interpretation of contrast resolution.
Material and methods
This laboratory study was conducted according to the Preferred Reporting Items for Laboratory studies in Endodontology (PRILE) 2021 guidelines.15 The study was approved by the institutional ethics committee at Istanbul Okan University, Turkey (approval No. 21.10.2020/24).
This research was a web-based study. Prior to the main study, 3 pilot studies were carried out. In the 1st and 2nd pilot studies, the participants were asked to rearrange 32 or 64 gray color bars from white to black. It was shown that they all reordered whitish and blackish colors almost faultlessly, but had problems arranging light to dark gray colors. Based on the outcomes of the pilot studies, the main study was reconstructed focusing on gray tones, which were a major problem for dentists. Then, the 3rd pilot study was applied to 20 people under the conditions of the main study, using 85 gray tones selected consequently (22–106) from a 128-tone (7 bits/pixel) grayscale. Afterward, the web page was blocked, and the pilot study was concluded. A reliability test was performed. Considering the coefficient of correlation between the TES and TT values as a result of the 3rd pilot study (ρ = −0.581), the minimum number of participants to be included, with 95% confidence (1−α) and 95% test strength (1−β), was determined to be 27.
In light of these data, the individuals who participated in the pilot studies were not included in the main study, and other DentRads, Ends, and general dental practitioners (GDPs) were invited to participate. Invitations were sent to randomly selected members of relevant associations in Turkey via e-mail. A reminder e-mail was automatically sent to those who did not respond to the first e-mail within 10 days. Then, after 20 days, the system was closed.
The inclusion criteria for the respondents were as follows:
– the participant should be a GDP, End or DentRad;
– the participant should have had an eye examination in the last 18 months;
– the participant should not have any eye defects, or if they did, they should have been fixed with glasses or contact lenses;
– the participant should be using a MacBook Air laptop or be familiar with it.
The exclusion criteria for the respondents were as follows:
– participants who did not visit the website after the 2 e-mails;
– participants who had an eye defect (glaucoma, cataract, etc.);
– participants who refused to use a MacBook Air laptop;
– participants who had been diagnosed with attention deficit hyperactivity disorder (ADHD).
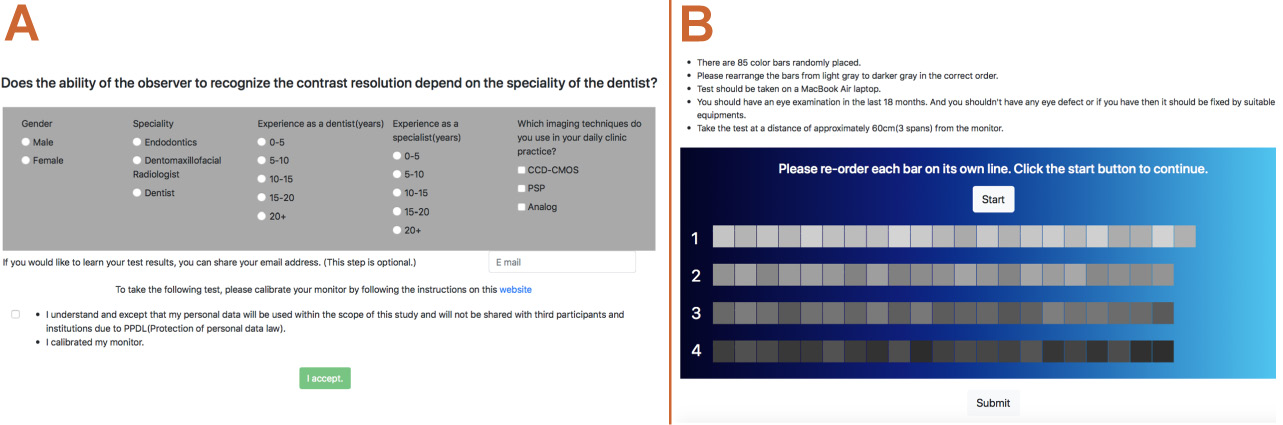
A custom web application was developed by a web developer using HTML, CSS, JavaScript, and PHP. The application consisted of 2 webpages. On the 1st page, the participants were asked to provide personal information, including gender, specialty, the years of experience, and the imaging techniques (i.e., charge-coupled device-complementary metal oxide semiconductor (CCD-CMOS), photostimulable phosphor (PSP), analog) used in their daily clinical routines (Figure 1). In addition, they were directed to calibrate their monitors, using the link provided (macOS User Guide; https://support.apple.com/en-hk/guide/mac-help/mchlp1109/mac). The participants were not allowed to proceed to the 2nd page without confirming that the necessary calibration was performed. After providing informed consent to participate in the study, the participants were directed to the 2nd page.
The 2nd page included test instructions and directions (Figure 1). Initially, the participants were informed about the contents of the test. According to the instructions, the test was to be taken on a MacBook Air laptop (Apple Inc., California, USA) at a distance of approx. 60 cm from the monitor (3 spans). The participants were offered a MacBook Air laptop to use if they did not have one. The test design was inspired by FM. Eighty-five gray color tones represented with square bars of equal length and width were randomly placed in 4 rows according to the principles of FM, as follows: 22 bars in the 1st row (white-like gray) and 21 bars in the 2nd (light gray), 3rd (dark gray) and 4th (black-like gray) rows. These gray tones were selected consequently (22–106) from a 128-tone (7 bits/pixel) grayscale (Figure 1). The lightest (1–21) and darkest (107–128) gray tones were excluded. Each tone was numbered from 1 to 85, but the enumeration was not visible to the participants. On this page, the participants were asked to rearrange the bars from lightest to darkest in the correct order. They were only allowed to drag and change the bars in the same row.
The participants who got acquainted with the instructions were asked to start the test by clicking the “start” button. Then, when they completed the test, they were asked to click the “submit” button.
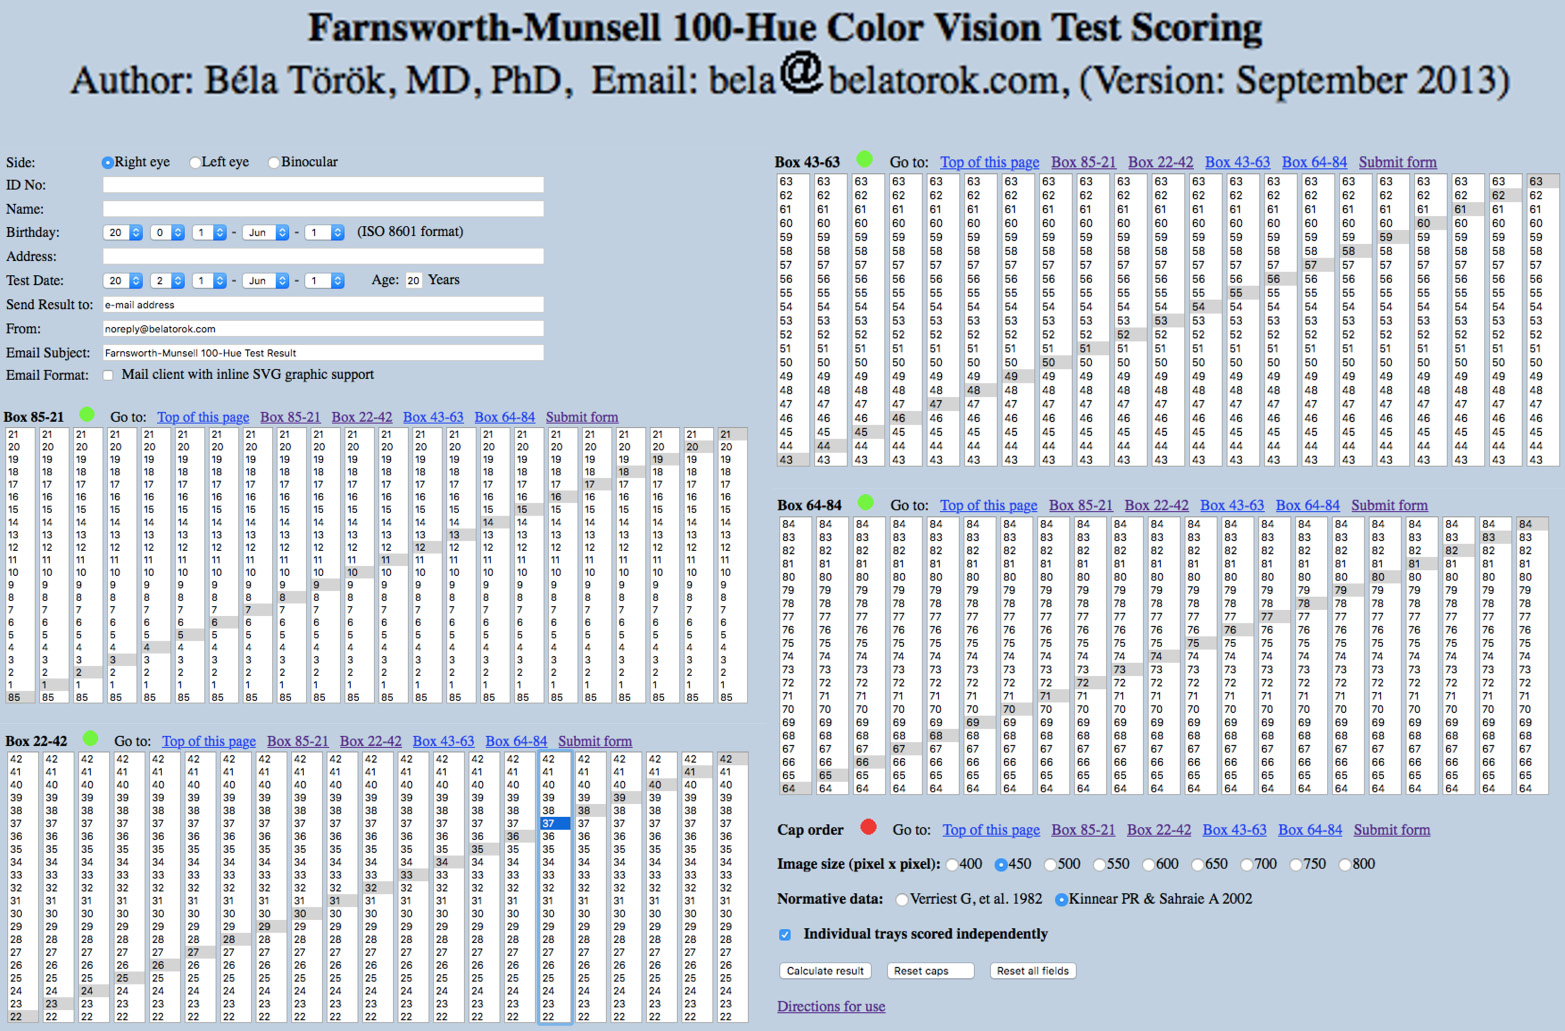
The test results of each clinician were recorded in a PHP database. The individual’s level of recognition of gray tones was evaluated through TES. The score was calculated using a web-based independent scoring software program for FM (the classical method), which was coded by Béla Török (https://www.torok.info/colorvision/fm100.htm) (Figure 2). Lower TES values were a desirable result, indicating fewer misplacements, while higher scores indicated more misplacements of gray tones. The testing time was recorded automatically.
Statistical analysis
Statistical analysis was performed using the IBM SPSS Statistics for Windows software, v. 23.0 (IBM Corp., Armonk, USA). The data was assessed for normality using the Shapiro–Wilk test. The one-way analysis of variance (ANOVA) was used to compare normally distributed data. The Mann–Whitney U test and the Kruskal–Wallis test compared non-normally distributed data. The results were presented as mean and standard deviation (M ±SD) for normally distributed data, and as median (minimum–maximum) (Me (min–max)) for non-normally distributed data. The significance level was set at p < 0.05.
Forty-six participants completed the study, and the power of the test (99.9%) was obtained as a result of the post-hoc power analysis.
Results
Sixty-eight dentists visited the website within 30 days. Sixteen visitors did not complete the test, 3 visitors submitted their tests in less than 15 s, and the TES values of 3 other visitors were higher than 500. Therefore, the results of these 22 participants were discarded from the study. A total of 46 individuals met the requirements of the test. The numbers of respondents by dentistry branch were 16 GDPs, 15 Ends and 15 DentRads. Eighteen participants were male, and 28 were female. The TT values according to gender, branch, the years of experience, and the radiographic method used by the participants are shown in Table 1. The time to complete the test ranged from 280 s to 1,228 s. There was no correlation between TT and gender, the years of experience or the radiographic method used (p > 0.05). However, DentRads spent significantly more time than GDPs to complete the test (p < 0.05).
The mean TES values for the participants are shown in Table 2. Higher TES values represented more misplacements of the gray bars. The TES results ranged from 3 to 435. The TES results of the specialty groups were GDPs > Ends > DentRads, but the differences were not statistically significant (p > 0.05).
The participants used various imaging techniques in their clinical practice. The respondents were allowed to choose more than one answer to the question regarding the imaging methods. Five participants reported using more than one technique, which included PSP and CCD-CMOS (the hybrid group). While the first choice of Ends (n = 6; 40.00%) and DentRads (n = 13; 86.67%) was PSP, the first choice of GDPs (n = 7; 43.75%) was analog radiography. In terms of TES, there were no significant differences between the PSP and hybrid groups as compared to the other groups. The dentists who used CCD-CMOS had significantly lower TES values than those who used analog radiographs (p < 0.05) (Table 2).
Although the lowest TES values were obtained by professionals with 0–5 years of experience, the years of the participants’ experience as dentists (Experience 1) or specialists (Experience 2) did not affect the TES results (p > 0.05) (Table 2). Also, no statistically significant differences were observed between specialists (DentRads and Ends) and GDPs regarding both the TES and TT values (p < 0.05) (Table 3).
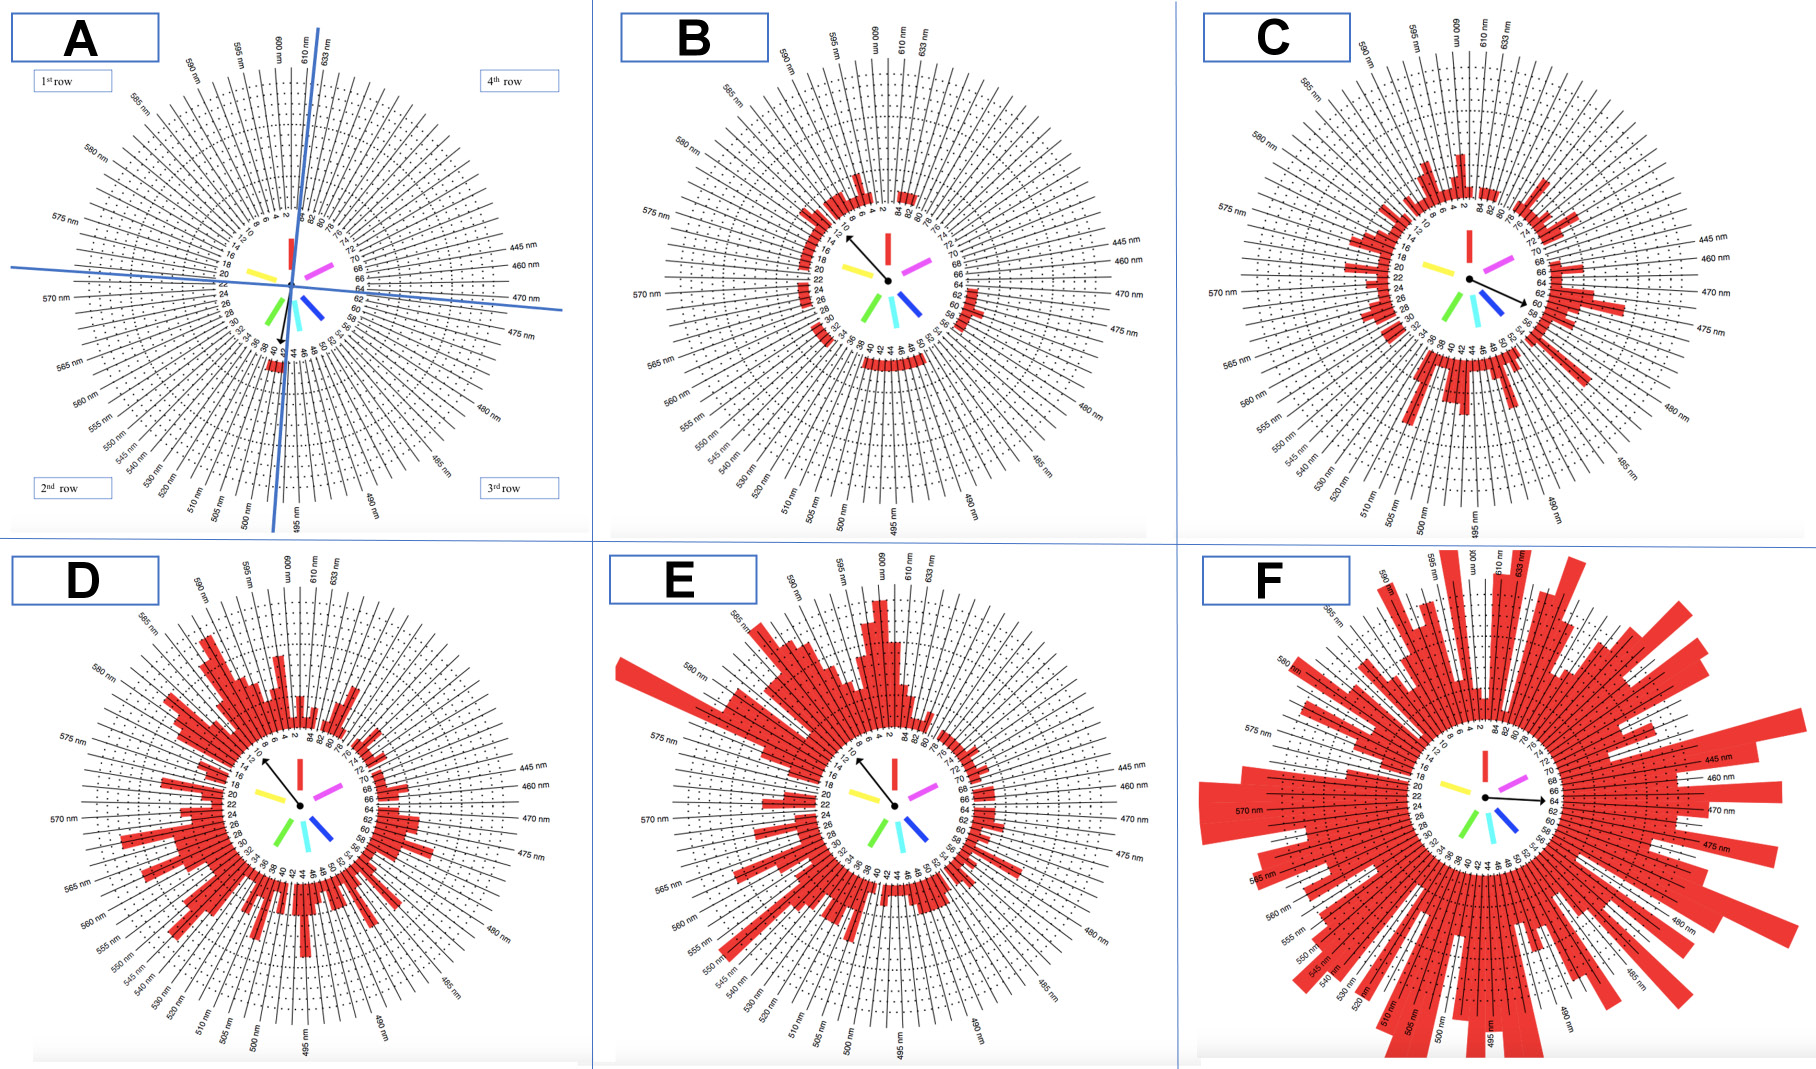
The order of gray tones entered into the software can also be visualized by a ring chart (Figure 3). The misplaced gray bars are shown in red. Accordingly, the upper left part of the diagram represents the 1st row, the lower left part – the 2nd row, the lower right part – the 3rd row, and the upper right part – the 4th row. The participants often misplaced the bars representing the white-like gray and light gray colors. The 4th row (black-like gray) had the highest rate of correct placement.
Discussion
It is well known that radiographs are the main adjunct to the clinical examination, and dentists need them in both operative and preventive dentistry. Dentomaxillofacial radiologists and endodontists are the main groups that use radiographic imaging techniques in diagnosis, follow-up sections, in pre-treatment, treatment and post-treatment procedures. On the other hand, GDPs constitute the dominant group of dentists, dealing with all fields of dentistry, and they use all types of radiographs in their clinical routine. Identifying and improving the ability of dentists to detect gray tones, as well as determining the factors affecting this ability, would shorten the diagnostic process, reduce costs and positively affect the prognosis of treatment.16 Therefore, the present study aimed to compare the contrast resolution recognition abilities of the abovementioned 3 groups of dentists. According to the results, there was a difference between the dentistry branches with regard to TT, as DentRads spent significantly more time than GDPs to complete the test. The years of experience had no effect on TES or TT. However, the dentists who used CCD-CMOS had significantly lower TES values than those who used analog radiographs (p < 0.05). For this reason, the 1st null hypothesis was partially rejected, and the 2nd hypothesis was also partially rejected.
When the TES and TT values were analyzed, it turned out that DentRads spent the longest time completing the test, but no statistically significant differences were observed between this group and the other groups with regard to the TES values. Given that radiologists often view radiographs on larger screens in dark and private rooms, it is understandable that the focusing time will be longer on a 13-inch screen. In addition, it has been shown that the computer vision syndrome (CVS), which is defined as an eye and vision problem due to computer use,17 manifested mainly as difficulty with focusing, is quite common among oral radiologists.18, 19, 20 This situation and the prolonged focusing time may affect their work performance.
The lowest TES values were obtained in the group with 0–5 years of experience for both Experience 1 (as a dentist) and Experience 2 (as a specialist). Considering that the number of years of experience is directly proportional to the age of the person, it can be concluded that older participants had more difficulty with distinguishing and ranking gray tones. In addition, this computer-based study may have attracted more attention from the younger generation. Another possibility is that young participants may follow new developments and use digital systems more intensively. However, one of the limitations of this study may be that the participants were asked about their years of experience, not their age.
Radiographic interpretation could be influenced by both objective21, 22 and subjective factors.23, 24 Kamburoğlu et al. compared observer agreement between Ends and DentRads in the evaluation of endodontically and non-endodontically treated teeth for the presence of periapical lesions by using CBCT with 2 different voxel sizes.25 They reported that the voxel size and the specialty affected intra- and inter-observer reliability. The DentRads group showed better intra- and inter-observer agreement under all conditions.25 In this study, in which the contrast resolution perception ability of the participants was compared using the TES values, no significant differences were found between the dentistry branches. However, the DentRads group showed better results and lower SD values. The reason for this difference between these 2 studies may be the number of specialists participating in the study. While only 2 DentRads and 2 Ends participated in the study by Kamburoğlu et al., the number of participants in our study was at least 15 for each group examined. In addition, since this study measured the dentists’ ability to recognize contrast resolution and not their radiographic diagnostic ability, the participants’ expertise may not have affected the outcomes.
There were several limitations to this study. The study was conducted amid the coronavirus disease 2019 (COVID-19) pandemic, when the world had come to a standstill. People all around the world had to provide online services from their homes, including many professions that one may not have expected. Although this study was primarily meant as a face-to-face project, unfortunately, this design could not be implemented under COVID-19 conditions. In addition, considering a previous study that stated there were no differences between a computer-based FM (CBFM) and a manual FM (MFM) regarding TES and TT, and also suggested that CBFM was a very reliable, cost-effective and rapid method,26 our online study could also provide valuable outcomes.
The most challenging problem for these kinds of studies is to design a test that can be standardizable and applicable using virtual methods. Ophthalmologists use various methods, such as the Spaeth/Richman contrast sensitivity test (SPARCS) and the Pelli–Robson (PR) chart test, in the assessment of contrast sensitivity, which are difficult to monitor and translate to the dentistry field.27 The FM test, which assesses HVS, is used for the detection of color blindness. It could be performed either via the Internet or by using physical derivatives. The data obtained from the test proposes several quantitative pieces of information. In this study, only the application protocol and design of the FM test were adapted.
To obtain standardization, several precautions were taken, including screen calibration, detailed guidance for the test environment and the use of the same brand of computer. Based on a study by Koenderink et al.,28 the distance from the monitor was determined as approx. 60 cm. The order of the gray bars in each row was established using www.random.org, and each participant saw the same random sequence. In this way, inter-participant standardization was ensured. The participants were also directed to a webpage for screen calibration. This webpage link was placed with a button for the ease of use on the 1st page of the application. Digital zoom was also automatically forbidden by the system. All participants were instructed to use laptops of the same model to standardize the factors related to the monitor and display resolution. MacBook Air laptops were provided to 5 participants who did not have one.
In the present study, the participants used MacBook Air laptop monitors rather than medical monitors or desktop monitors. Medical monitors, which have complex technology, are excellent pathfinders for both medical and dental radiologists during diagnostic processes. However, physicians cannot access these functional monitors in their clinical practice because of their high cost. It was not preferred to use desktop monitor models, since they may have different resolution characteristics and cause calibration problems, and it was not possible to standardize monitor brands. The MacBook Air laptop with the Display Calibrator Assistant enables the control of screen calibration. It has support for millions of colors and a native resolution of 2,560 × 1,600 at a density of 227 pixels per inch. It automatically adjusts the white point of the user’s display to the color temperature of the environment for a more natural viewing experience. Due to their display features, MacBook Air laptops were used in the present study.
The main concern of the researchers was to supply suitable ambient light in the evaluation room for the participants. Although a high ambient light level (>1,000 lux) is almost always present in dental clinics, a low ambient light level (<50 lux) is recommended to enhance the dentist’s performance during the detection of caries.29, 30 It has been shown that reporting rooms should have good ambient light. It should be adjustable, as bright as the computer screen, and neither too bright nor too dark.19 Baltacıoğlu et al. reported that different ambient light levels did not affect the diagnostic ability of observers.31 In light of this information, ambient light was ignored in this study. However, the participants were instructed in the e-mail invitation to take the test under dim light conditions.
The respondents were asked about the imaging techniques they were using in their clinical routines, and the relationship between the method used and the TES result was assessed. It is broadly accepted that PSP plates have a wider dynamic range than CCD and CMOS sensors.32 Moreover, both digital systems (PSP plates and CCD/CMOS sensors) offer better contrast resolution than analog systems. On the other hand, the view box of analog films provides better luminance levels than typical digital monitors.32 Since the study was designed to assess the arrangement of digital data on the monitor, the lower TES results of the digital system users as compared to the analog system users were consistent.
Dental radiographs play a fundamental role in each step of treatment. However, it is not known whether the development of digital radiography technology has improved clinicians’ ability to prepare a proper treatment plan.23 This is because we interpret digital radiographs rather than read them.33 Goldman et al. reported that many factors, such as the experience of the observer, the conditions in which radiographs are examined and the settings of the X-ray systems, could influence this interpretation.33 From this point of view, although the years of the participants’ experience were evaluated and the examining conditions were standardized in the current study, the results may not be generalizable when considering both observational and technical factors. Interpreting radiographic images poses challenges, particularly when discerning anatomical malformations within the teeth. The fine details of dental structures may not be easily discernible from radiographs. Additionally, the presence of hard tissues can lead to superimpositions on the images, complicating the interpretation of the results. The designed test cannot represent these factors completely. Additionally, dentists normally do not calibrate their personal monitors every time they use them. For this reason, the present study may be a pathfinder for further studies that will focus on contrast resolution under clinical conditions.
Conlusions
Within the limitations of the present study, while the specialty and the years of experience did not affect the clinicians’ ability to recognize gray tones, the digital imaging techniques (PSP and CCD/CMOS) could improve the clinicians’ gray-level perception. Although the contrast sensitivity of the observer plays a fundamental role when evaluating dental radiographs, it is not the only factor that determines the outcomes. Further studies of the contrast resolution recognition ability of clinicians, supported by clinical cases, are needed.
Ethics approval and consent to participate
The study was approved by the institutional ethics committee at Istanbul Okan University, Turkey (approval No. 21.10.2020/24). All participants provided informed consent.
Data availability
The datasets generated and/or analyzed during the current study are available from the corresponding author on reasonable request.
Consent for publication
Not applicable.