Abstract
Background. Eating disorders (EDs) are considered a public health problem. Scientific research has focused on teenagers due to their higher prevalence in this population. However, other groups, such as university students, may be exposed to suffering from EDs due to their academic, social and personal characteristics. Identifying the magnitude of EDs and the associated characteristics may impact the generation of prevention strategies.
Objectives. The aim of the present study was to establish the prevalence of the risk of EDs (anorexia nervosa (AN) and bulimia nervosa (BN)) and the associated factors in dental students at the University of Antioquia, Medellín, Colombia..
Material and methods. A cross-sectional study was conducted on 278 students (76 males, 202 females) with the use of a Google-Forms survey. The validated Spanish version of the Eating Attitudes Test-26 (EAT-26) and the Sick, Control, One Stone, Fat, Food (SCOFF) questionnaire were used. Other recorded variables included sociodemographic data, coronavirus disease 2019 (COVID-19)-related factors, health, and social support (the Duke-11 profile). The bivariate analysis of the risk of EDs was conducted according to different variables (95% confidence interval (CI)), followed by the logistic regression models adjusting for different variables (adjusted prevalence ratio (aPR) and 95% CI).
Results. According to EAT-26, the risk of EDs was 27.6% (18.8–38.6) for males and 28.7% (22.9–35.3) for females. However, differences between males and females were higher when the SCOFF questionnaire was applied (males: 6.6% (2.8–14.5); females: 22.3% (17.1–28.5); p < 0.01). According to the SCOFF instrument, after adjusting for sociodemographic and health variables, women were more likely to report the symptoms of EDs (aPR: 2.20; 95% CI: 1.06–4.57). Women receiving information from social networks were more likely to report the symptoms of EDs (aPR: 1.85; 95% CI: 1.19–2.88). Multivariate models showed that women reporting poor self-rated health and some symptoms during the mandatory confinement caused by the COVID-19 pandemic were more likely to report the symptoms of EDs.
Conclusions. A higher risk of EDs was found in dental students. Healthcare, psychological and/or psychiatric interviews, and educational/early prevention strategies are required.
Keywords: health surveys, dental students, feeding and eating disorders, anorexia nervosa, bulimia nervosa
Introduction
Eating disorders (EDs) represent a physical and mental challenge, and are considered a global public health problem.1 According to “Diagnostic and Statistical Manual of Mental Disorders (DSM-5™)”, feeding and eating disorders are characterized by a persistent disturbance of eating or eating-related behavior that results in the altered consumption or absorption of food, which significantly impairs physical health or psychosocial functioning.2 The EDs proposed for this classification are anorexia nervosa (AN), bulimia nervosa (BN), binge eating disorder (BED), other specified feeding or eating disorder (OSFED), pica, rumination disorder, avoidant/restrictive food intake disorder (ARFID), and unspecified feeding or eating disorder (UFED); other proposed criteria include muscle dysmorphia and orthorexia nervosa (ON).2 In general terms, the most frequent EDs in adolescent and adult populations are AN, BN and BED, whereas the remaining disorders are characteristic of childhood.2
According to a systematic review of studies on EDs in the 2000–2018 period, despite differences in the tools used for evaluating and classifying EDs, the prevalence of EDs varies from 2.2% to 19.4% for females, and from 0.7% to 13.8% for males.1 Although studies on adolescent populations (specifically females) are most common, recent epidemiological studies have focused on other groups, such as university students, and middle-aged and older persons.3, 4, 5
University students constitute a potential high-risk population for EDs,4, 5 especially students in the healthcare specialties.6 They are vulnerable to high stress levels and burnout, and often suffer from mental health problems.7 An association between EDs and depressive symptoms has been shown.8, 9 In addition, the possible influence of changes in the nutritional status, eating patterns and diet, as well as the role social media and networks play in self-esteem, the corporal image and body satisfaction/dissatisfaction, are recognized as strongly related to the prevalence of EDs.10, 11, 12, 13 It cannot be overlooked that the coronavirus disease 2019 (COVID-19) pandemic significantly affected university students’ mental health, and their depression and stress levels, and resulted in the presence of EDs and other related risk behaviors.14
In Colombia, research has been conducted on several populations, including studies on female gym-goers,15, 16 the analysis of EDs in males to identify clinical subtypes and relate them to psychological symptoms,17 and epidemiological studies on undergraduate students from public and private universities.18, 19 Nevertheless, specific studies on dental students are scarce. Determining the magnitude of EDs and the associated characteristics may lead to timely diagnosis and strategies for prevention in specific populations.20
Accordingly, the present study aimed to establish the prevalence of the risk of EDs and the associated factors, focusing on AN and BN in dental students at the University of Antioquia, Medellín, Colombia.
Methods
Design, data collection and setting
This cross-sectional study used an anonymous survey administered online to a sample of dental students (undergraduate/postgraduate) at the Faculty of Dentistry of the University of Antioquia, Medellín, Colombia. The final sample of respondents was 278 (27% males and 73% females). The study fieldwork was conducted between March and April 2021. The questionnaire was designed using the Google Forms platform (available upon request), and distributed through digital media, including Facebook groups, WhatsApp messages, e-mails, and institutional invitations. Participation was voluntary. The questionnaire gathered information about sociodemographic data, and included questions about the COVID-19 pandemic, social networks, health conditions, and self-reported EDs. We did not receive any incomplete questionnaires. To avoid duplicate questionnaires and to guarantee that the study population filled out the survey, the Google Form requested a valid e-mail address.
Variables
Dependent variables
The primary analysis used 2 instruments. First, the validated Spanish version of the Eating Attitudes Test-26 (EAT-26) was applied for the detection of the ED risk.21, 22 It is a questionnaire with 26 Likert-type questions (88.9% sensitivity and 97.7% specificity). Each question has 6 response options (never, rarely, sometimes, often, very often, or always); the first 3 were rated 0, the fourth 1, the fifth 2, and the sixth 3. The total score of EAT-26 is the sum of the 26 items. They score 3, 2, 1, 0, 0, 0 in the positive direction, assigning 3 to responses that most closely approximate a symptomatic direction (always = 3). Only item 25 is scored in the opposite way, scoring 0, 0, 0, 1, 2, 3 (never = 3). The cut-off point used to determine the ED risk according to EAT-26 was ≥11, based on one study of diagnostic validity and usefulness conducted in Medellín.21 A second complementary approach, the Sick, Control, One Stone, Fat, Food (SCOFF) questionnaire, was used as a screening test for EDs. It is a questionnaire with 5 yes/no questions. A SCOFF score with at least 2 positive answers indicates an ED.23, 24
Independent variables
The independent variables were as follows: sociodemographic data, including age, the type of academic training, the socioeconomic status, and the number of people at home; the level of COVID-19 knowledge; social support; and the perception of social networks. Social support was assessed using the Duke-11 Functional Social Support Questionnaire among the participants. This self-administered instrument is composed of 11 statements, using a five-point Likert-type response scale (1 = much less than I want, 2 = less than I want, 3 = neither much nor little, 4 = almost as much as I want, and 5 = as much as I want). A cut-off point was validated at the 32-point level, suggesting that a score lower than this refers to low social support, while a score equal to or higher than this indicates an adequate level.25
Health conditions
The following health conditions were taken into account:
– self-rated health (good/poor);
– the body mass index (BMI), defined as a person’s weight in kilograms divided by the square of their height in meters (kg/m2); according to the norms established by the World Health Organization (WHO),26 BMI ≤ 18.49 kg/m2 was regarded as underweight, BMI between 18.50 kg/m2 and 24.99 kg/m2 as normal weight, BMI between 25.00 kg/m2 and 29.99 kg/m2 as overweight, and BMI ≥ 30.00 kg/m2 as obesity (in the present study, self-reported BMI was used, i.e., the measure was based on the responses of the surveyed people about their weight and height);
– the WHO Five Well-Being Index (WHO-5), applied to measure the subjective well-being of the participants. This instrument comprises 5 statements: ‘I have felt cheerful and in a good mood’; ‘I have felt calm and relaxed’; ‘I have felt active and energetic’; ‘I have woken up refreshed and rested’; and ‘’My daily life has been full of things that interest me’. They are rated on a Likert scale from 0 to 5, where 0 = never, 1 = occasionally, 2 = less than half the time, 3 = more than half the time, 4 = most of the time, and 5 = all the time. Subsequently, the scores were added to obtain a total value that was multiplied by 4 to give a figure ranging from 0 to 100, where the higher the score, the greater the well-being27;
– the level of concern regarding COVID-19;
– sleep quality during mandatory social isolation (COVID-19);
– the presence of certain symptoms during mandatory social isolation (COVID-19): headache; insomnia; muscular pain; appetite loss; libido loss; fatigue; irritability/moodiness; lack of concentration; anxiety; and eye strain;
– consumption habits during mandatory social isolation (COVID-19): coffee; alcohol; smoking; and psychoactive substances.
Statistical analysis
A pilot test was carried out with a sample of 14 participants to improve intelligibility, and to assess the completion time and internal consistency. Cronbach’s alpha was 0.89 for EAT-26 and 0.63 for SCOFF. Test-retest reliability was calculated for 9 participants, obtaining values of 0.99 for EAT-26 and 0.87 for SCOFF.
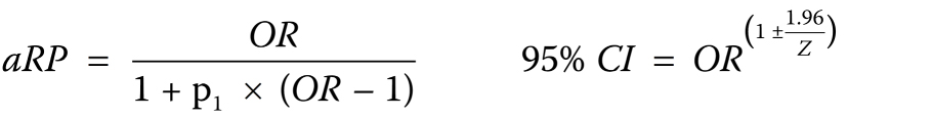
All analyses were conducted separately for males and females. Descriptive analysis was carried out for dependent and independent variables (qualitative and quantitative). The prevalence of EDs with 95% confidence intervals (95% CIs) were calculated for both instruments (EAT-26 and SCOFF) according to independent variables. The χ2 tests were used to establish statistically significant differences among the study variables. Furthermore, multivariate logistic regression analyses were conducted. Initially, an association between the presence of EDs and sex was determined. Secondly, specific associations between the selected independent variables and the presence of ED were calculated. We estimated the odds ratios (ORs) with 95% CIs, and later converted them to adjusted prevalence ratios (aPRs), using the mathematical formula proposed by Miettinen (Equation 1)28:
where p1 represents the prevalence of the disease in the reference group, and Z is the regression coefficient divided by its standard error.
The conversion was carried out based on the assumption that OR tends to overestimate the strength of association with a prevalence higher than 10%. In both cases (OR-aPR), the statistical significance and the magnitude of associations was assessed. Statistical analyses employed IBM SPSS Statistics for Windows, v. 25.0 (IBM Corp., Armonk, USA).
Ethical considerations
Adhering to international standards for online surveys, all respondents completed an informed consent statement on the first page of the questionnaire, and the participants could reject or approve involvement in the study. Confidentiality was guaranteed throughout the research process in accordance with the Declaration of Helsinki. The Ethics Committee at the Faculty of Dentistry of the University of Antioquia approved the study (Act 03-2021, Concept 76). This manuscript followed the standards for observational studies, as established by the Strengthening the Reporting of Observational Studies in Epidemiology (STROBE) statement.29
Results
Table 1 shows the sociodemographic characteristics of the study population and the prevalence of EDs. According to EAT-26, the ED risk was 27.6% (18.8–38.6) for males and 28.7% (22.9–35.3) for females. However, differences between males and females were higher when the SCOFF questionnaire was applied (males: 6.6% (2.8–14.5); females: 22.3% (17.1–28.5); p < 0.01). Both instruments reported a higher risk in female undergraduate students under 24 years of age, with a high socioeconomic status, living with 5 or more people at home, and with low perceived social support. However, statistically significant differences were found for the variable academic training when the SCOFF scores were considered. Similarly, the score that gages the influence of social networks on these disorders was higher in those at risk for EDs (p < 0.05) and those getting their information about EDs from social networks (p < 0.01). For men, applying EAT-26 revealed a striking level of knowledge about COVID-19 among those at risk for EDs (p < 0.01). The SCOFF questionnaire showed a higher ED risk among male undergraduate students over 25 years of age, with a medium socioeconomic status, living with 4 or fewer people at home, and with low social support (no statistically significant differences were found). The prevalence of ED risk was higher in those who get information about these disorders from social networks (p < 0.05).
Table 2 shows health conditions and substance consumption during the mandatory social isolation caused by the COVID-19 pandemic and the prevalence of ED risk. For females, both instruments revealed a higher prevalence of ED risk among those reporting poor health (p < 0.01 for EAT-26 and p < 0.05 for SCOFF), those who are overweight/obese (with no statistically significant difference), those with low general well-being scores (p < 0.01), and those with poor sleep quality during mandatory social isolation (p < 0.01). Similarly, a higher prevalence of ED risk was found in females reporting specific symptoms during isolation, and statistically significant differences were observed, depending on the symptom and the instrument used for reporting the ED risk (Table 2). For males, EAT-26 found a higher prevalence of ED risk among those reporting poor health, being underweight, and experiencing the loss of libido (p < 0.05) or anxiety (p < 0.05).
Regarding substance consumption during the social isolation caused by the pandemic (Table 2), the SCOFF questionnaire showed a higher prevalence of ED risk in females, with statistically significant differences (p < 0.05) for those with increased consumption of coffee and psychoactive substances, and increased smoking. The EAT-26 indicator reported a higher prevalence of ED risk in females with increased consumption of coffee and alcohol (p < 0.01 and p < 0.05, respectively). When analyzing men, no statistically significant differences were observed. However, there was a higher prevalence of ED risk reflected by EAT-26 in those who reported increased consumption of the aforementioned substances.
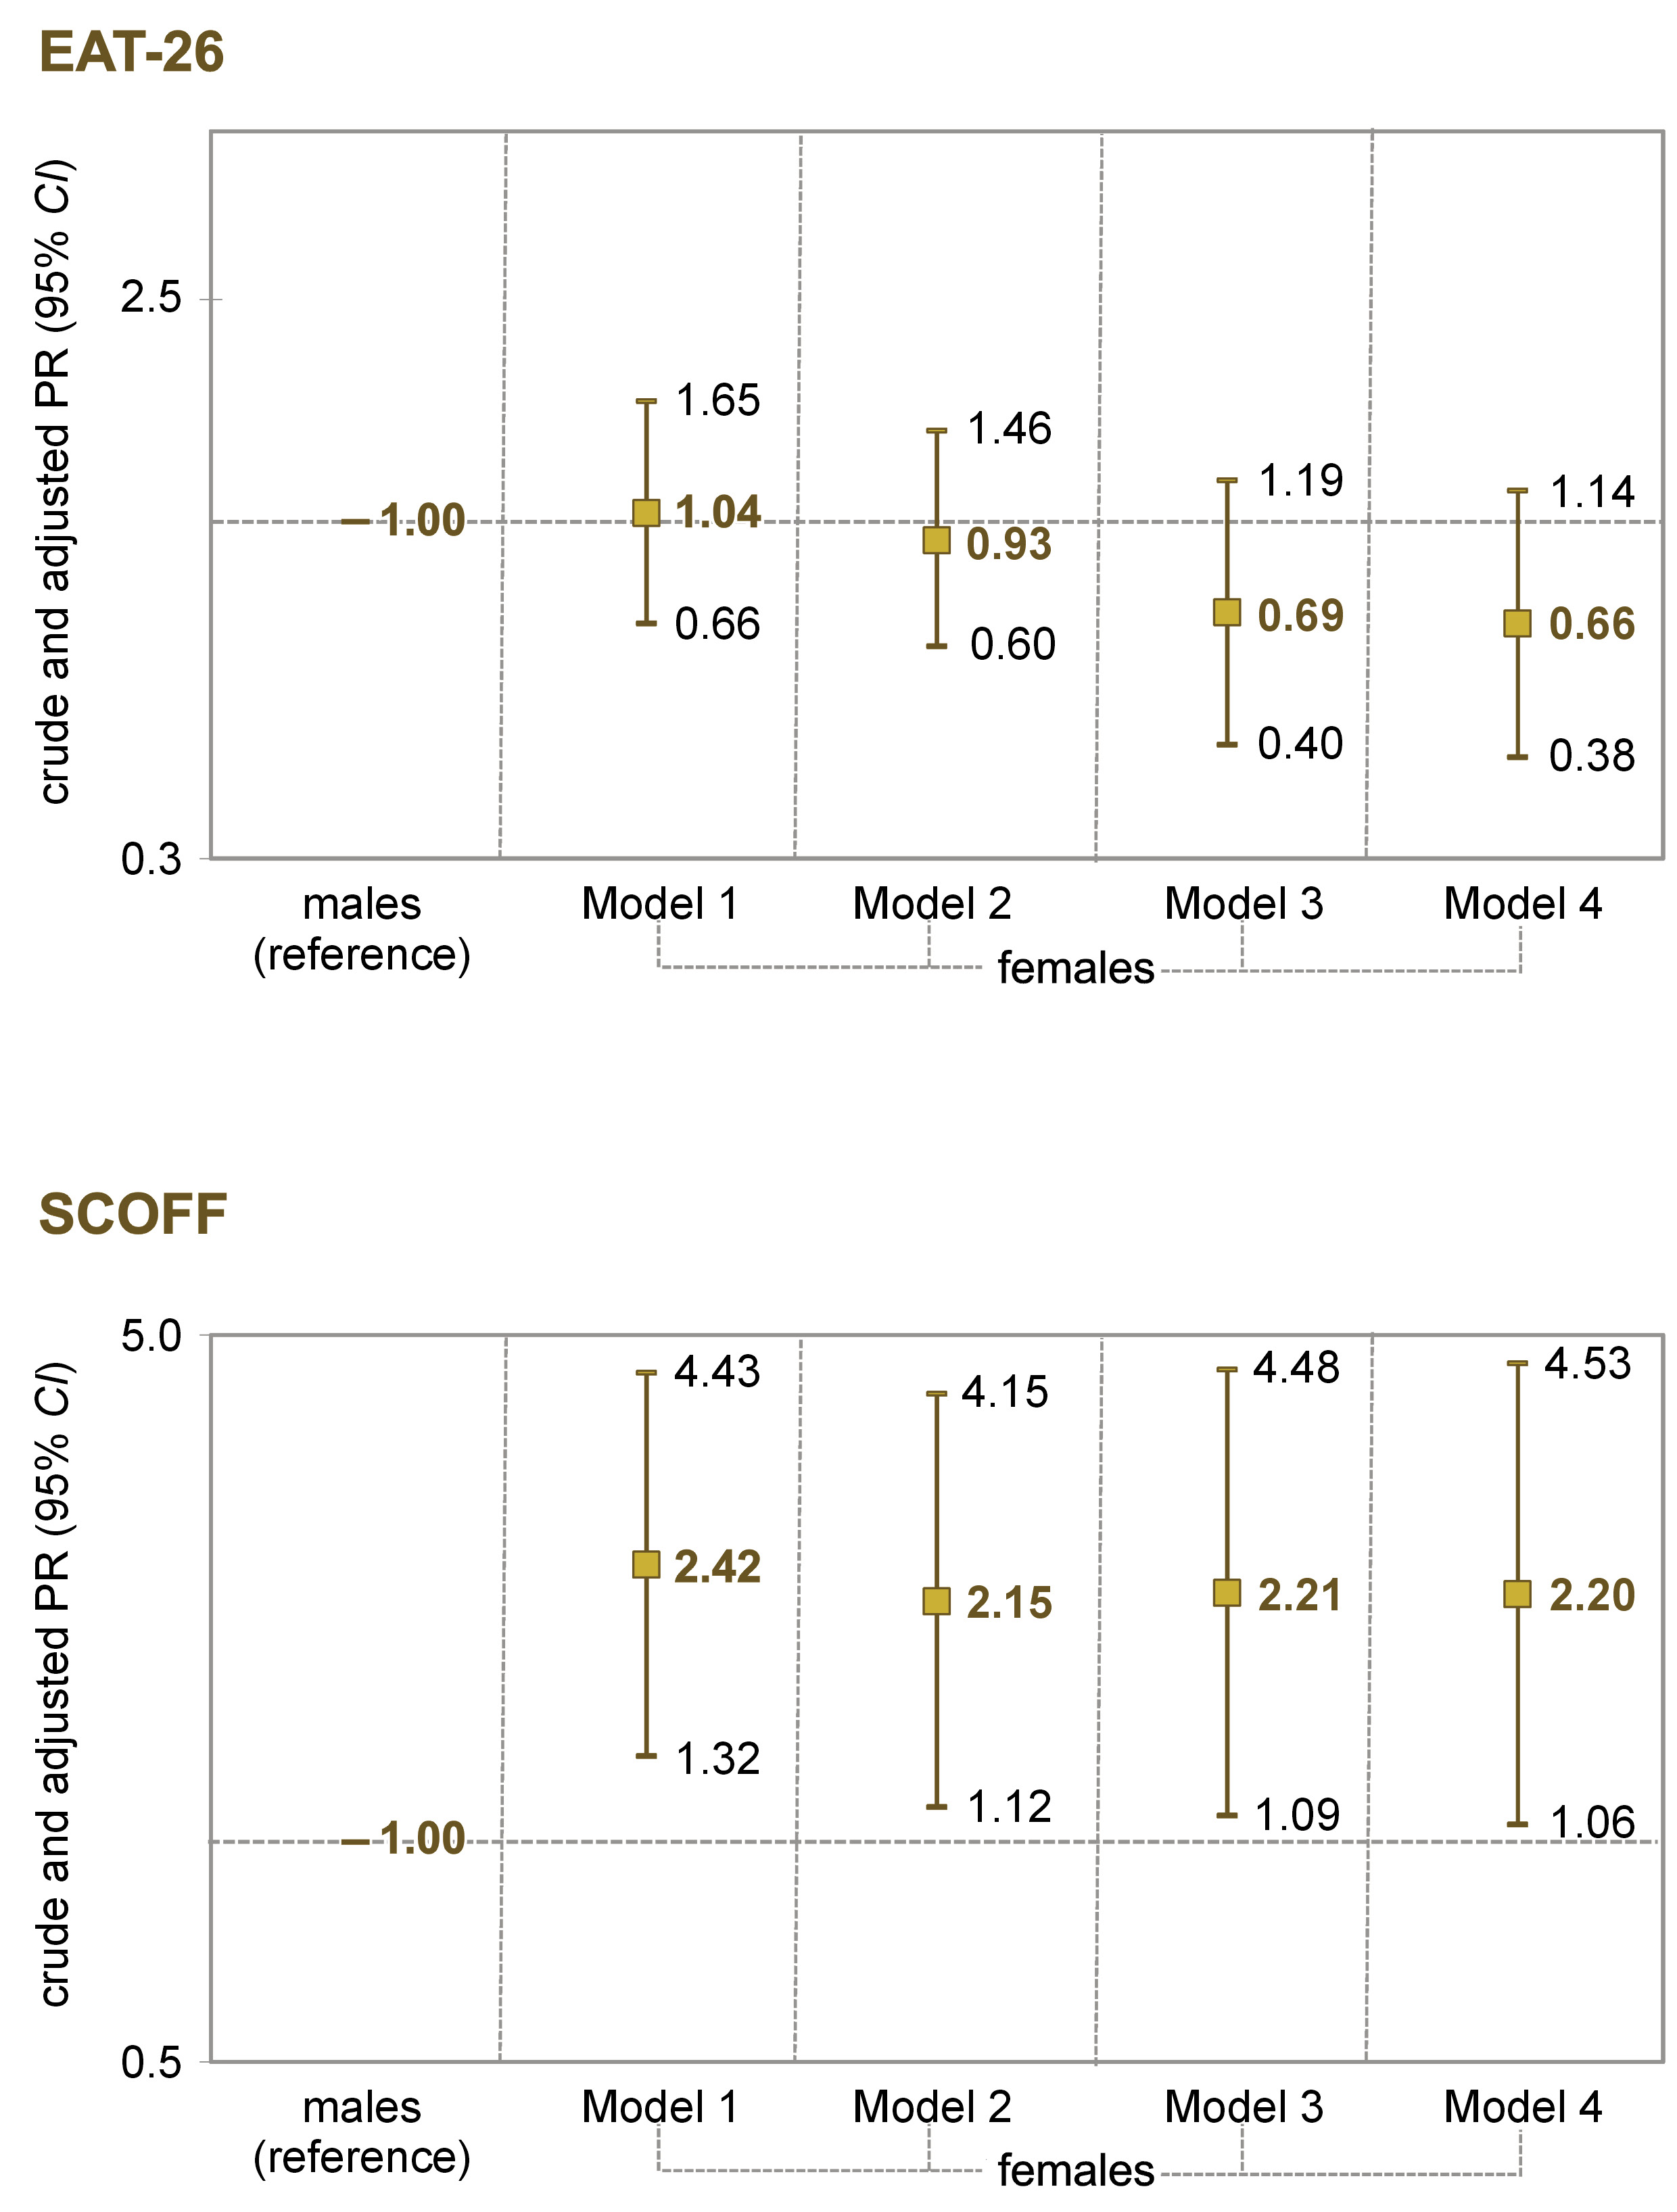
A multivariate association analysis compared the presence of ED symptoms with regard to sex, as shown in Figure 1. According to SCOFF, females were more likely to report the symptoms of EDs, and this association was maintained after adjusting for sociodemographic and health variables (aPR: 2.20; 95% CI: 1.06–4.57).
Table 3 illustrates the multivariate analysis of the association between the symptoms of EDs and sociodemographic variables. According to SCOFF, females receiving ED information from social networks were more likely to report the symptoms of EDs (aPR: 1.85; 95% CI: 1.19–2.88). In the remaining categories, no statistically significant differences were found in the adjusted model.
Finally, Table 4 shows the multivariate analysis of the association between the symptoms of EDs and health variables. According to EAT-26, after adjusting for variables, females with poor self-rated health (aPR = 1.44; 95% CI: 1.04–2.00), muscular pain (aPR = 1.50; 95% CI: 1.07–2.11), appetite loss (aPR = 1.48; 95% CI: 1.01–2.47), fatigue (aPR = 1.46; 95% CI: 1.05–2.03), irritability/moodiness (aPR = 1.49; 95% CI: 1.06–2.08), and anxiety (aPR = 1.87; 95% CI: 1.36–2.56) were more likely to report the symptoms of EDs. In the SCOFF questionnaire, after adjusting for variables, females reporting headache (aPR = 1.64; 95% CI: 1.03–2.60), irritability/moodiness (aPR = 1.86; 95% CI: 1.26–2.73) and anxiety (aPR = 2.16; 95% CI: 1.45–3.23) were more likely to report the symptoms of EDs.
Discussion
The main study findings showed that females suffer from ED symptoms more frequently than males, though other sociodemographic factors and health conditions had a differential influence on the risk of these disorders. Furthermore, when the association analyses using multivariate models were conducted, some ED risk factors maintained their statistical significance, especially for females, including the influence of social networks, specific health conditions and the symptoms perceived during the mandatory confinement caused by the COVID-19 pandemic.
Sex as an analytic category played an important role when possible differences in the prevalence of ED risk were considered among the dental students participating in this study. However, the magnitude of these differences was higher (by 120% for females) when the SCOFF questionnaire scores were analyzed, and no statistically significant differences were found with EAT-26. An international systematic review shows that ED symptoms are more frequent in females,1 although the prevalence observed for both sexes in our study was higher than that reported globally and for the Americas. Other studies conducted on university students show different findings. For instance, studies from Pakistan4 and Malaysia5 using the EAT-26 questionnaire showed no statistical differences between the sexes. A study from Tunisia6 conducted on health occupation students (including dentistry), using the SCOFF questionnaire showed a higher risk prevalence in males (27.3% vs. 6.6%) and females (36.3% vs. 22.3%) as compared to the present Colombian study. Finally, a Colombian study using the SCOFF questionnaire in a private university (with minimal participation of dentistry students) found that females were more likely to report ED symptoms, including AN and BN (OR = 1.6; 95% CI: 1.2–2.1).19
Several aspects should be taken into account when analyzing the results of different studies that considered sex. First, there are differences in the precision and specificity of the instruments used to capture populations at risk for EDs, and this situation is reflected in the varying frequencies of these disorders.1, 3 According to a meta-analysis of the diagnostic accuracy of the SCOFF questionnaire, a relatively low sensitivity was found for the male population, and the efficacy of the test was marginally higher for females.30 Second, analyzing the cultural patterns related to diet and food intake, and the aspects concerning corporal dissatisfaction is pertinent, as these factors occur differently between men and women.31, 32 For instance, according to a Mexican study, women are significantly more obsessed with thinness and experience body dissatisfaction, and men prefer to do physical exercise to control their weight.33 Scientific evidence indicates that men perceive EDs to be more common and “acceptable” as compared to women.34 Third, an association with psychological aspects, such as stress, depression and anxiety, should be considered in the analysis of EDs according to sex.9 Finally, specific analyses of risk behaviors and EDs in men are lacking. One study conducted in Colombia, a case series of 21 men, presented 4 clinical subtypes: restrictive, impulsive, avoidant, and secondary to other psychopathology.17
Some differences in the prevalence of ED symptoms aligned with sociodemographic variables. Although no significant differences were observed across all cases, bivariate and multivariate analyses showed certain trends. In this sense, the interpretation of the findings may be difficult, since the studies conducted on university students did not deeply explore the association of ED symptoms with sociodemographic variables, as in our study in Colombia. For instance, one study conducted on Malaysian university students found a lower risk of EDs in older students (similar to Colombia).5 On the other hand, in our study, the participants with low social support were more likely to report EDs. A qualitative analysis conducted on 22 females showed that social support contributed to ED recovery through an individual’s sense of connection to self and others.35 Further research is needed to explore socioeconomic, family and academic factors that influence EDs.
Regarding the participants’ BMI, we found no conclusive data. For instance, underweight males reported the ED risk more frequently on the EAT-26 test, while overweight/obese females reflected the ED risk more frequently on both tests (EAT-26 and SCOFF). Nevertheless, in multivariate models, statistical significance was maintained for females (on the SCOFF questionnaire). It should be noted that the BMI calculated for this study was based on self-reported input (weight and height). Studies on university students from Malaysia5 and Spain31 reported that a higher BMI was related to ED risk factors. These students were worried about their bodies and felt fear of gaining fat, which could explain body shape dissatisfaction.5, 31 Also, the image of the ideal body may differ between the sexes.
Another element worth analyzing is that the study period in Colombia coincided with the COVID-19 pandemic. The fieldwork was carried out in the 1st quarter of 2021, and at that time, the measures restricting face-to-face activities at the university were in effect, which involved important adaptations in lifestyle and study habits for our research participants. Clinical patient care activities alternated with the educational activities mediated by virtual tools, and the vaccination of dental students was prioritized under the policies and strategies of the national government.36 For that reason, the study findings may have been influenced by the pandemic. Other studies have shown that the COVID-19 lockdown increased the risk of EDs at the global level,37 especially among university students.14
Complementing the above, our study found several associations between health indicators and ED symptoms. The study participants who experienced the ED risk were more likely to report symptoms during mandatory social isolation (COVID-19), including poor mental health, a decline in well-being and changes in consumption habits, although the magnitude and statistical significance of their influence depended on the indicator and the type of analysis (bi- or multivariate). These results are not readily comparable, since not all studies used these health indicators to establish associations with EDs. However, the findings highlight the effects of the pandemic on the mental and physical health of the university population. For instance, studies on dental students in Saudi Arabia showed the detrimental effects of the COVID-19 lockdown on mental health, such as anxiety, stress and depression.38, 39
The changes in consumption habits during COVID-19 isolation uncovered in our study indicate that the participants’ smoking increased, as did their coffee, alcohol and psychoactive substance intake, and they reported higher frequencies of ED symptoms. In females, the differences were statistically significant. A Malaysian study did not find associations between current tobacco use and the ED risk,5 while a study on health occupation students from Tunisia found a higher frequency of ED symptoms in individuals reporting regular alcohol use and a lower frequency in smokers (in both cases, the differences were not statistically significant).6 Our results draw attention to the impact of the pandemic on the consumption of the aforementioned substances40 and underscore their effects on the mental health of university students.41
Mass media, the Internet and social networks might exert influence on risk and disorder behaviors, as shown by previous studies.11, 12, 15 Our study found that the participants receiving information about EDs from social networks were more likely to report symptoms (especially females when multivariate analyses were applied). In this sense, it is advisable to explore the impact of the Internet-based information on the ED risk, the possibility of following influencers that affect self-perception, and beauty ideals that may influence self-esteem and cause extreme food preoccupation.11, 12, 15
Strengths and limitations
The strengths of this study are that the research tools were previously validated by pilot testing, and the primary outcomes were evaluated by verified tests (EAT-26 and SCOFF), ensuring high sensitivity, specificity and consistency. Nevertheless, the study limitations must be considered when interpreting its findings. The cross-sectional nature of this research did not permit causal relationships to be analyzed. It seems important to consider the characteristics of Internet-based questionnaire studies. Despite the Google Form requesting an e-mail address to avoid duplicates (a large proportion of participants gave their institutional e-mails), some participants may have just accidentally found the questionnaire and filled it out. Similarly, the research group was not able to get information on why some members of the studied group (dental students in this case) did not take part in the study. The ED tests may only be used as a screening strategy for the possible detection of the population at risk and do not constitute a definitive diagnosis of these disorders. Thus, psychological/psychiatric interviews are required to identify specific EDs and establish treatment plans according to the patient’s needs.
Notwithstanding the above limitations, this study contributes to the knowledge about EDs that university students may experience, especially with regard to sociodemographic factors, their health status and the effects of the COVID-19 pandemic. Further research could elucidate some specific aspects, such as EDs in males, and use more precise tests that would differentiate the types of EDs, with specific analyses of the body image and food intake. In addition, qualitative studies that would allow an approach to the social representations and onset of EDs through the experience of university students in their academic, social and personal contexts should be undertaken.
Conclusions
A higher frequency of ED risk was observed among dental students who participated in this study. In ED prevalence, differences were found according to sociodemographic factors, certain health conditions and the psychological effects of the pandemic, some associated with the influence of social networks. These findings represent useful input for establishing timely diagnosis strategies, with appropriate professionals to initiate educational activities for health promotion and early prevention and to generate epidemiological surveillance systems that would allow the monitoring of the incidence/prevalence of these disorders in the short, medium and long term.
Ethics approval and consent to participate
Adhering to international standards for online surveys, all respondents completed an informed consent statement on the first page of the questionnaire, and the participants could reject or approve involvement in the study. Confidentiality was guaranteed throughout the research process in accordance with the Declaration of Helsinki. The Ethics Committee at the Faculty of Dentistry of the University of Antioquia approved the study (Act 03-2021, Concept 76). This manuscript followed the standards for observational studies, as established by the Strengthening the Reporting of Observational Studies in Epidemiology (STROBE) statement.
Data availability
The datasets generated and/or analyzed during the current study are available from the corresponding author on reasonable request.
Consent for publication
Not applicable.