Abstract
Background. Left ventricular (LV) relaxation is affected by hypertension. The inflammatory mediators produced in response to systemic inflammation, such as in periodontal disease, may also alter ventricular mechanics and the existing ventricular dysfunction. Thus, the systemic inflammatory burden which occurs in response to chronic periodontitis may alter myocardial activity.
Objectives. The current study aimed to assess the myocardial strain among controlled hypertensive patients with periodontitis by using two-dimensional (2D) echocardiography.
Material and methods. The study involved 150 controlled hypertensive patients, equally divided into group A (without periodontitis) and group B (with periodontitis). The cardiac strain was measured with 2D echocardiography and represented as global longitudinal strain (GLS), while the periodontal inflamed surface area (PISA) score quantified the systemic inflammatory burden experienced by these individuals due to chronic periodontitis.
Results. In the multiple linear regression model, the adjusted R2 for group B indicated that 88% of the variation in GLS was due to the independent variable (PISA). Thus, with every one-unit rise in PISA, there was a mild alteration in GLS of 7.54 × 10⁻⁵. A scatter plot depicted a positive correlation between PISA and GLS.
Conclusions. Within the limitations of the study, it can be concluded that an increase in the PISA score may cause mild alterations in the GLS score, which could indicate the possible influence of periodontitis on myocardial activity.
Keywords: cardiovascular diseases, inflammation, periodontal pocket, left ventricle, cardiac imaging technique
Introduction
Periodontitis is an inflammatory disease of the structures supporting the teeth, affecting 10–15% of the global population, which poses a public health challenge. This inflammation brings about a systemic inflammatory burden and influences the existing systemic conditions, such as diabetes mellitus, coronary heart disease, stroke, etc.1, 2 An epidemiological study by the American Academy of Periodontology and the American Heart Association states that in some patients, biological factors, such as chronic inflammation, might independently link periodontal disease to atherosclerosis and the development or progression of cardiovascular disease.3 This coronary atherosclerosis progressively leads to the ischemia of the myocardium, thereby leading to cardiovascular complications.3
The myocardium plays a pivotal role in cardiac function; any myocardial malperformance may impact the overall health. Two-dimensional (2D) echocardiography has provided a new perspective in understanding myocardial mechanics, helping us to identify early left ventricular (LV) dysfunction,4 expressed as global longitudinal strain (GLS).5 The GLS analysis has gained popularity, as it is a feasible and non-invasive diagnostic modality to assess cardiac mechanics, and it can detect subclinical alterations in ventricular function.6 Longitudinal strain represents the change in the length of the myocardium along the long axis of the left ventricle (LV) (from the base to the apex). It represents the rate at which the deformation progresses. The deformation refers to the myocardium changing shape and dimensions during the cardiac cycle, i.e., during systole and diastole.7 The strain rate is the quantum of deformation per unit of time. It reflects regional myocardial velocity in tissue Doppler imaging. Strain rate imaging has several hues, e.g., green denotes no strain rate, orange-red indicates a negative strain rate and blue indicates a positive strain rate.8
Left ventricular dysfunction occurs early in most cardiac diseases and frequently goes unnoticed, since it is a preclinical condition where LV fails to fill an adequate end-diastolic volume at an acceptable pressure, which may lead to heart failure (HF).9 Left ventricular function (LVF) is assessed using the ejection fraction (EF)10; however, recently, GLS has gained popularity, as it can track early alterations in LVF. Therefore, GLS can be used as an early indicator of cardiac dysfunction, and can help recognize individuals in the general population who are at a notably greater risk of cardiovascular morbidity and death. The periodontal inflamed surface area (PISA), measured in square millimeters, refers to the surface area of the bleeding pocket epithelium. The PISA parameter quantifies the amount of inflamed periodontal tissues in each patient, and is comparatively more accurate than any other classification currently in use.
Hypertension affects LF relaxation, thereby reducing LV compliance due to LV hypertrophy.10 Furthermore, the endotoxins and inflammatory markers produced in response to systemic inflammation may alter ventricular mechanics and the existing ventricular dysfunction.11 Among hypertensive patients with periodontitis, greater LV mass and LV mass index are observed, which indicates structural changes rather than functional changes in the ventricles.12 Therefore, the aim of the study was to assess ventricular function among controlled hypertensive patients with and without periodontitis.
Material and methods
The present study protocol was submitted to and approved by the Central Ethics Committee at the NITTE Deemed to be University, Mangalore, India (NU/CEC/2018/0197), and registered in the Clinical Trials Registry – India (CTRI) (CTRI/2018/08/015383). The study was conducted following the ethical regulations of the 1975 Declaration of Helsinki, as revised in 2013, and reported following the STROBE (STrengthening the Reporting of OBservational studies in Epidemiology). The study was conducted between August 2017 and August 2019.
The sample size (N) was calculated based on the following formula (Equation 1):
where:
N – sample size;
Z2 × (1− α) / 2 – confidence interval;
P – estimated proportion;
Q = 1 − P; and
d – desired precision.
The confidence interval was 95%, the estimated proportion was 0.091 and the desired precision was 5%.
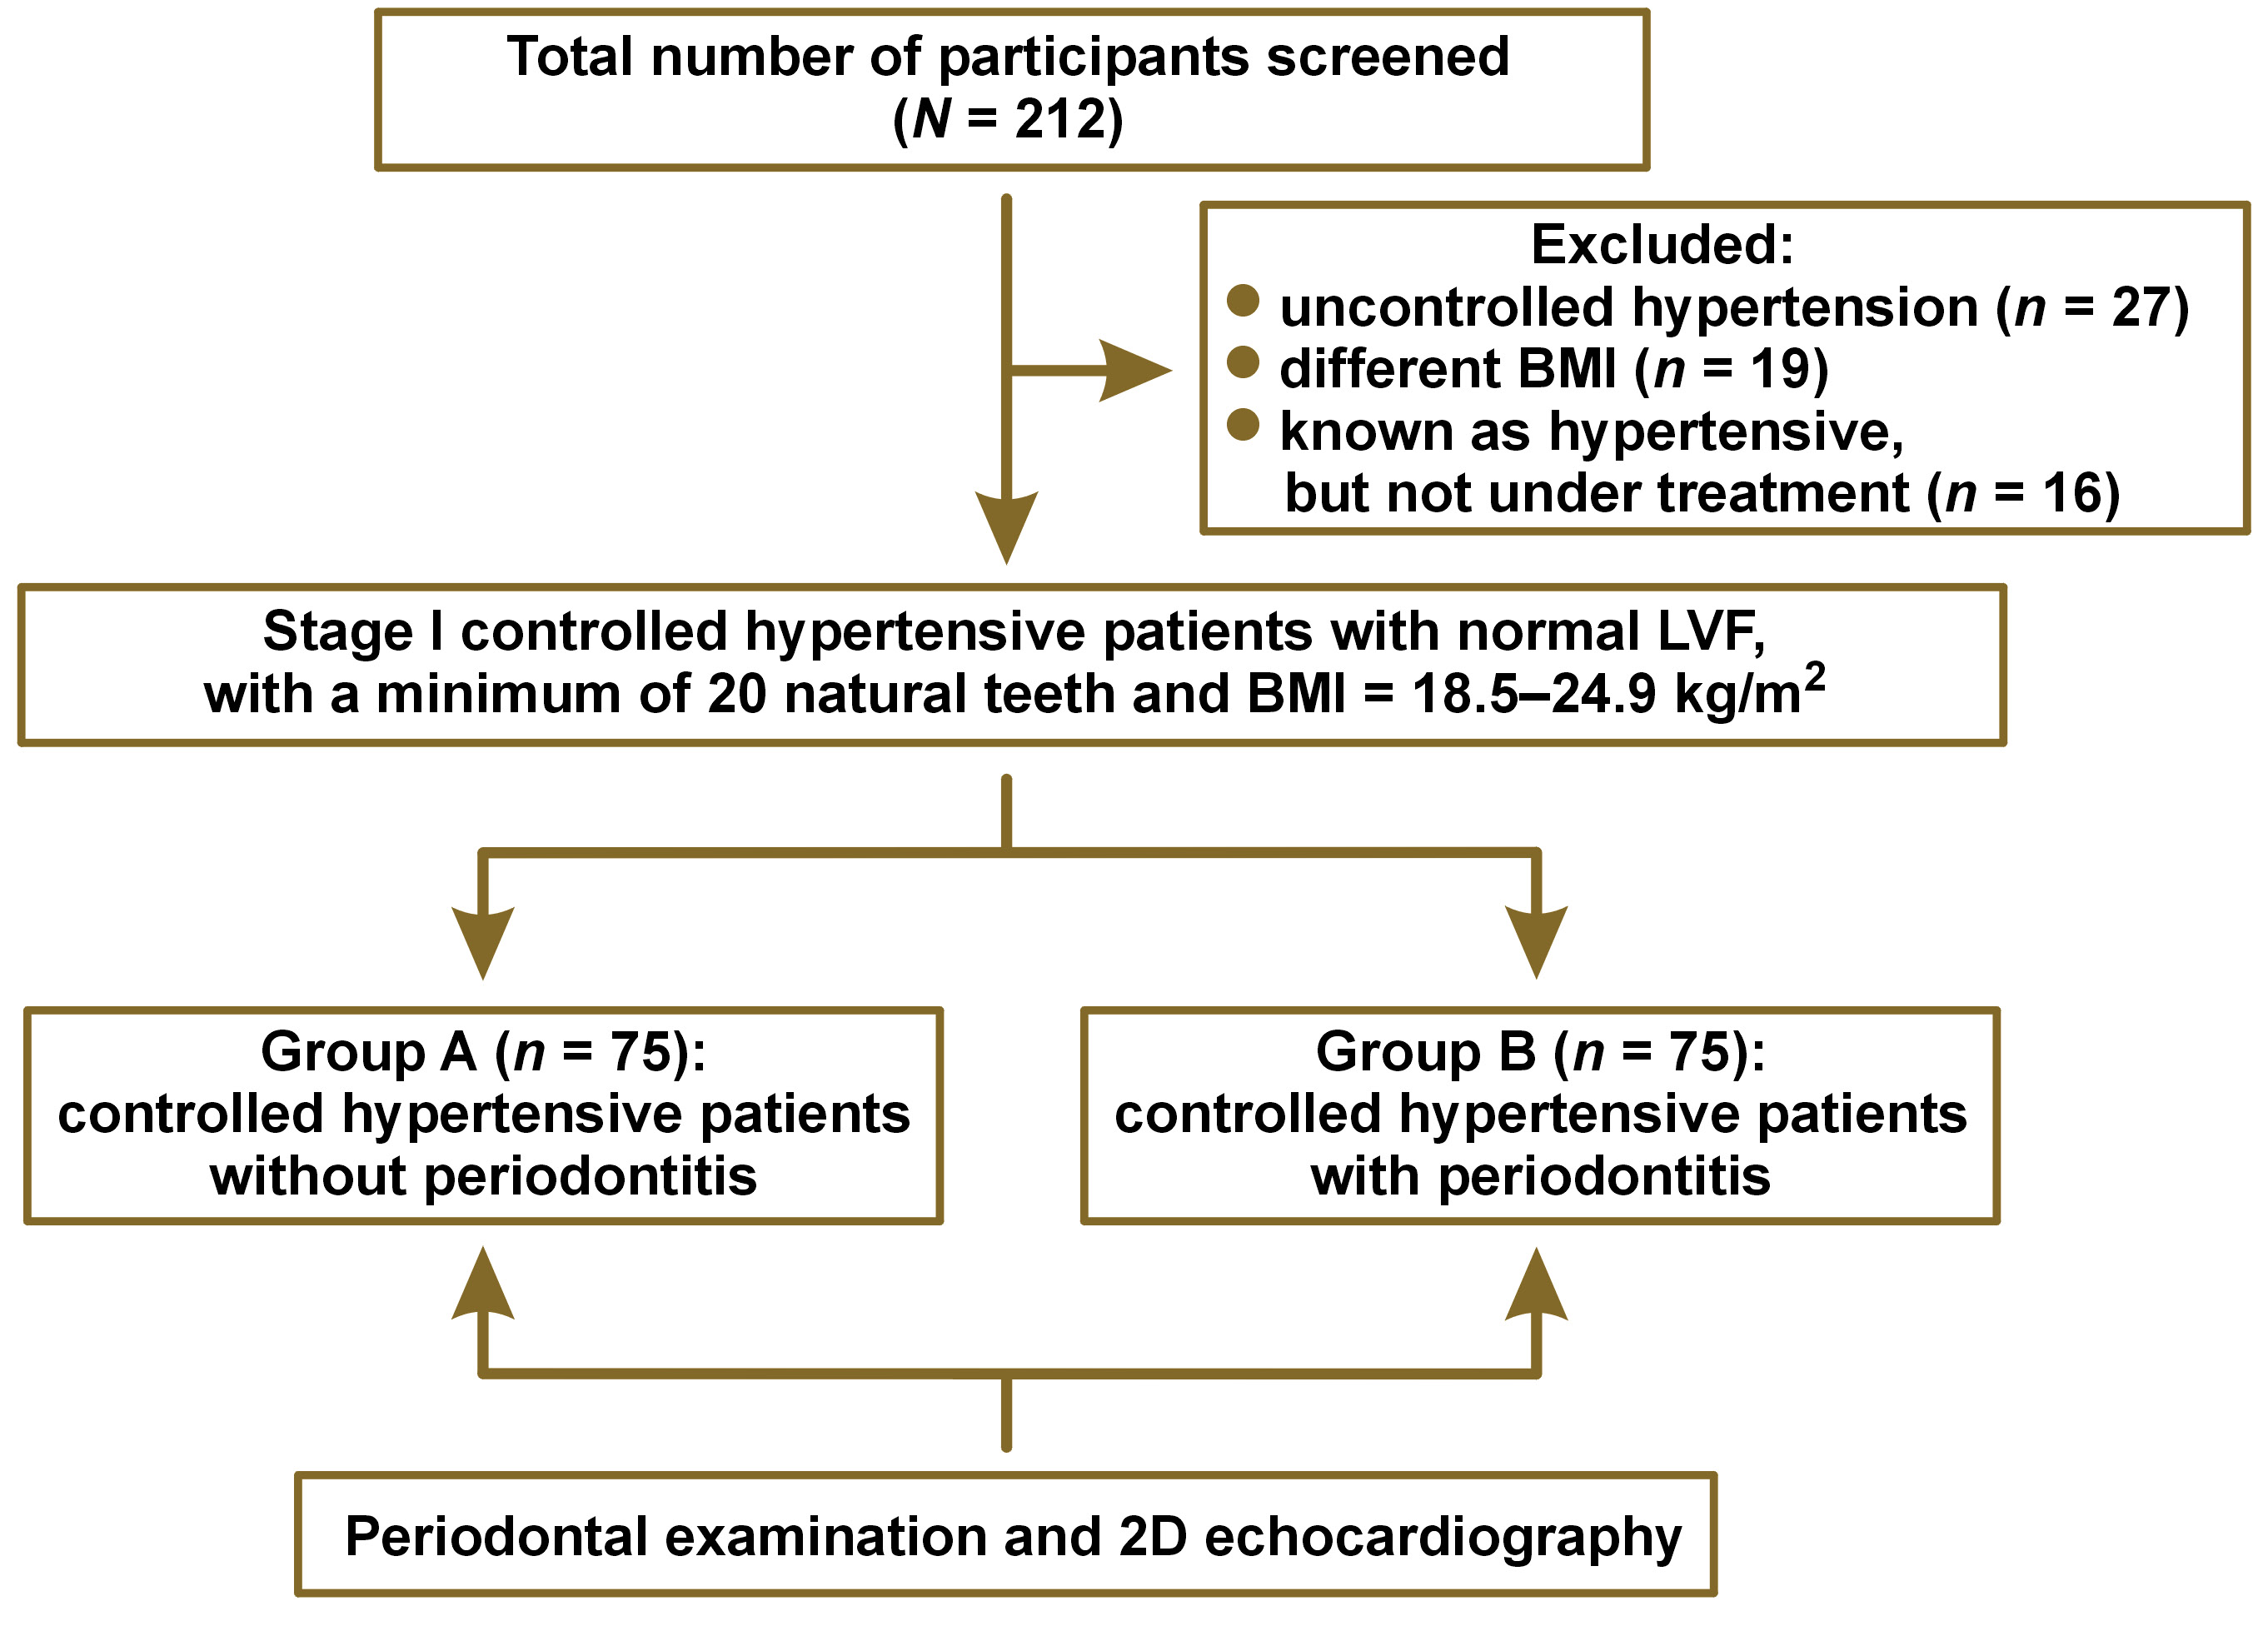
The current cross-sectional study involved 2 groups with an equal number of participants, 75 each. Group A consisted of controlled hypertensive patients without periodontitis. Patients with the sulcus depth of less than or equal to 3 mm, no bleeding on probing (BOP), no clinical attachment loss (CAL), no visual inflammation, and no mobility were considered as non-periodontitis patients. Group B involved controlled hypertensive patients with periodontitis. Patients with periodontitis had more than 30% of the sites with CAL ≥ 5 mm and probing pocket depth (PPD) ≥ 4 mm, as measured with the Hu-Friedy UNC-15 Color-Coded probe (Hu-Friedy, Chicago, USA) (stage III periodontitis).13
Stage I controlled hypertensive patients with normal LVF according to the Joint National Committee (JNC 8) hypertension guidelines,14 with a minimum of 20 natural teeth and a body mass index (BMI) of 18.5–24.9 kg/m2 were included in the study. Patients with any other congenital and developmental cardiac illness, malignancies and tumors, and self-reported current and former tobacco and alcohol users were excluded from the study (Figure 1).
Informed verbal and written consent was obtained from the selected patients prior to the study. One examiner (S.S.) was involved in the periodontal examination, and another examiner (S.K.) was involved in performing 2D echocardiography.
Calculation of the PISA score
The complete periodontal examination consisted in assessing PPD and CAL, calculated on all 6 surfaces of natural teeth, BOP, and recession, which was then used to calculate the PISA score.15 A freely downloadable spreadsheet to calculate the PISA score was obtained from www.parsprototo.info.
Calculation of GLS
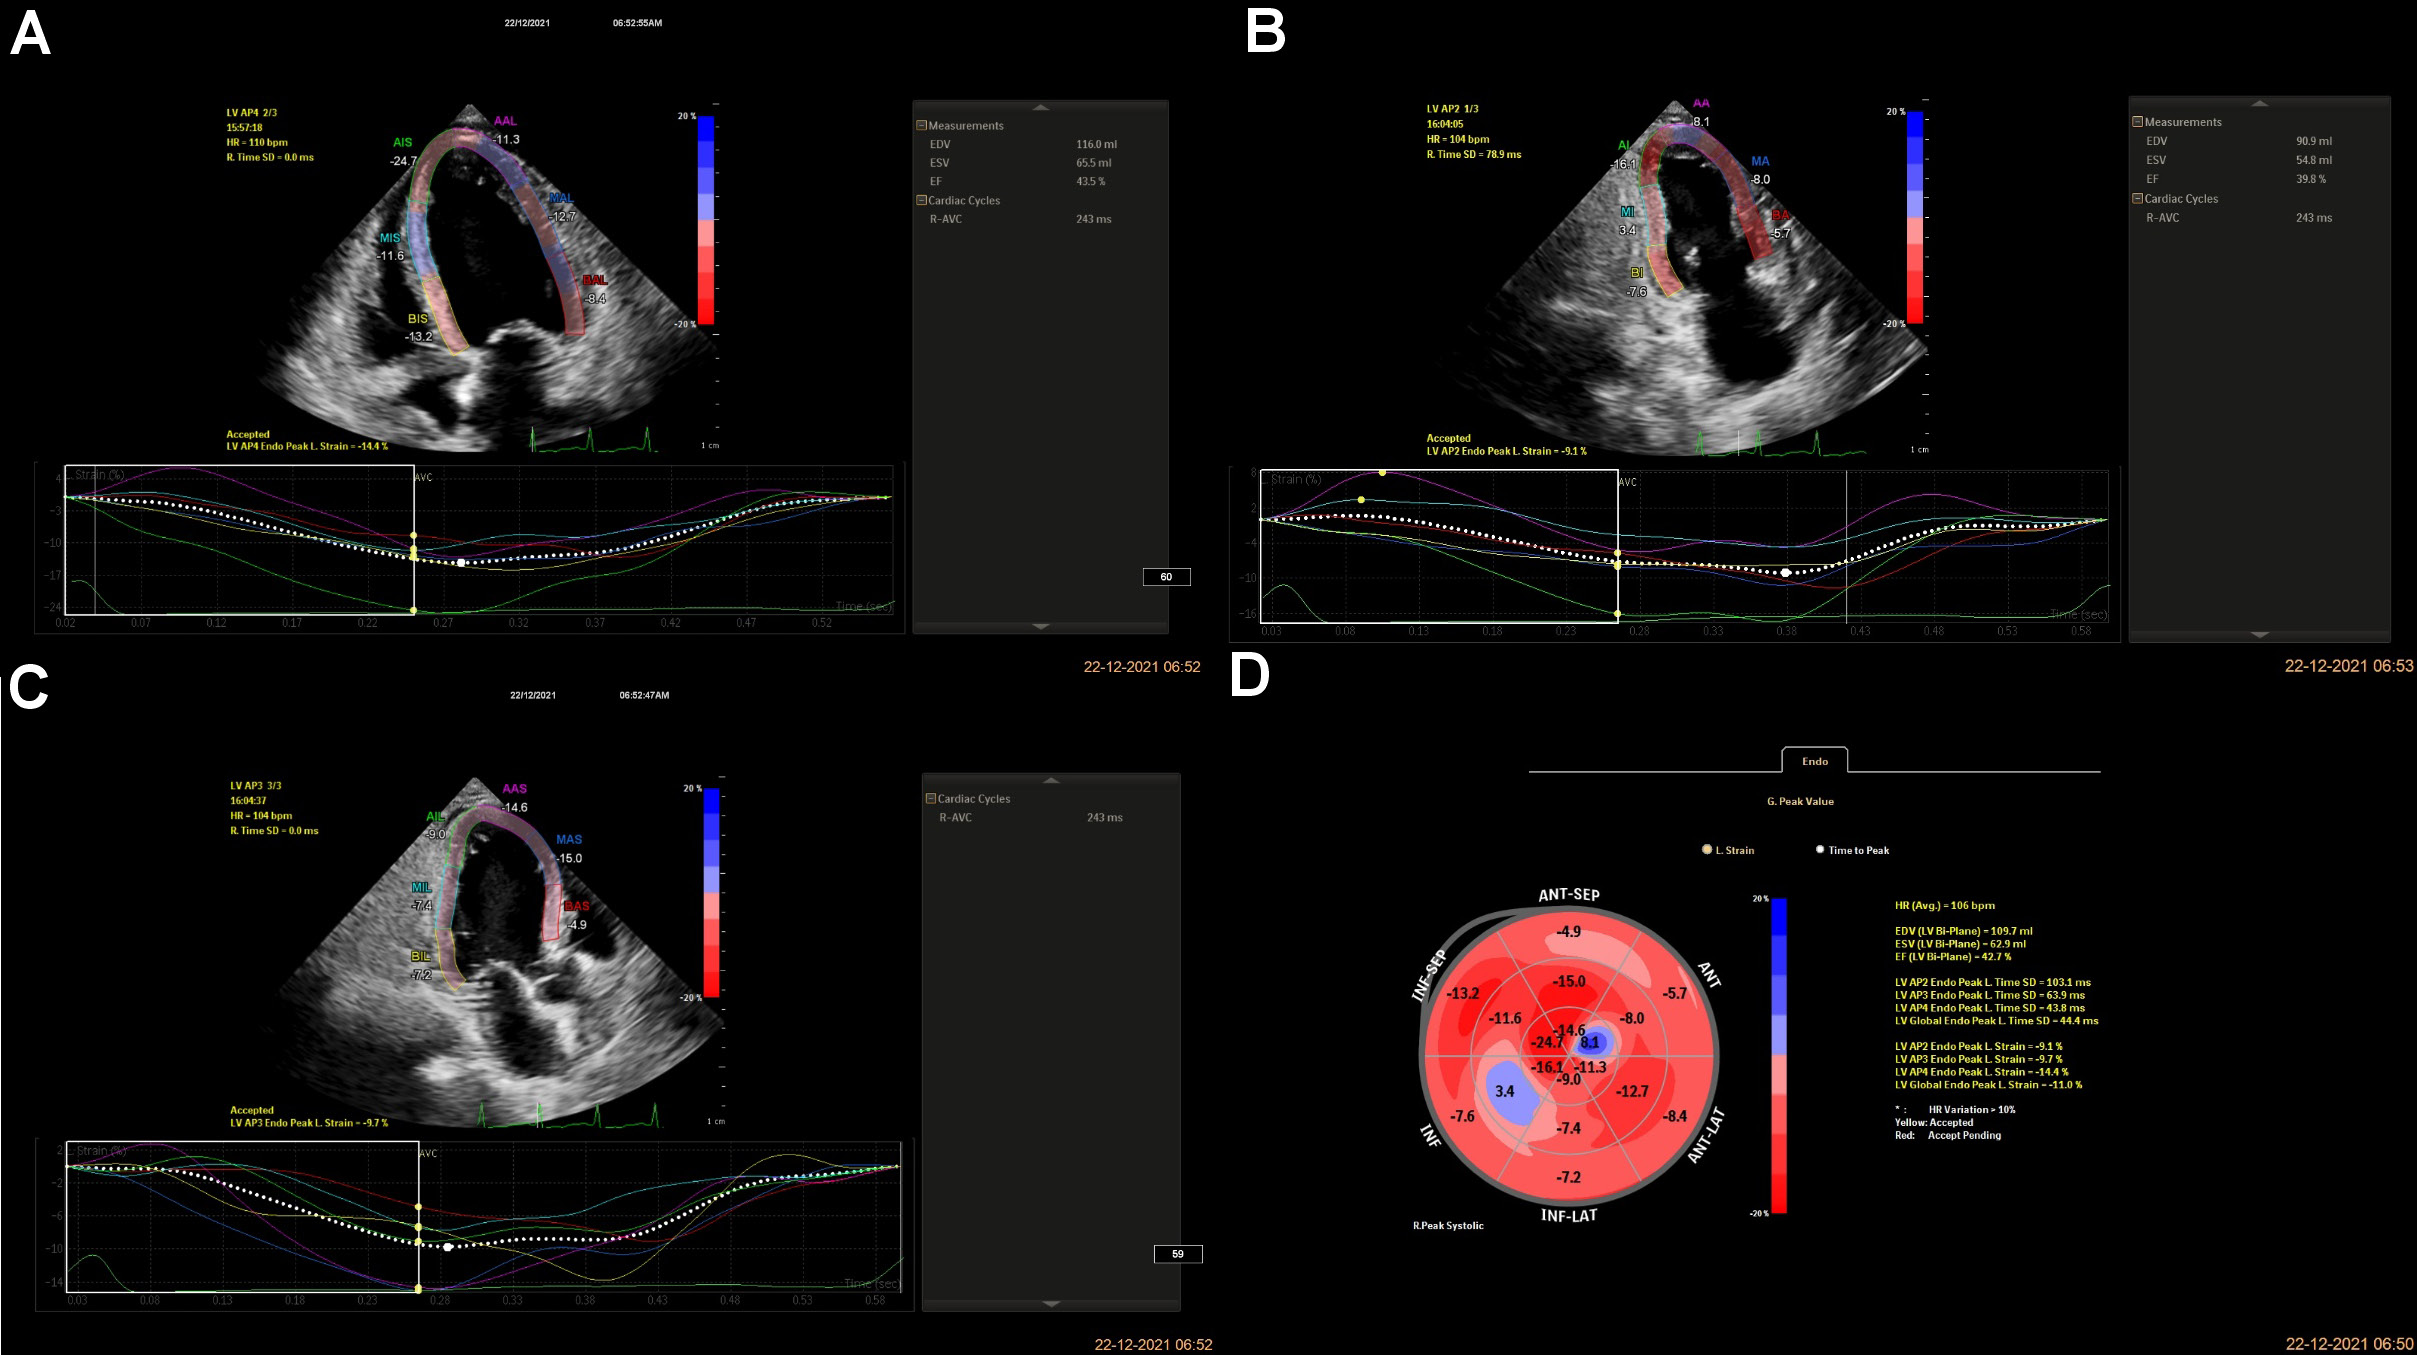
The patients were allowed to relax for 30 min before starting the procedure. A Doppler echocardiogram (EPIQ 7C 2.0.2.; Philips Healthcare, Andover, USA) with a transducer probe (X5-1 3D probe; frequency: 93 Hz) was used to evaluate the myocardial strain. The transducer probe was placed by a blinded examiner on the chest or abdomen of the subject to get various views of the heart using ultrasound. The GLS imaging is made in standard apical two-, three- and four-chamber views. The images were displayed on a monitor for real-time viewing and recorded by marking 3 specific points (the apex, the base and the septum, i.e., LVAP4, LVAP2 and LVAP3) manually within the myocardium. LVAP4, LVAP2, and LVAP3 represent LV apical four-chamber, two-chamber, and three-chamber views, respectively, and tracking these Doppler points enables the measurement of the strain rate by the machine (Figure 2). LVAP4 represents the longitudinal strain in a four-chamber view, LVAP2 represents the longitudinal strain in a two-chamber view and LVAP3 represents the longitudinal strain in a three-chamber view. The GLS is calculated as the average from all segments to measure the global LVF. The GLS rate was derived using the following formula (Equation 2) and expressed as percentage16:
where:
ε – strain;
t – time instance;
L – instantaneous length;
L0 – baseline length; and
∆V = velocity gradient in the segment;
Δε = ε × Δt; Δt = Δε / ε; ΔL = L − L0.
Statistical analysis
The collected data was entered into a Microsoft Excel spreadsheet and analyzed using IBM SPSS Statistics for Windows, v. 22.0 (IBM Corp., Armonk, USA). Descriptive data was presented as number and percentage (n (%)) for categorical variables, and as mean and standard deviation (M ±SD) and median and interquartile range (Me (IQR)) for continuous variables. The Mann–Whitney U test was used to compare the variables between the study groups. Spearman’s correlation test was used to assess the correlation between GLS and the study variables. Multiple linear regression was used to develop a model to predict GLS based on the study variables. A p-value <0.05was considered statistically significant.
Results
The mean age of the patients in group A was 52.80 ±5.25 years, and in group B, 53.00 ±5.70 years. The comparison of the variables between the study groups is presented in Table 1. Group B had significantly higher mean PPD, CAL, BOP, and PISA scores as compared to group A (p < 0.001).
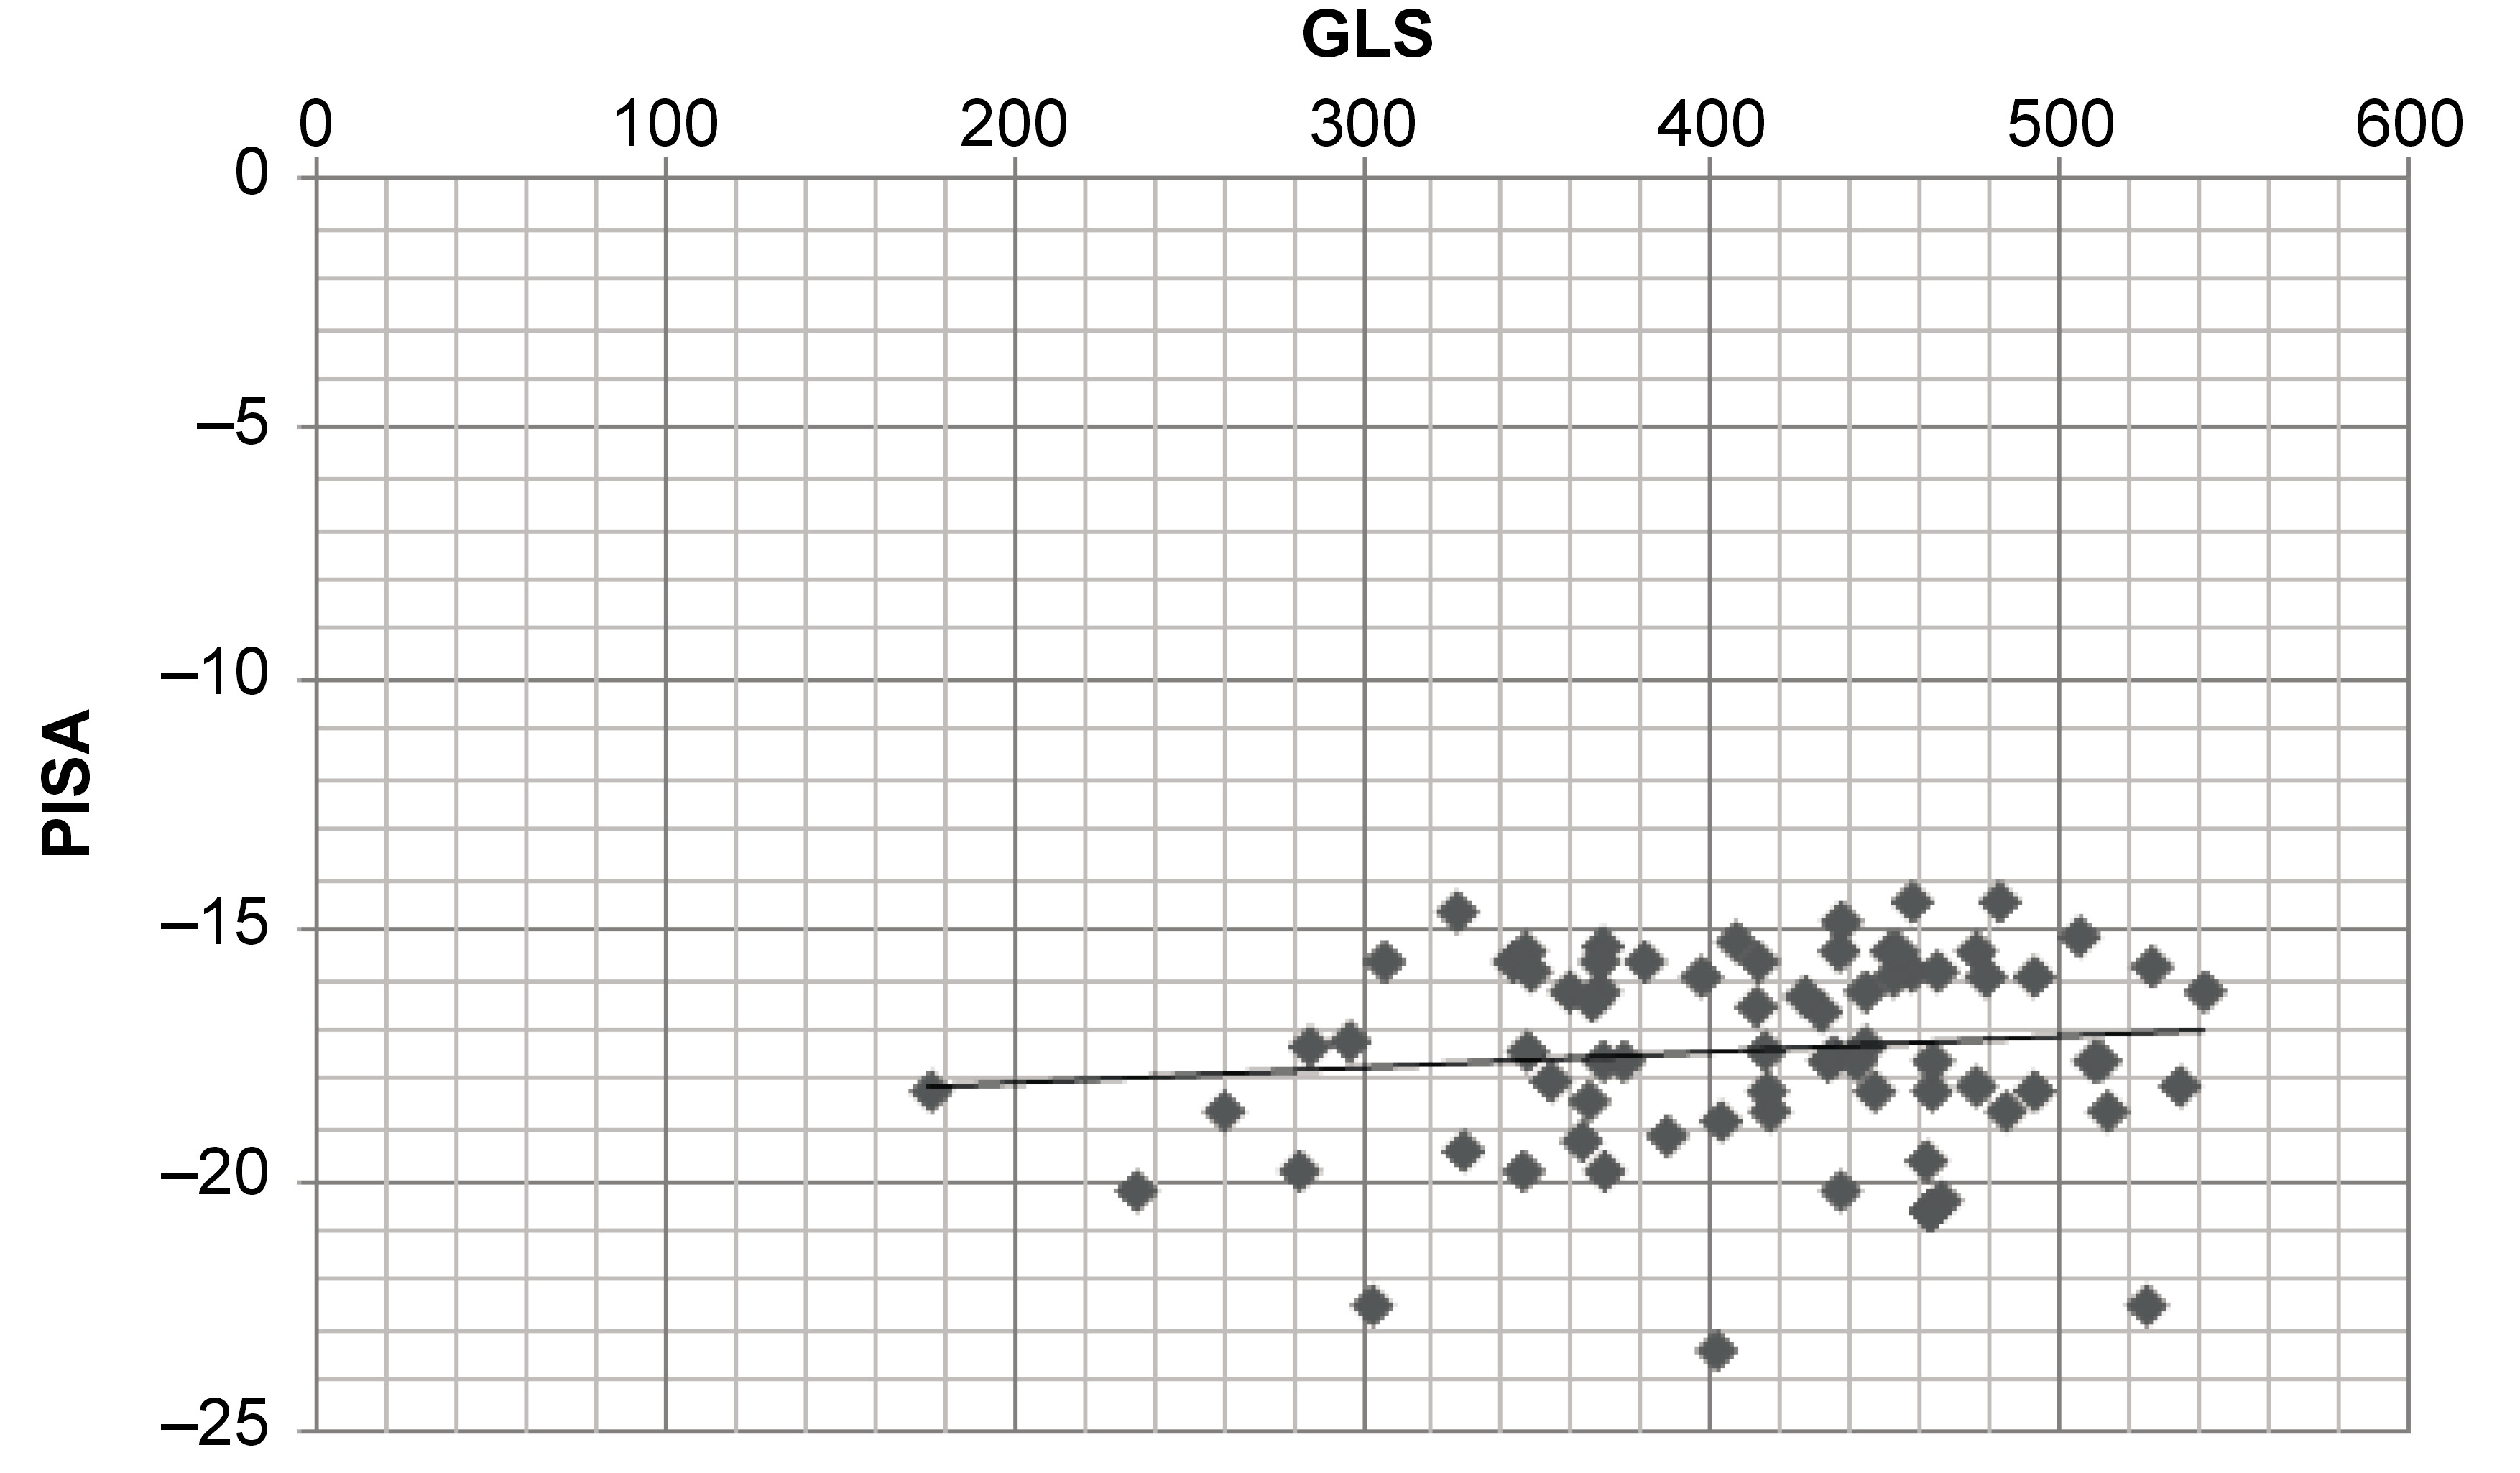
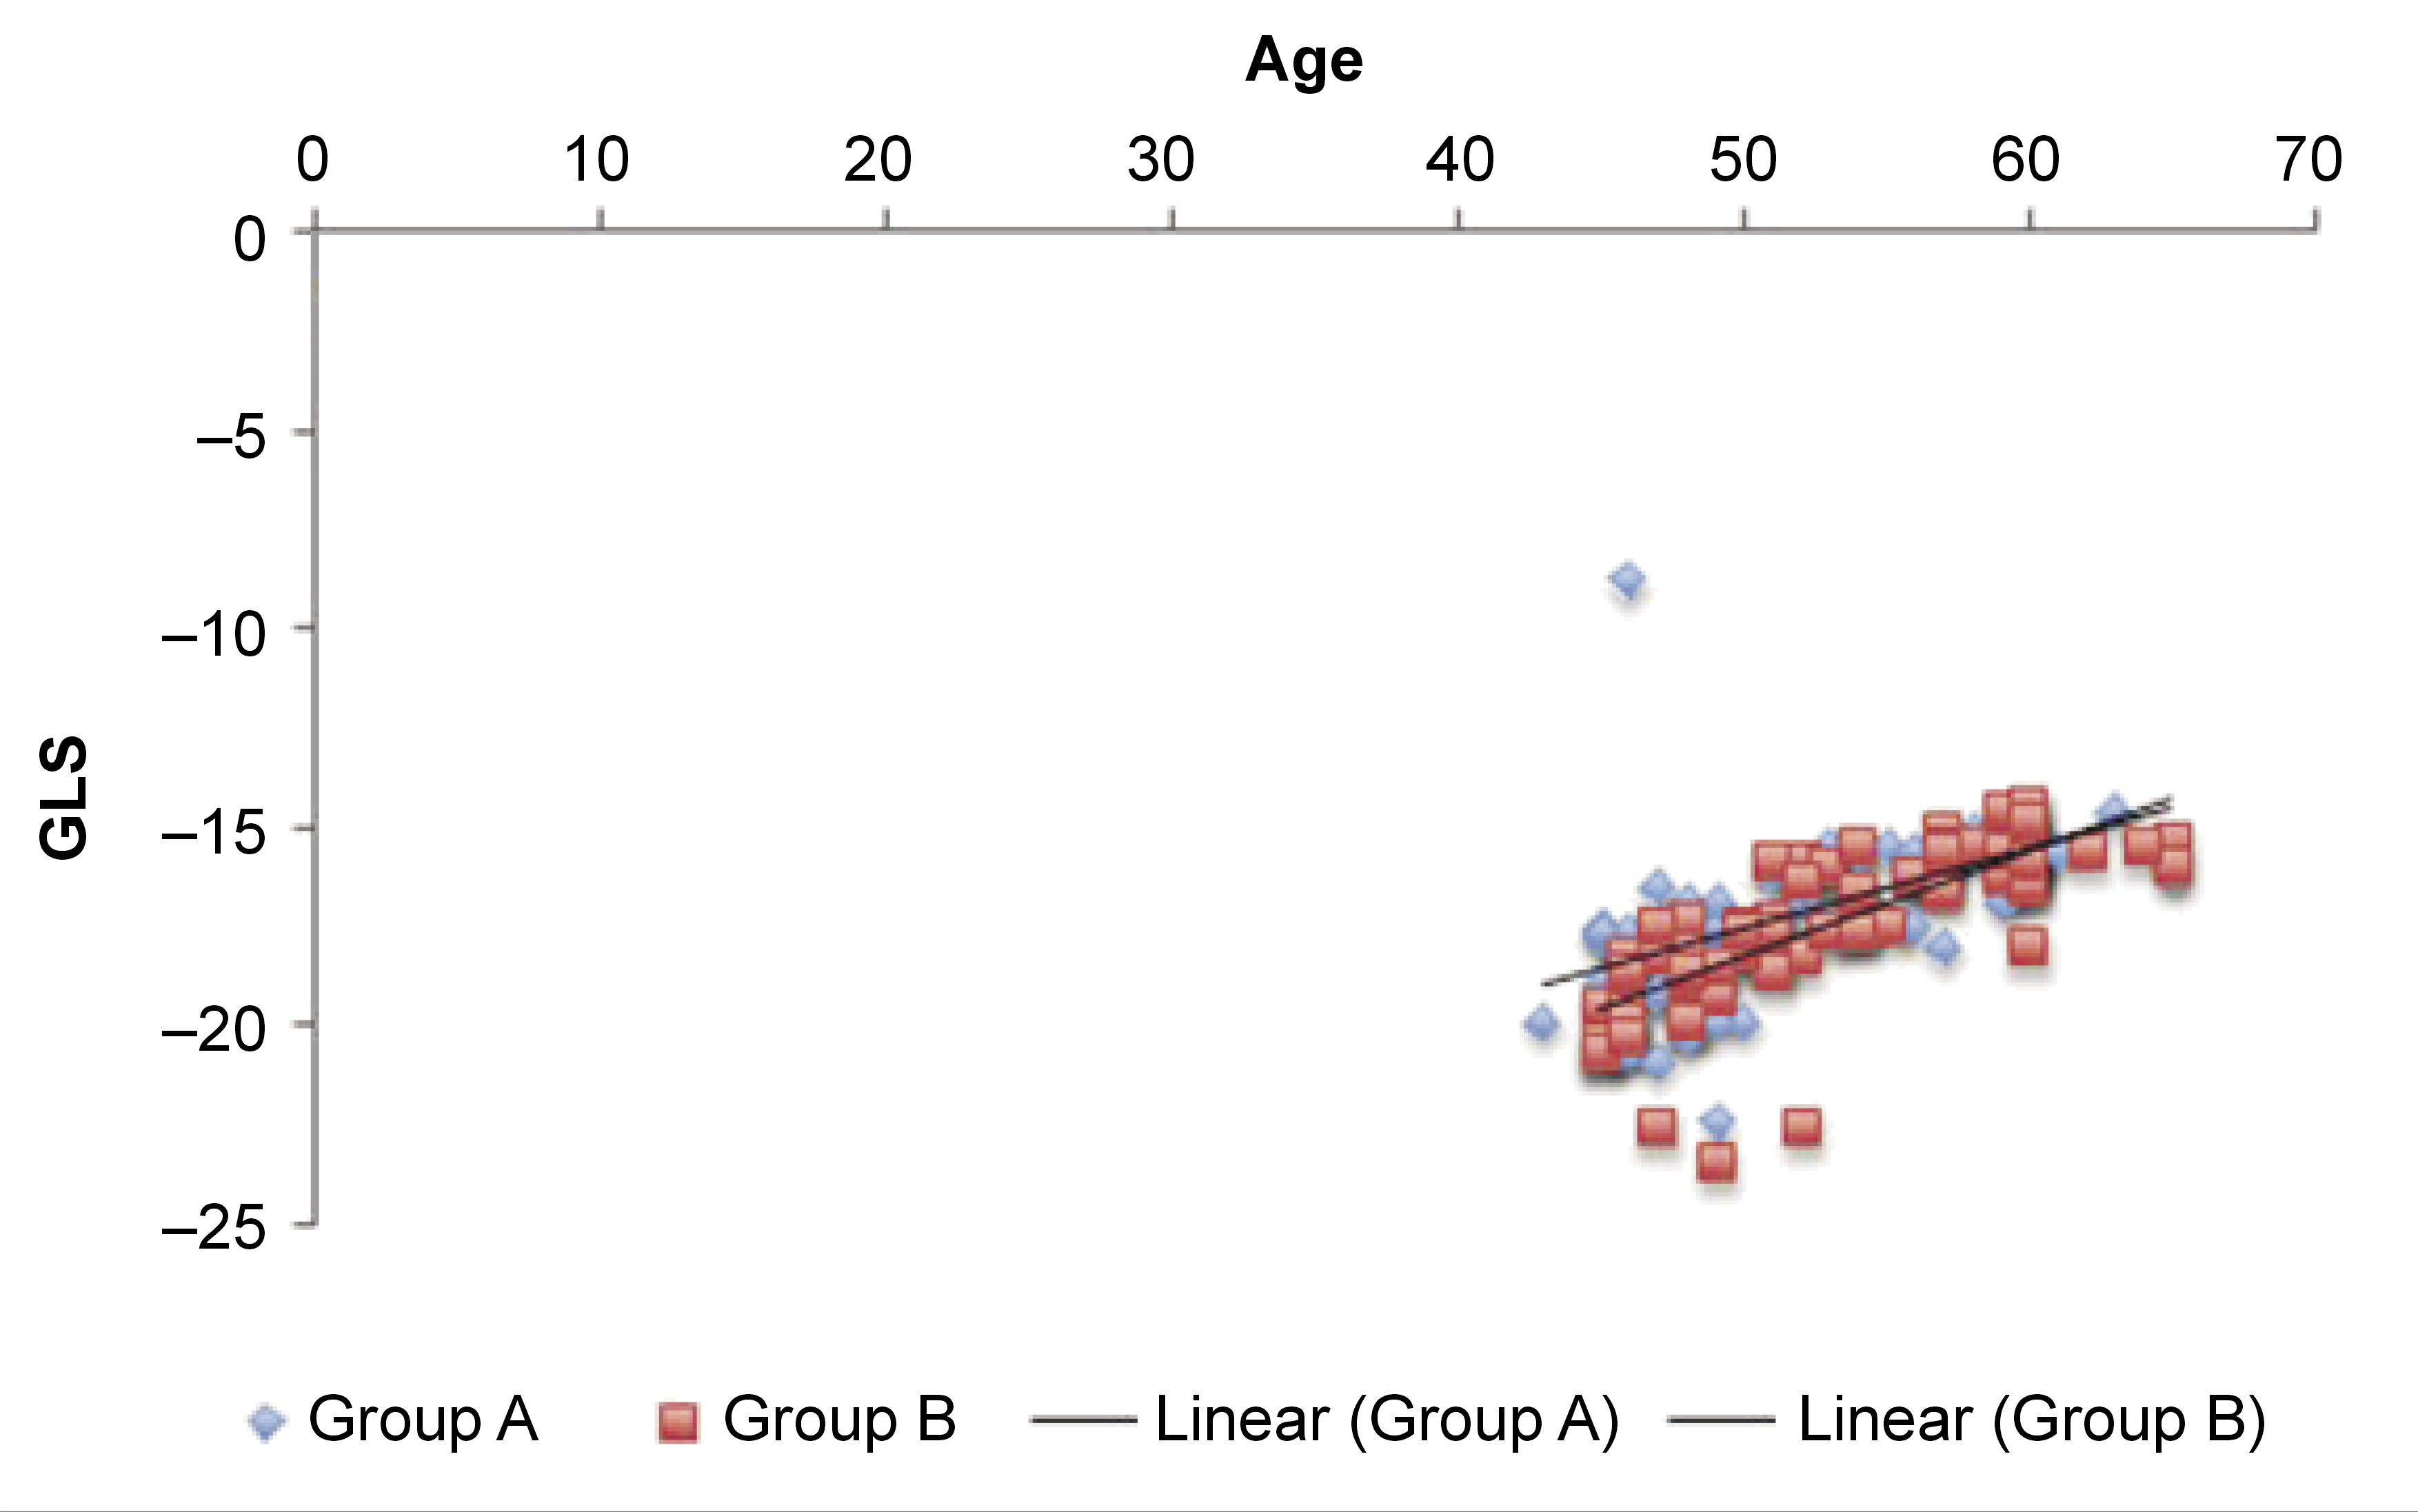
Multiple linear regression modeling suggested that LVAP4 was a statistically significant predictor of GLS in group A, and LVAP3, LVAP4 and EF were statistically significant predictors of GLS in group B (Table 2andTable 3). In both groups, age showed a significant positive correlation with GLS, whereas PISA had no association with GLS (p > 0.05) (Table 4 and Table 5). The correlations are presented in Figure 3 and Figure 4. The regression model resulted in 88% (R = 0.88) of change in GLS for group B (Table 2).
Discussion
A recent systematic review and meta-analysis, which included 7 studies and 4,307 participants, revealed a significant relationship between periodontitis and peripheral artery disease.17 However, very few studies have studied the relationship between the inflammatory component of periodontal disease and cardiovascular diseases. The PISA score reflects the surface area of the bleeding pocket epithelium, thereby quantifying the probability of a systemic inflammatory burden due to periodontitis, which may influence the development of atherosclerosis, LV dysfunction, or other cardiovascular complications.18 Among hypertensive patients, there is a significant decrease in the GLS rate and the global circumferential deformation due to subclinical LV dysfunction with the preserved EF.15 A possible mechanism could be the sustained elevated blood pressure in the arteries, which may affect LV relaxation and result in gradual LV hypertrophy, thereby leading to early diastolic dysfunction through the impaired LV longitudinal strain.19 Cytokines and nitro-oxidative stress have a direct negative inotropic effect, and thereby can promote myocardial ischemia, apoptosis and LV dysfunction.20 Thus, inflammatory-driven oxidative stress leads to vascular and myocardial dysfunction and fibrosis. Similarly, non-coronary inflammation, such as in chronic obstructive pulmonary disease, Kawasaki disease, rheumatoid arthritis, and others, has also been shown to influence LV dysfunction through the modestly altered inflammatory markers, leading to changes in ventricular mechanics. However, the mechanism through which periodontitis affects LVF has not been explained. It could be attributed to gram-negative anaerobic bacteria that invade superficial and deeper gingival tissues, thereby making it possible for the products of the pathogens to be released into the systemic circulation, which causes bacteremia.21 Akamatsu et al. noted that there were specific, elevated concentrations of interleukin-17A (IL-17A) and interferon-gamma (IFN-γ) mRNA expression in the hearts of mice after the injection of Porphyromonas gingivalis, and that the systemic inflammatory burden could induce myocarditis.22
This study utilized 2D echocardiography to obtain the GLS value, the most sensitive echocardiographic marker which decreases monotonically with progressive cardiac dysfunction. It is the GLS that typically varies according to age, gender and LV loading conditions.23 Defining abnormal GLS is not straightforward. However, based on a meta-analysis study, the average clinical range of GLS varies considerably from −15.9 to −22.1 (the percentage shortening of the long axis dimension), whereas a score of more than −15.9 is considered to be clinically abnormal strain.24
In this study, differences in the GLS scores between the A and B groups were not statistically significant (p > 0.05) (Table 1). However, when clinically abnormal strain values are considered, i.e., GLS scores > −15.9, group B patients were experiencing an abnormal strain of −14.40 and the value was greater as compared to group A patients (Table 1), which is likely an indication of mild LV strain for the increased PISA scores. As previously reported by Park et al., a 1% abnormal strain on the myocardium increases the patient’s mortality risk by 5%.25 Thus, in the current study, group B patients could be at risk of developing a future cardiovascular event. The PISA score is a better indicator of the inflammatory load experienced by patients than PPD and CAL, as the latter refer only to linear measurements and do not indicate the systemic effects of the inflammation. Moreover, as periodontitis is of microbial origin, PISA could be considered an indicator of microbial infection.26 Also, the generalized linear model analysis revealed a significant association between PISA and the level of high-sensitivity C-reactive protein (hs-CRP); therefore, PISA could be an effective index for estimating the effect of periodontitis on the whole body, enabling medical-dental cooperation.27 This could explain why the inflammation caused by periodontitis in group B patients resulted in a systemic inflammatory burden, and hence led to mild LV dysfunction.
Based on the depicted values, the mean PISA score was significantly higher in group B (411.46 ±74.37) as compared to Group A (74.57 ±12.04) (p < 0.05) (Table 1). Furthermore, the mean PISA scores did not show any statistically significant influence on the GLS scores (p > 0.05) (Table 4 and Table 5). This might be due to the fact that PISA did not reach a threshold level that could influence myocardial activity. Besides, the recruited patients were on anti-hypertensive therapy, which would have improved myocardial activity, thereby limiting the influence of PISA on the GLS scores.15, 28 However, this can be further verified using longitudinal studies. Also, multivariate linear regression analysis showed that for group B, 87.4% of the variation in the GLS rate was predicted due to the independent variable (PISA), whereby for every one-unit increase in the PISA score, there was an abnormal strain rate alteration of 7.54 × 10⁻⁵ (Table 2). Hence, in our study, it is pertinent that an increase in the GLS score, which is suggestive of the abnormal strain pattern, can result in an increased mortality risk in the future.
The current study also strengthened the following existing evidence:
1) Despite the preserved EF, subclinical LV dysfunction was observed, which proves that the GLS assessment is more sensitive to early LV dysfunction in comparison with the EF assessment.29
2) Age could be considered an independent risk factor for LV dysfunction, since aging results in decreased cardiac deformation, and ultimately in increased LV stiffness.30
The current research could be improved by including the lipid profiles of the individuals and the systemic inflammatory component driven by periodontal disease, as well as by optimizing the use of hypertensive medication. Additionally, it is advised to use a larger sample size.
Conclusions
The current study attempted to explore the influence of periodontitis on ventricular mechanics by utilizing 2D echocardiography. Although the observed values were not statistically indicative of any relationship between the 2 variables, clinically undetectable inflammatory insult due to periodontitis might have resulted in mildly altered ventricular mechanics. However, future longitudinal studies with long-term follow-ups could prove a stronger association between periodontitis and LVF.
Trial registration
The research was registered in the Clinical Trials Registry – India (CTRI) (CTRI/2018/08/015383).
Ethics approval and consent to participate
The present study protocol was approved by the Central Ethics Committee at the NITTE Deemed to be University, Mangalore, India (NU/CEC/2018/0197). Informed verbal and written consent was obtained from the selected patients prior to the study.
Data availability
The datasets generated and/or analyzed during the current study are available from the corresponding author on reasonable request.
Consent for publication
Not applicable.