Abstract
Background. Pregnancy and diabetes increase the risk of developing pathological conditions in the periodontium. Salivary biomarkers, such as matrix metalloproteinase-9 (MMP-9), as well as antioxidants can be used as diagnostic indicators in monitoring periodontitis.
Objectives. The aim of the study was to assess the periodontal status of pregnant women with regard to the presence of diabetes. In addition, we aimed to assess antioxidant activity and the level of MMP-9 in saliva in order to establish the optimal noninvasive determinants of periodontitis.
Material and methods. The study included 104 pregnant women: 35 patients had gestational diabetes mellitus (GDM); 30 patients had type 1 diabetes (T1D); and 39 patients did not have diabetes (the control group). The physical examination included the assessment of the approximal plaque index (API), the gingival index (GI), bleeding on probing (BOP), the probing pocket depth (PPD), and clinical attachment loss (CAL). In the saliva study, MMP-9 concentration as well as the ferric reducing ability of plasma (FRAP), and the activity of superoxide dismutase (SOD), glutathione reductase (GR) and glutathione peroxidase (GPX) were measured.
Results. The pregnant patients with GDM and T1D had higher GI, BOP, PPD, and CAL scores than the control women (p < 0.0001, p = 0.0040, p = 0.0100, p = 0.0030, and p < 0.0001, p < 0.0009, p < 0.0001, p < 0.0001, respectively). The T1D patients had higher API scores as compared to the control women (p = 0.0010). The patients with periodontitis had higher salivary MMP-9 levels than the patients without periodontitis (p = 0.0001). The salivary antioxidant levels and activity were comparable among the study groups. The determinants of periodontitis (p < 0.0001) were MMP-9 concentration (p = 0.0008) and oral hygiene (p = 0.0001). The concentration of MMP-9 was also a useful determiner of the presence of periodontitis (p < 0.0001).
Conclusions. In the pregnant women with diabetes, we observed worse gingival conditions, deeper periodontal pockets and greater attachment loss in comparison with the women from the control group. The concentration of MMP-9 in saliva is a good predictor of periodontitis and might be a useful tool for diagnosing periodontitis.
Keywords: pregnancy, periodontitis, diabetes, saliva, MMP-9
Introduction
Periodontitis is a common chronic bacterial inflammatory disease.1 It is an infectious disease that affects the soft tissues surrounding the teeth, and leads to progressive bone loss and clinical attachment loss (CAL). As periodontitis progresses, periodontal pockets develop, which may further advance to tooth displacement, tooth loosening, and eventually tooth loss. Periodontitis is commonly accompanied by gingival bleeding and halitosis.2
Current knowledge indicates that periodontitis is a multifactorial disease that results from the interactions between individual host-related factors and environmental factors.3 Periodontitis is initiated as a primary inflammatory reaction to pathogens, and bacterial lipopolysaccharides, collagenases, capsular polysaccharides, and fimbriae; it is sustained by their constant presence as dental plaque biofilm.4 As a result, CAL occurs in periodontal tissues, causing the development of periodontal pockets that are further colonized by bacteria. The secondary inflammatory response of the gingiva involves the gathering of immune cells, and the production of interleukins (ILs), proteases, tumor necrosis factor alpha (TNF-α), and C-reactive protein (CRP).5 Proteases constitute a large group of enzymes that include matrix metalloproteinases (MMPs). The essential contribution of MMPs in periodontal remodeling involves the vital pathways of tissue destruction, collagen proteoglycans and the degradation of other matrix components.6, 7 Metalloproteinase-9 (MMP-9), which is a product of neutrophilic white blood cells, plays a crucial role in connective tissue decay in periodontal diseases. High MMP-9 concentration in periodontal tissues leads to CAL, weaker tissue structure and delayed healing, which are more prominent in people with chronic forms of periodontitis than in healthy adults.8
Furthermore, the inflammatory process triggers the production of reactive oxygen species (ROS) by host cells in response to bacterial challenges, which constitutes an important defense mechanism.9 Increased ROS levels may also cause tissue and structural damage, and contribute to the development of CAL.10 Along with the inflammatory process, protective mechanisms are activated, including the production of salivary antioxidants – catalase (CAT), superoxide dismutase (SOD), glutathione reductase (GR), and glutathione peroxidase (GPX) –to reduce the potential tissue damage.11, 12
The major antioxidants include SOD, which inactivates superoxide anion radicals in the extracellular space,13 glutathione (GSH), which is considered one of the most important antioxidants involved in the inflammatory process, GPX, which takes part in the reduction of hydrogen peroxide with the simultaneous conversion of reduced glutathione into its oxidized form, and GR, which maintains normal GSH concentration in the cell due to its ability to convert oxidized glutathione (GSSG) into its reduced form.14 It is possible to determine the activity of individual antioxidants as well as the overall antioxidant capacity. Determining the total antioxidant capacity (TAC) allows researchers to assess the activity of the aforementioned antioxidants in addition to numerous other molecules that have antioxidant properties. The method is used to test the antioxidant capacity of biological samples and to demonstrate the ability of the organism to destroy ROS. The interaction between different antioxidants often results in better protection than might be expected from the antioxidant properties of individual compounds.11
The clinical effect of periodontitis results from a balance between the severity of bacterial colonization, the inflammatory process and defensive mechanisms.3
It is essential for pregnant women to receive dental, particularly periodontal, health care.15 Pregnancy is associated with the risk of progression of prior periodontitis or the development of pregnancy gingivitis, which is most severe during the 3rd trimester of pregnancy. These diseases are associated with numerous complications, including preeclampsia, preterm birth and low birth weight.16 Periodontitis is further aggravated by diabetes, which decreases the neutrophil activity in the area of the periodontal pocket and impedes the wound healing process due to collagen homeostasis disorders, the formation of advanced glycation end-products (AGE) and the release of excess proinflammatory cytokines.17
The diagnosis of periodontitis in pregnant women is challenging due to limitations in X-ray exposure, and consequently radiological imaging. Despite the fact that the amount of radiation in a dental X-ray is very low and insufficient to have adverse effects on a developing fetus, pregnant women often have concerns about taking X-rays.18 Therefore, the potential investigations to obviate the need for radiological exposure in order to diagnose periodontitis are of significant clinical value. Salivary sample collection is easy and not time-consuming; if properly assessed, saliva samples can be useful to support standard periodontal examinations in diagnosing periodontitis.
Therefore, the aim of the present study was to assess the health status of the gingiva and periodontium of pregnant women with regard to the presence of 2 different forms of diabetes. Additionally, we aimed to assess antioxidant activity and the level of MMP-9 in saliva in order to establish the optimal noninvasive determinants of periodontitis.
Material and methods
Patients
The study participants were recruited between March 2014 and November 2015 from among pregnant women diagnosed with diabetes and treated in the Department of Metabolic Diseases of the Jagiellonian University Medical College, Cracow, Poland. In terms of numbers, the matched control group participants were recruited during the same period amongst pregnant women without diabetes from the Department of Gynecology and Obstetrics of Jagiellonian University Medical College. The patients were eligible to participate in the study if they: (1) provided informed consent; (2) were over 18 years of age; and (3) were in the 3rd trimester of pregnancy. The diagnoses of gestational diabetes mellitus (GDM) or type 1 diabetes (T1D) were made by the principal physician according to the guidelines of the Polish Diabetes Association (Diabetes Poland).19 The patients were excluded if they: (1) did not provide informed consent; (2) had other tpes of diabetes; (3) had salivary gland diseases that could potentially cause salivary excretion disturbances; (4) were diagnosed with other metabolic conditions affecting the metabolism of carbohydrates; (5) had a primary or secondary immunodeficiency disorder; (6) presented with an active inflammatory or infectious process; or (7) were taking medications that could affect the biochemical composition of their saliva. The study protocol was in accordance with the ethical guidelines of the 1975 Declaration of Helsinki and was approved by the institutional Ethics Committee at Jagiellonian University Collegium Medicum (KBET/270/B/2013). Informed consent was obtained from each patient prior to participation in the study.
A medical history was obtained from each patient based on medical records. Each patient underwent an oral examination and saliva samples were collected at the same time. Data collection included the information regarding concomitant diseases, medications, the course of diabetes, the current glikemia, a family history of diabetes, and the presence and type of oral symptoms.
Clinical assessment
An experienced dentist (J.W.) carried out full-mouth examinations in each subject. The physical examination was performed using a dental mouth mirror and a fixed periodontal probe (PCP12; Hu-Friedy, Chicago, USA). The oral examination included the assessment of the gums and periodontium, and the measurements of the following parameters: gingival index (GI) according to Löe and Silness; bleeding on probing (BOP); probing pocket depth (PPD); and CAL.
The GI assessment was based on the visual features of gingivitis, and the presence of bleeding from 6 selected teeth (16, 12, 24, 36, 32, and 44) on the vestibular, lingual, mesial, and distal surfaces. In the case of the absence of any of the aforementioned teeth, the condition of the gums at the next adjacent tooth was determined. The condition of the gums was graded from 0 to 3 for each side, and then the average value of the index for each tooth was calculated. The mean value for each patient was calculated from the sum of the dental index scores divided by their number. The higher the value, the more severe gingivitis.20 The BOP was determined with the use of a periodontal probe; it was defined as the presence of any bleeding during the probing of the periodontal pocket at 6 points (the buccal-mesial, midbuccal, buccal-distal, lingual-mesial, midlingual, and lingual-distal sites) for each tooth and presented as a percentage. The presence of bleeding was recorded for up to 30 s after probing.21
The PPD was evaluated for each tooth with a periodontal probe by measuring the distance between the gingival margin and the bottom of the periodontal pocket. The measurement was performed parallel to the long axis of each tooth, in direct contact with the root of the tooth. The CAL was measured for each tooth with a periodontal probe as a distance between the bottom of the pocket and the cementoenamel junction. The PPD and CAL measurements were made at 6 points (the buccal-mesial, midbuccal, buccal-distal, lingual-mesial, midlingual, and lingual-distal sites), and the mean values were calculated for each tooth, except for third molars. The averages of the PPD and CAL values for each patient were calculated and expressed in millimeters.
The approximal plaque index (API) was defined as the number of interdental spaces with the presence of dental plaque divided by the number of all spaces assessed; it was expressed as a percentage. In quadrants I and III, the examination was conducted on the lingual side, whereas in quadrants II and IV, the examination was conducted on the buccal side.20
Periodontal health was assessed based on the report of the 2017 World Workshop on the Classification of Periodontal and Peri-Implant Diseases and Conditions.22 Periodontally healthy women had BOP < 10% and no sites with PPD > 3 mm. Gingivitis was diagnosed as having BOP ≥ 10% and PPD ≤ 3mm. The higher the BOP, the more severe the inflammation.22 Periodontitis was diagnosed if: (1) interdental CAL was detectable at 2 or more non-adjacent teeth; or (2) buccal/oral CAL ≥ 3 mm with PPD > 3 mm was detectable at 2 or more teeth, and the observed CAL could not be ascribed to non-periodontal causes.23 Additionally, tooth loss due to periodontitis was assessed, while alveolar bone loss on radiography was not assessed.
The fasting plasma glucose (FPG) levels were determined on the day of the dental examination.
Saliva collection
Two samples of 1 mL of unstimulated saliva were collected from each patient. The sampling was performed between 8 a.m. and 11 a.m., at least 1 h after the last meal and before the dental examination so that to avoid blood contamination. The calibrated tubes were filled with saliva freely flowing from the mouth. The samples were immediately centrifuged at 10,000 g for 5 min at 4°C, and then frozen and stored at −80°C until the sample collection period was completed; they were thawed immediately before the assays were performed.
Saliva analysis
The analysis included the assessment of MMP-9 concentration, total antioxidant capacity (TAC), and the extracellular SOD activity, the GR activity and the GPX activity.
The concentration of MMP-9 was measured using the enzyme-linked immunosorbent assay (ELISA) (Quantikine® Human MMP-9 ELISA Kit; R&D Systems, Inc., Minneapolis, USA) and a micro-ELISA reader (ELx808™ Absorbance Microplate Reader; BioTek Instruments, Winooski, USA) according to the instructions provided by the manufacturers. The samples were analyzed in duplicate, immediately after the collection of all samples. The saliva samples were thawed and diluted at least 100-fold with Calibrator Diluent RD5-10, as recommended by the manufacturer. Due to the high concentration of MMP-9 found in saliva, the measurements were performed using face masks and gloves, with special attention paid to preventing the contamination of the samples and the reagents with the researcher’s saliva. According to the manufacturer, the minimum detectable dose of human MMP-9 is typically less than 0.156 ng/mL.
The SOD activity was measured using the Misra and Fridovich method, which is based on the inhibition of the auto-oxidation of adrenaline to adrenochrome at alkaline pH.24 The measurement was conducted at wavelength λ = 480 nm.
Total antioxidant capacity was measured using the Benzie and Strain ferric reducing ability of plasma (FRAP) method.25 It was based on the assessment of the ability to reduce Fe3+ ions present in a complex form with tripyridyltriazine (Fe3+-TPTZ) by the low-molecular-weight antioxidants contained in the test biological material. The resulting Fe2+-TPTZ complex is characterized by an intense blue color and has a maximum absorption at wavelength λ = 593 nm.
The modified Goldberg method26 was used to measure the GR activity. Glutathione reductase catalyzes the reduction of GSSG in the presence of nicotinamide adenine dinucleotide phosphate (NADPH), which is oxidized to NADP+. A decrease in the NADPH absorbance was measured at 412 nm.
The GPX activity was measured using the method described by Paglia and Valentine.27 Glutathione peroxidase is a catalyst for the oxidation of GSH. In the presence of GR and NADPH, GSSG is immediately converted to its reduced form with the simultaneous oxidation of NADPH to NADP+. A decrease in the NADPH absorbance was measured at 340 nm.
The antioxidant analysis was performed using the ELx808 Absorbance Microplate Reader (BioTek Instruments).
The measurements were performed at the Department of Diagnostics, Chair of Clinical Biochemistry, Jagiellonian University Medical College, Cracow, Poland.
Statistical analysis
Statistical analysis was performed using the STATISTICA PL data analysis software, v. 9.1 (StatSoft Polska, Cracow, Poland), and the MedCalc® program, v. 8.1.1.0 (https://www.medcalc.org/). Continuous variables are shown as median and interquartile range (Me (IQR)), and categorical variables as number and percentage (n (%)).
The parameters were compared between the patients with GDM, T1D and the control group. The Kruskal–Wallis test was used to compare continuous variables. The χ2 test was used for dichotomous variables. One repetition was performed for each measurement.
A logistic regression model with stepwise selection was used to assess the factors determining the presence of periodontitis. Variables for which the p-value was <0.20 were included. The results are presented with odds ratios (ORs) and confidence intervals (CIs). The level of significance was set at p < 0.05.
The receiver operating characteristics (ROS) analysis was performed to calculate the area under the curve (AUC), which describes the accuracy of a test, to discriminate periodontitis from healthy cases. The clinical signs of periodontitis were the reference standard against which the AUC of the MMP-9 level was assessed. For criteria with significant discriminative capacity, we calculated the sensitivity and specificity of the currently recommended cut-off values. Additionally, the cut-off values with the highest sensitivity and specificity were established for these criteria. The significance level was established at p < 0.05.
Results
Study group
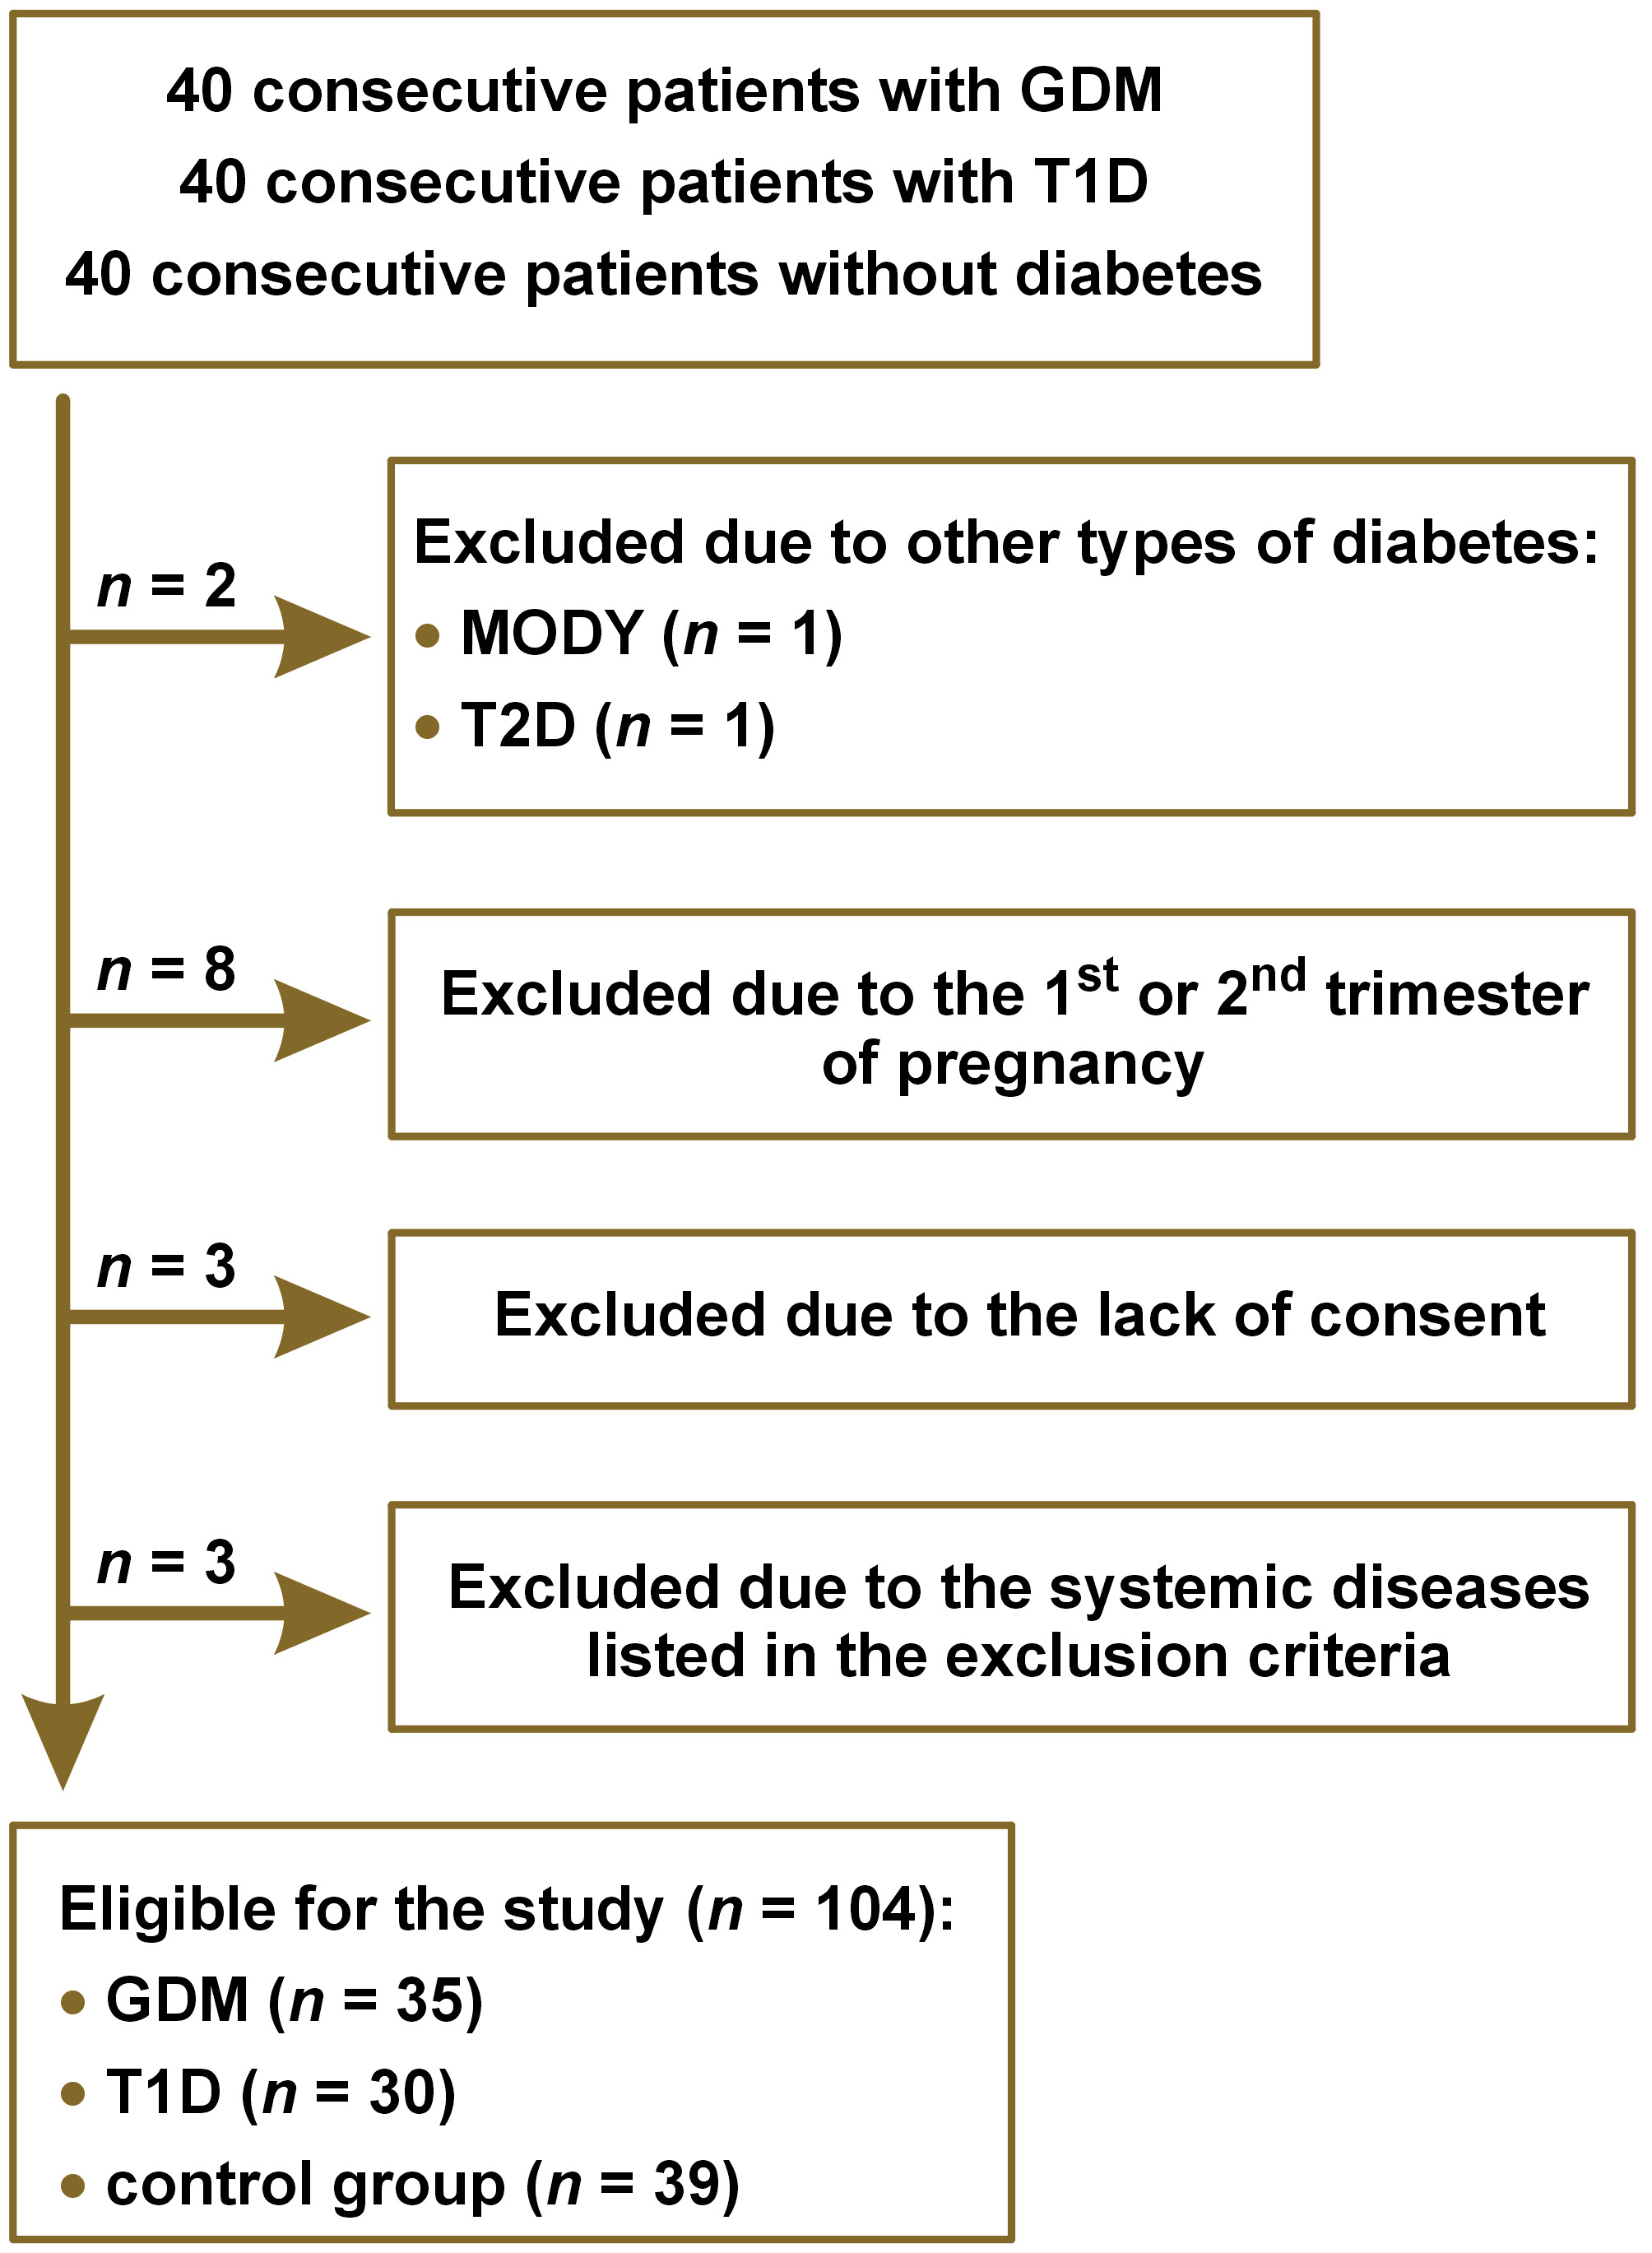
Out of 40 consecutive patients for each study group, 104 met the inclusion criteria: 35 patients with GDM; 30 patients with T1D; and 39 patients without diabetes (the control group), as presented in the flowchart (Figure 1). The groups did not differ in terms of age, height, body weight before pregnancy, body mass index (BMI) before pregnancy, body weight during pregnancy, number of pregnancies, number of miscarriages, prevalence of GDM in previous pregnancies, and prevalence of diabetes in the family. Hypothyroidism and Hashimoto thyroiditis were present more frequently in the patients with T1D than in the patients with GDM and in the control group (11 (36.7%) vs. 4 (11.4%), p = 0.0200; 11 (36.7%) vs. 6 (15.4%), p = 0.0001; and 10 (33.3%) vs. 1 (2.9%), p = 0.0010; 10 (33.3%) vs. 0 (0%), p = 0.0400, respectively). There were no differences between the groups in the frequency of other diseases. The concentration of FPG [mmol/L] was the highest in the patients with T1D, lower in the patients with GDM and the lowest in the control group (6.22 (5.16‒7.55) vs. 4.77 (4.50‒5.16) vs. 4.34 (4.14‒4.82), respectively; p < 0.0001). The glycated hemoglobin (HbA1c) level in the T1D patients was 5.75% (5.10–6.10%). The baseline characteristics of the study groups are presented in Table 1.
Health status of the gingiva
and periodontium
The patients with GDM and T1D and those in the control group did not differ in terms of frequency of occurrence and type of self-reported oral conditions, such as gum bleeding during brushing, tooth and/or gum hypersensitivity, or halitosis. The most frequently reported symptom was gum bleeding during brushing, which was present in almost half of the subjects (n = 50; 48.1%), while other symptoms, including tooth and/or gum hypersensitivity (n = 14; 13.5%) and halitosis (n = 2; 1.9%), were infrequent. None of the patients had a history of periodontitis or periodontal treatment. No tooth loss due to periodontitis was observed. The data regarding the self-reported oral conditions is shown in Table 2.
The pregnant women with GDM had significantly higher markers of gingivitis and periodontitis, as measured by the GI, BOP, PPD, and CAL scores (p < 0.0001, p = 0.0040, p = 0.0100, and p = 0.0030, respectively), but not oral hygiene, as measured by API (p = 0.0900), as compared to the control group participants. The T1D patients had significantly higher markers of gingivitis, periodontitis and oral hygiene, as measured by the GI, BOP, PPD, CAL, and API scores, as compared to the control group subjects (p < 0.0001, p < 0.0009, p < 0.0001, p < 0.0001, and p = 0.0010, respectively). In addition, the markers of periodontitis – PPD and CAL – were significantly higher in the T1D group as compared to the GDM group (p = 0.0060 and p = 0.0010, respectively).
Gingivitis was present in the majority of the participants (n = 75; 72.12%) and its prevalence did not differ among the study groups (27 (77.15%) in the GDM group, 19 (63.33%) in the T1D group and 29 (74.36%) in the control group; p = 0.4300). However, differences between the groups regarding the GI and BOP scores indicated that gingivitis was more severe in the pregnant women with GDM and T1D than in the controls.
The prevalence of periodontitis in the entire sample was 21.15% (n = 22); no difference was observed between the groups (p = 0.0600). However, an upward trend in periodontitis frequency in the control group, the GDM group and the T1D group is worth noting (10.26% vs. 22.86% vs. 33.33%, respectively). The minority of patients had an acceptable gum and periodontium condition (n = 7; 6.73%). However, it should be noted that an acceptable gum and periodontium condition was found most often in the control group (n = 6; 15.38%), while in the GDM (n = 0, 0%) and T1D (n = 1; 3.33%) groups, a satisfactory gum and periodontium condition was rare (p = 0.0200). Clinical periodontal markers, oral hygiene markers and the periodontal health diagnosis are outlined in Table 3.
Antioxidant activity and the level of MMP-9 in saliva
Salivary MMP-9 concentration was higher in the pregnant women with T1D than in the controls, but it did not differ between the patients with GDM and the controls. The patients with periodontitis had higher concentration of MMP-9 [µg/mL] in their saliva than the patients without periodontitis (2.29 (1.10–3.04) vs. 0.88 (0.50–1.84); p = 0.0001). Salivary antioxidant concentration/activity was comparable among the study groups. The levels of the examined salivary biomarkers are shown in Table 4.
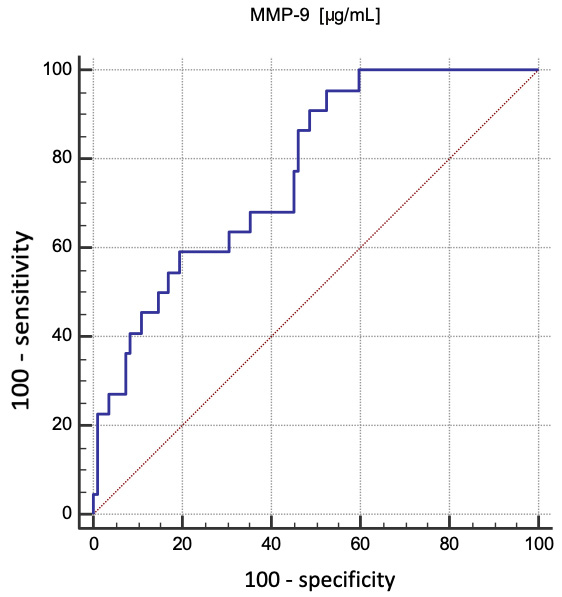
The independent determinants of periodontitis (p < 0.0001 for the logistic regression model; R2 = 0.46) were MMP-9 concentration (OR = 2.92; 95% CI: 1.56–5.46; p = 0.0008) and oral hygiene based on API (OR = 1.05; 95% CI: 1.03–1.08; p = 0.0001). In addition, MMP-9 concentration was also a useful determiner of the presence of periodontitis (ROC AUC = 0.77; 95% CI: 0.68–0.85; p < 0.0001). The optimal cut-off point was 0.84 µg/mL, with a sensitivity of 95.5% and a specificity of 47.6%. A graphical delineation of the ROC curve is presented in Figure 2.
Discussion
In this study, we demonstrated that the prevalence of gingivitis in pregnant women was high, affecting as much as 72.12% of the examined patients. A proper condition of the gingiva was observed most often in the controls. Additionally, we showed that the antioxidant levels in saliva were comparable in the study groups, but the concentration of MMP-9 in the T1D group was higher as compared to the controls. In all 3 study groups, the patients with periodontitis had higher concentration of MMP-9 in their saliva as compared to the patients without periodontitis. The independent determinants of periodontal disease in our study were oral hygiene and MMP-9 concentration.
Gingivitis
The prevalence of gingivitis in the study groups was 72.12%; gum bleeding during brushing, which is one of the symptoms of gingivitis, was the most frequently self-reported oral condition (48.1%).
Gingivitis during pregnancy is associated with some hormonal changes that occur in the woman’s body. Changes in the serum concentration of estrogen and progesterone can lead to gingival edema and gingivitis in 50% of pregnant women.28 The presence of female sex hormone receptors in the gingiva may explain an enhanced gingival response to plaque, and greater susceptibility to gingival and periodontal diseases during pregnancy.28 According to most studies, the severity of gingivitis increases with the duration of pregnancy, and then decreases during the postpartum period. This may explain a high prevalence of gingivitis in our study group, which is comparable to that reported by Hassan et al.29 and Weintraub et al.,30 i.e., 72% and 69%, respectively.
The groups did not differ in terms of gingivitis prevalence, but higher GI and BOP scores indicate that moderate to severe inflammation prevailed in the groups with diabetes, while mild gingivitis was observed in the control group, which is consistent with other studies; Ruiz et al. observed that the GI, BOP, PPD, and CAL scores were significantly higher in GDM and T1D groups as compared to controls,31 and Mittas et al. reported that GDM patients in the 3rd trimester had more severe gingivitis than pregnant women without diabetes.32
Periodontitis and diabetes
Despite differences in the values of indicators such as GI, BOP, PPD, and CAL, no differences were observed between the groups in the prevalence of periodontitis.
There is no definitive evidence that GDM causes periodontitis, as GDM is only the early stage of abnormal glucose tolerance. Gestational diabetes mellitus frequently occurs late in pregnancy, is transient, and then normalizes after childbirth. Therefore, the period of hyperglycemia is short, and often so mild that it may not have a significant effect on tissue loss in the periodontium.32 However, most reports from the literature indicate that there is a relationship between gingivitis and the exacerbation of periodontal disease that was present before pregnancy in patients who eventually develop GDM.31, 32 In our study, the presence of diabetes was not a predictor of periodontitis.
Despite a recent increase in the number of studies associating periodontitis with diabetes, there is a paucity of reports regarding the relationship between periodontal disease and T1D.33 However, most authors report that there is an association between these two states, and changes in the periodontium refer mainly to patients with poorly controlled glycemia. Thus, the degree of changes in the periodontium is related to the duration of diabetes. For this reason, the prevalence of periodontal disease increases in older adults with diabetes.17 All of the patients in our study were young and of a similar age (Me: 31 years). We did not find a clear association between diabetes and periodontitis. The logistic regression model omitted diabetes, possibly due to the proper control of diabetes in the study groups. In T1D, normoglycemia was monitored using the concentration of HbA1c, as recommended by standards,19 and most participants properly controlled their diabetes (5.75% (5.10–6.10%)). In GDM, there were no routine HbA1 measurements performed, as there are no standard recommendations for such monitoring.
Periodontitis and other factors
In our study, the patients’ concomitant diseases, such as hypothyroidism, Hashimoto disease, hypertension, intrahepatic cholestasis of pregnancy, and migraine, were not associated with the presence of periodontal disease. Moreover, the reported effect of these diseases on dental health is controversial in the available studies, and little is known about their possible cause-and-effect relationship with periodontitis.
In a systematic review by Aldulaijan et al., the authors hypothesized about an uncertain link between periodontitis and hypothyroidism, and they speculated that hypothyroidism might be more apparent in individuals with more severe periodontitis.34 However, this opinion is based only on several studies with multiple limitations.34
Recent studies revealed a relationship between periodontitis and migraine headaches. Inflammatory processes as well as vascular endothelial changes could be the potential mediators of this association. Leira et al. observed higher serum procalcitonin levels in patients with periodontitis and chronic migraines as compared to controls.35
The systemic inflammatory response in periodontitis may have adverse effects on blood pressure. Periodontal pathogens can cause transient bacteremia, which may lead to vascular inflammation, endothelial dysfunction, and ultimately hypertension.36
Currently, there is no data regarding a possible cause-and-effect relationship between intrahepatic cholestasis of pregnancy and periodontal disease.
Antioxidants in saliva
The antioxidant levels in saliva were comparable between the groups. An increase in oxidative stress is followed by a rise in the total level of salivary antioxidants to balance this stress. In diabetes, oxidative stress is observed mainly due to poor glycemic control, so it is likely that the patients in the GDM and T1D groups had their diabetes under proper control. However, in a study by Zamani-Ahari et al., the TAC level in the saliva of women with GDM was higher than in pregnant women without diabetes.37 Two possible explanations for this discrepancy are differences in the laboratory testing methods used and in pregnancy trimesters.
In a study by Zygula et al., patients with GDM who received only nutritional therapy had lower oxidative stress levels than patients with GDM who received insulin treatment.38 Patients with diabetes, especially those on nutritional therapy, often have a balanced, low-calorie diet, which may cause changes in the level of oxidative stress and antioxidant activity.
Metalloproteinases in saliva
The salivary concentration of MMP-9 in the T1D group was higher than in the controls (p = 0.0010), but its concentration did not differ between the patients with GDM and the controls. Similarly, Caseiro et al. found that the salivary MMP-9 levels were higher in patients who had T1D and periodontitis as compared to controls.39 Both studies suggest that high salivary MMP-9 concentration in T1D patients is related to deeper periodontal pockets and greater CAL. Considering that there is limited scientific data regarding the relationship between salivary MMP-9 concentration and pregnancy, GDM and T1D, our study provides some important insights into these populations. The only available data concerning MMP-9 concentration in pregnancy comes from a study by Öztürk et al., who observed that the MMP-9 level in saliva was higher in pregnant women than in non-pregnant women, and that it could be used to monitor the inflammatory state of gingival tissues during pregnancy.40 In Akcalı et al.’s study, elevated MMP-9 concentration was observed in the gingival pocket fluid of patients with GDM and gingivitis as compared to women with GDM who had healthy gums and periodontium.41
Antioxidants and periodontitis
Antioxidant activity was at a similar level in all study groups; we found no association between antioxidant activity and periodontitis. Although some literature reports indicate that oxidative stress contributes to periodontal disease,42 the vast majority of data on antioxidant activity in saliva is contradictory. However, it is possible that antioxidants might affect many processes that are not directly related to the action of free radicals. Throughout the course of periodontitis, both increases and decreases in the activity and concentration of several antioxidants can been observed, especially in gingival fluid and saliva.11 The evaluation of TAC seems particularly useful due to the interaction and synergistic effects between antioxidants. According to most studies on patients with periodontitis, their antioxidant status was lower as compared to controls without periodontitis; it is likely that the TAC of saliva was reduced because of chronic inflammation in periodontal tissues.12, 43 However, some studies reported that the SOD, GR and GPX activity was higher in the saliva of patients with periodontitis as compared to that of controls.44, 45 Differences in the results of the aforementioned studies could be related to differences in methodologies, including sampling, laboratory testing, and groups that were included. One possible explanation is that there are other currently unestablished factors that contribute to the development of periodontitis.
MMP-9 and periodontitis
In this study, the independent determinants of periodontal disease included oral hygiene and MMP-9 concentration. Each increase in MMP-9 concentration by 1 μg/mL increased the prevalence of periodontitis by 192%, regardless of the oral hygiene records (an increase in API by 1% increases this chance by 5% independently). This model explains almost half of the variability in the presence of periodontitis.
Many studies proved a direct correlation between the presence of periodontitis and the amount of dental plaque. The bacteria contained in dental plaque initiate and support periodontitis.2, 4 Further advancement of the inflammatory cascade is affected by the factors derived from the host; one such factor could be MMP-9.46 This enzyme is capable of extracellular matrix protein degradation and is a mediator of tissue breakdown in periodontitis. Elevated levels of MMP-1, MMP-2, MMP-3, MMP-8, and MMP-9 were detected in the gingival pocket fluid, gingival tissue and saliva of patients with periodontitis.47, 48 In a study by Wu et al., biomarkers such as IL-1β, MMP-8 and MMP-9 showed the potential to identify patients with periodontitis.8 The levels of IL-1β and MMP-9 were significantly higher in the periodontitis group. In a prediction model for diagnosing periodontitis, a combination of 3 biomarkers (IL-1β, IL-1ra and MMP-9) exhibited the highest AUC (0.853), with high sensitivity (73.3%) and specificity (88.9%).8
Some studies showed that combining bacterial and host-derived salivary biomarkers, such as MMP-8 and MMP-9, could be considered a potential diagnostic tool for predicting periodontal disease. According to Ramseier et al., the combination of MMP-8, MMP-9 and red-complex anaerobic periodontal pathogens was a good prediction model for diagnosing periodontitis.49 In Salminen et al.’s study, the levels of IL-1β, MMP-8 and Porphyromonas gingivalis in saliva were associated with periodontitis.4 Our study supports this assumption by providing evidence for the use of MMP-9 concentration as a marker of periodontitis.
Finally, we showed that the MMP-9 level is an independent and useful marker of gingivitis. We determined that gingivitis was more intense in the patients with GDM than in the control group, despite a similar level of hygiene, as represented by API. This may be due to the fact that other factors play major roles in the development of gingivitis. One possible underlying cause involves the host-related factors associated with inflammatory progression. Based on Kinney et al.’s study,50 we hypothesized that these factors include proteases, such as MMP-9.
Limitations
This study has limitations. The main limitation is the lack of the assessment of the presence and advancement of periodontal disease on dental X-rays. This is limited in pregnant women by 3 major factors. First, patients are unwilling to undergo X-ray examinations. Second, X-ray imaging is subjected to medical restrictions, except for the most urgent cases; otherwise, they are frequently delayed until after childbirth. Third, performing an X-ray examination only for the purpose of this study would be ethically questionable.29 Another limitation is that only a few salivary biomarkers were included in this study, so further research is warranted.
Conclusions
We observed worse gingival conditions, deeper periodontal pockets and greater attachment loss in the pregnant women with diabetes in comparison with the pregnant women without diabetes. However, we found no association between antioxidant activity and periodontitis in the gestational subgroups. We established that oral hygiene and MMP-9 concentration were the determinants of periodontal disease. Then, we established that MMP-9 concentration was a good predictor of periodontitis, as determined using the ROS analysis. Finally, we established a novel cut-off point for MMP-9 of 0.84 µg/mL to diagnose periodontitis.
Ethics approval and consent to participate
The study protocol was in accordance with the ethical guidelines of the 1975 Declaration of Helsinki and was approved by the institutional Ethics Committee at Jagiellonian University Collegium Medicum, Cracow, Poland (KBET/270/B/2013). Informed consent was obtained from each patient prior to participation in the study.
Data availability
The datasets generated and/or analyzed during the current study are available from the corresponding author on reasonable request.
Consent for publication
Not applicable.