Abstract
Background. Large airway dimensions are associated with a rapid decline in the lung function and a higher risk of hospitalization. Therefore, the airway dimensions of healthy subjects who tested positive for coronavirus disease 2019 (COVID-19) may be associated with the severity of COVID-19 symptoms.
Objectives. The objectives of this study were to measure the upper airway dimensions and the craniofacial skeletal parameters in patients who tested positive for COVID-19, to compare the upper airway dimensions and the craniofacial skeletal parameters between patients who developed no/mild symptoms and those with moderate–severe COVID-19 symptoms, and to assess any association of the skeletal relationships (anteroposterior (AP) and vertical) and the upper airway dimensions with the severity of COVID-19 symptoms in adult subjects.
Material and methods. A total of 204 orthodontic patients who tested positive for COVID-19 were evaluated. Of these, only 137 met the inclusion criteria. The sample was further subdivided into 2 groups based on the severity of symptoms: cases (moderate–severe symptoms; n = 56); and controls (asymptomatic/mild symptoms; n = 81). The upper airway dimensions and the skeletal parameters were measured on lateral cephalograms. The nonparametric Mann–Whitney U test was used to detect differences between the cases and the controls. Binary logistic regression analysis was used to evaluate the association between the studied variables and the severity of symptoms.
Results. The cases had a reduced lower face height (LFH) and a reduced perpendicular distance from the hyoid bone to the line connecting the anteroinferior limit of the 3rd cervical vertebra (C3) and the retrognathion point (RGN) (HH1) as compared to the controls. Regression analysis revealed a significant association of LFH (p = 0.013), the vertical airway length (VAL) (p = 0.002) and HH1 (p = 0.021) with the severity of COVID-19 symptoms.
Conclusions. The types of malocclusion were similar in the cases and the controls. Patients with reduced LFH and VAL, and a superiorly positioned hyoid bone in relation to the mandible developed more severe COVID-19 symptoms.
Keywords: symptoms, severity, skeletal, upper airway, COVID-19
Introduction
In late 2019, a new virus that caused respiratory infections emerged in Wuhan, China. Initially, the International Committee on Taxonomy of Viruses called it 2019 novel coronavirus (2019-nCoV), but later referred to it as severe acute respiratory syndrome coronavirus 2 (SARS-CoV-2).1 The disease caused by the virus was named coronavirus disease 2019 (COVID-19). The virus is characterized by a rapid rate of spread, causing infection in many populations. Accordingly, the World Health Organization (WHO) declared the outbreak of a pandemic of international concern.2 After 3 years of the pandemic, when it seemed that COVID-19 was moving toward the endemic status, global infections are rising again. Moreover, the reported number of cases is underestimated because of increasing unreported at-home testing.3 Therefore, it is clear that SARS-CoV-2 will not be totally eliminated, which means continuing to adapt to life with COVID-19.3
The majority of patients with COVID-19 are asymptomatic or present with mild–moderate symptoms, including fever, generalized fatigue, vomiting, coughing, sneezing, and pneumonia.4 However, a minority develop severe conditions and complications (acute respiratory distress syndrome, septic shock and multiple-organ failure in some patients). Unfortunately, in some cases, death is inevitable, with an estimated mortality rate between 1.4% and 4.3%.5
Worldwide, the gold standard test for the diagnosis of COVID-19 is real-time reverse transcription polymerase chain reaction (rRT-PCR).6 However, other tests have been used with varying degrees of accuracy, such as viral detection in sputum, tracheal aspirate, bronchoalveolar lavage, and serological assays for immunoglobulins.6 Saliva testing could serve as another tool for a quick and inexpensive diagnosis of COVID-19.7 Additionally, although less precise in comparison with other tests, imaging techniques have been adopted in certain clinical situations.
The transmission of COVID-19 occurs through air droplets and contaminated surfaces. Therefore, preventive measures, such as the use of masks, hand washing and social distancing, have been in place since the start of the outbreak. However, the gold standard for prevention is vaccination.8
It has been found that although COVID-19 vaccines have proven efficacy in preventing severe illness and death among those exposed to the virus, a small percentage of people will still contract SARS-CoV-2.9 In fact, the reported COVID-19 hospitalization rates were 4.1 times higher among 12–34-year-old individuals in the unvaccinated population than in those who had completed their primary series of the vaccine.10
Many risk factors have been linked to a greater risk of developing severe adverse outcomes. Patients at higher risk include older adults, those with respiratory and cardiovascular diseases, obese patients, and those with hypertension or diabetes mellitus.11 Sleep disorders, including obstructive sleep apnea, have also been linked to severe consequences of COVID-19.12 Furthermore, it has been reported that genetic factors might play a role in the expression of COVID-19 symptoms, although this issue is not fully understood. When compared to mild cases, patients with severe symptoms can exhibit significantly higher numbers of variants in coding and noncoding regions. Blood type has also been reported to influence the development of COVID-19 infection and its complications. The Rh(D)-positive blood type has been found more often in deaths due to COVID-19 infection. Also, different genomes have been linked to the severity of COVID-19.13
Oral manifestations of COVID-19 include dysgeusia (taste disorders), oral pain, blisters, desquamative gingivitis, and ulceration, especially of the tongue.14 Although oral manifestations have been reported in about 25% of COVID-19 cases with severe complications, these manifestations usually occur as a result of an impaired immune system and/or susceptible oral mucosa.15
Inflammation can cause airway narrowing. As a result, the flow rate in the narrowed segment is increased. This enhances the tendency of the airway to collapse inward.16
Several methods to evaluate the upper airway dimensions have been reported, such as nasal resistance and airflow tests, nasoendoscopy, polysomnography, cone-beam computed tomography (CBCT), and lateral cephalograms (LCs).17 The latter have been used extensively to investigate the airway dimensions.18 Previous studies indicate that LCs are reliable in the assessment of the airway dimensions,19 and that the commonly used landmarks to measure the airway dimensions can be reliably identified.20, 21, 22
Skeletal anteroposterior (AP) and vertical relationships may correlate with the upper airway dimensions or the total airway volume in healthy patients with no respiratory diseases or pathologies. It has been suggested that in some types of malocclusion, particularly Class I and Class II with increased vertical growth patterns, the upper airway tends to be narrower.20 As a result, in addition to treating occlusal problems, the aim of several orthodontic treatment modalities is to prevent the reduction of the nasopharyngeal dimensions, or even help increase them; these modalities include mandibular advancement appliances, mandibular or maxillary surgeries, and rapid maxillary expansion. Oelsner et al. reported that large airway dimensions were associated with a rapid decline in the lung function and a higher risk of hospitalization and death.21 Therefore, it would be worthwhile to investigate whether the airway dimensions of healthy subjects (with no comorbidities) who tested positive for COVID-19 are associated with the severity of COVID-19 symptoms. If such an association exists, this would highlight the importance of airway dimension assessment during orthodontic treatment planning.
The objectives of this study were to measure the upper airway dimensions and the craniofacial skeletal parameters in patients who tested positive for COVID-19, to compare the upper airway dimensions and the craniofacial skeletal parameters between patients who developed no/mild symptoms and those with moderate–severe COVID-19 symptoms, and to assess any association of the skeletal relationships (AP and vertical) and the upper airway dimensions with the severity of COVID-19 symptoms in adult subjects.
Material and methods
The study was conducted in accordance with the STrengthening the Reporting of OBservational studies in Epidemiology (STROBE) statement.
Ethical approval for the study was obtained from the Institutional Review Board at Hamad Medical Corporation, Doha, Qatar (No. MRC-01-21-238).
Study design
This case–control study was carried out at Hamad Dental Center/Hamad Medical Corporation in the State of Qatar.
Participants and setting
Cases were patients who experienced moderate–severe COVID-19 symptoms that necessitated hospitalization and special care due to shortness of breath or severe complications (the need for supportive care, assisted ventilation or intensive care unit admission). Controls were COVID-19 patients with no/mild symptoms, for whom special care or hospital admission were not required. This was based on the emergency department decision that was recorded in the national electronic health record system, which is the only electronic health record system in the country (Cerner®, Kansas City, USA); in the system, each patient has a unique hospital identification number for both their medical and dental records.
The records of all orthodontic patients who tested positive for COVID-19 at any time between March 2020 and March 2021 were retrieved from the medical health record system of Hamad Medical Corporation in the State of Qatar. None of the included subjects was vaccinated while the study was being conducted. Eligible patients who met the inclusion criteria were included. The inclusion criteria were as follows:
– patients who tested positive for COVID-19;
– adult patients aged ≥18 years (the airway dimensions remain almost stable after turning 13 years of age)17;
– no previous orthodontic treatment (some orthodontic procedures can affect the airway dimensions);
– no medical history of pharyngeal pathology and/or nasal obstruction, adenoidectomy, or tonsillectomy – it was determined based on the electronic health record system;
– non-pregnant, non-smokers, and no associated comorbidities, such as respiratory and cardiovascular diseases, hypertension, and diabetes mellitus;
– no missing posterior teeth, except for the third molars, which could affect the vertical dimension, since the posterior teeth act as a guide for the vertical jaw relationship (if there are no posterior teeth, this vertical guide is lost and, accordingly, the mandible overcloses, resulting in a reduction of the tongue space and more forward positioning of the mandible, which may affect the airway dimensions);
– LCs of sufficient quality available in the electronic medical records.
All LCs were taken in centric occlusion, using an OrthoSlice 1000C X-ray cephalogram machine (Trophy Radiologie, Marne-la-Vallée, France), with a cephalostat at 64 KVp, 16 mA and 0.64 s of exposure, according to the manufacturer’s instructions.
The LCs of the included patients were printed out using the Xelis Dental 1.0, Dental 3D INFINITT PACS® software (INFINITT, Phillipsburg, USA). The LCs were hand-traced using acetate tracing paper. The tracing and landmark identification on the LCs were performed by one operator (T.M.A.). The measurement and assessment methods have been used previously.17 The magnification of all radiographs was adjusted using a calibration marker.
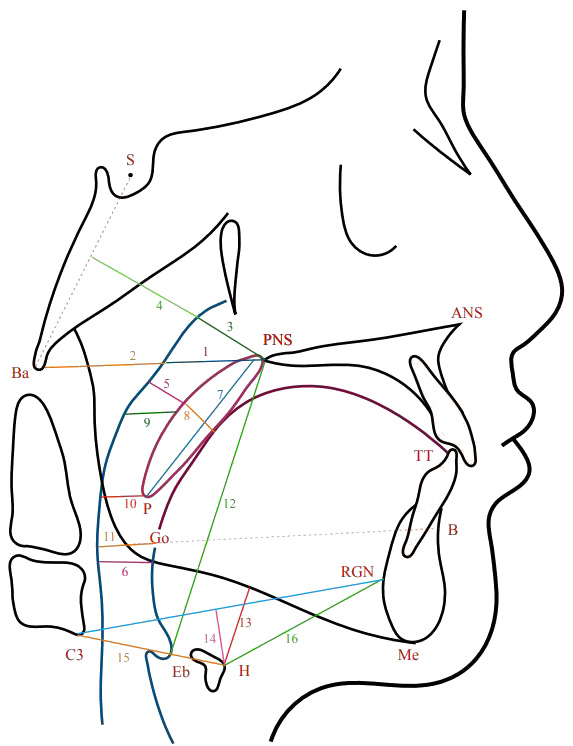
The measurement of the upper airway dimensions was based on the identification of specific landmarks on the LC (Figure 1). The definitions of the different points and measurements used are shown in Table 1.
For the AP skeletal relationship, the ANB angle was used to classify malocclusion into Class I, II or III. Vertically, the skeletal relationship was classified based on the maxillary/mandibular planes angle (Max/Mand) into reduced, average or increased (Table 1).
Outcomes
The primary outcome was the level of COVID-19 severity in relation to the upper airway dimensions and the skeletal relationships. The severity was assigned as either asymptomatic or moderate–severe.
The secondary outcome was the association between the body mass index (BMI) and COVID-19 severity.
Sample size
Convenient sampling was adopted. This was due to the lack of studies evaluating the effect of the upper airway dimensions on the severity of COVID-19 symptoms. Using the G*power program, v. 3.1.9 (https://www.psychologie.hhu.de/arbeitsgruppen/allgemeine-psychologie-und-arbeitspsychologie/gpower), and assuming a large effect size difference of 0.6 between the groups, the power analysis yielded a total sample size estimate of 54 subjects per group at a conventional alpha (α) level (0.05) and desired power (1-β) of 0.85.
Bias
To minimize bias, the investigator who carried out the tracing and made measurements was blinded to the patient’s identity and to whether the patient was a case or a control. Independent variables (covariates) were also extracted from the electronic medical records. These included age and gender (demographics), height, weight, and BMI, which is calculated as weight [kg] / height [m]2. The BMI was categorized as either underweight/normal if <25 kg/m2 or overweight/obese if ≥25 kg/m2.
Error of the method
A total of 10% of the included LCs were randomly selected and reanalyzed after a 2-week interval. Dahlberg’s formula was used to calculate the method error (Equation 1)23:
where:
ME – method error;
d – difference between the measurements; and
N – sample size.
The Dahlberg error ranged from 0.27 mm for AD1–Ba to 0.68 mm for AD2–H.
Statistical analysis
Statistical analysis was performed using IBM SPSS Statistics for Windows, v. 28.0 (IBM Corp., Armonk, USA). Descriptive statistics were calculated for all the measured variables for each group. The Shapiro–Wilk test was used to assess the normality of the distribution of the numeric data; it indicated that the data was not normally distributed. The nonparametric Mann–Whitney U test was used to detect differences between the cases and the controls. In addition, odds ratios (ORs) were presented using binary logistic regression analysis to evaluate the association between the skeletal parameters and the upper airway dimensions and the severity of COVID-19 symptoms (dichotomized to either asymptomatic/mild (coded 1) or moderate–severe (coded 2)). The level of statistical significance was set at p < 0.05.
Results
Sample characteristics
A total of 204 patients diagnosed with COVID-19 were identified from the electronic medical records in the orthodontic department. Of those, 67 were excluded due to poor-quality LCs or not meeting the inclusion criteria. Ultimately, a total of 137 patients were included in the study (51 males and 86 females). The sample was further subdivided into 2 groups (cases and controls) based on the severity of COVID-19 symptoms. There were 56 cases (moderate–severe symptoms) and 81 controls (asymptomatic/mild symptoms) (Table 2). The mean age of the cases was 21.66 ±4.32 years, and the mean age of the controls was 21.95 ±5.02 years.
There were no differences between the groups in terms of gender (p = 0.200). Females comprised 68% of the cases and 59% of the controls, while only 32% of the cases and 41% of the controls were males (Table 2).
The percentage of overweight/obese patients among the cases was 70%, while it was only 48% among the controls. Subjects with a lower BMI (<25 kg/m2) were less likely to develop severe COVID-19 symptoms (p = 0.010) (Table 2).
The types of malocclusion in the cases and the controls are presented in Table 2. No significant differences were detected between the 2 groups (p = 0.584). The Class II skeletal pattern was most represented in the cases, whereas in the controls, Class I and Class II were evenly distributed (37%).
Vertically, the majority of cases and controls had a normal vertical pattern (59% and 57%, respectively). There were more subjects with a reduced vertical pattern in the case group, whereas in the control group, there were more subjects with an increased vertical pattern. However, these differences were not statistically significant (p = 0.248) (Table 2).
The mean and standard deviation (M ±SD) values, the Mann–Whitney U test statistics, and p-values for the skeletal measurements in both the cases and the controls are shown in Table 3. The lower facial height (LFH) was the only cephalometric measurement that showed a significant association with severe COVID-19 symptoms (p < 0.05). Subjects who presented with severe COVID-19 symptoms had a reduced LFH as compared to the controls. There were no significant differences in ANB, Max/Mand, the palatal length (ANS–PNS), or the mandibular length (Go–Pog) between the cases and the controls (p > 0.05).
The M ±SD values, the Mann–Whitney U test statistics, and p-values for the airway dimensions in both the cases and the controls are shown in Table 4. In subjects with severe COVID-19 symptoms, the perpendicular distance from the hyoid bone to the line connecting C3 and RGN (HH1) was lower than in the controls (p < 0.05).
The results of binary regression analysis conducted to investigate the association between the skeletal parameters and the upper airway dimensions and the severity of COVID-19 symptoms are shown in Table 5. The following variables revealed significant associations: LFH (p = 0.013); vertical airway length (VAL) (p = 0.002); and HH1 (p = 0.021). The odds of developing moderate–severe COVID-19 symptoms increased by 1.2 times if LFH and HH1 were reduced by 1 unit. Also, as VAL was reduced by 1 unit, the odds of developing moderate–severe COVID-19 symptoms increased by 23%.
Discussion
Since the outbreak, COVID-19 has contributed to a large number of deaths and economic losses in a relatively short time. To date, in the State of Qatar, more than 247,000 cases have been diagnosed as COVID-19-positive out of a population of less than 3 million; 685 deaths were recorded until November 2022.24 It was found that although the majority of infected patients had no or mild symptoms, approx. 15–25% developed severe symptoms with a relevant impairment of the respiratory function, leading to hospitalization and assisted ventilation.4
The upper airway has a complex geometry, and is surrounded by muscles and mobile soft tissue structures that can alter the airway configuration. The main function of the upper airway is to regulate the inspired and expired airflow, along with heating and humidifying the inspired air.25 The relative growth and size of these surrounding tissues determine the size of the pharyngeal space, which plays an important role in the respiratory function and resistance to airflow.26
This study investigated whether the upper airway dimensions and the skeletal relationships in healthy young adults (with no comorbidities) were associated with the severity of COVID-19 symptoms. If such an association exists, it would substantiate the importance of treating orthodontic problems that are associated with narrow airway dimensions as soon as they are identified. This study is considered the first to examine this association.
All age groups can be infected with COVID-19; however, the disease most commonly affects middle-aged and older adults. It was found that 80% of hospitalizations were in adults over 65 years of age, and that these patients were at a 23-fold greater risk of death than those aged less than 65 years.27 In the present study, age ranged from 15.00 to 22.58 years, as all the included subjects in both groups were orthodontic patients from a young-age group with LCs in their medical records; this may be considered a limitation of this study.
All the included subjects were healthy and had no complaints of any systemic diseases, as comorbidities, such as hypertension, diabetes, obesity, and cardiovascular and respiratory diseases, are strongly associated with severe outcomes in COVID-19.11
In this study, gender was not associated with the severity of COVID-19 symptoms. This is in contrast to a report by Jin et al., who found that although the prevalence of COVID-19 was the same in males and females, males were at higher risk of developing severe outcomes and death, regardless of age.28 It was also found in a meta-analysis conducted by Peckham et al. that male patients tended to develop more severe outcomes than females, with a significantly higher number of intensive care unit admissions and deaths.29 The number of females in our study was almost ⅔ of the sample as compared to ⅓ being male patients. This difference may have affected our results.
In this study, BMI was significantly associated with the severity of COVID-19 complications. The overweight/obese patients were 2.7 times more likely to develop severe complications than the underweight/normal subjects. This finding agrees with that reported in previous studies, indicating an increased risk of severe COVID-19 complications among patients of higher weight. In their study, Gao et al. reported that a BMI of more than 23 kg/m2 was associated with a linear increase in the risk of severe COVID-19, leading to hospital admission and death.30 Another study from Korea by Kang and Kong found a relationship between BMI and fatal illness. They reported that a BMI of <18.5 kg/m2 and a BMI of ≥25 kg/m2 were associated with a higher risk of fatal illness.31
In the present study, the majority of subjects with moderate–severe COVID-19 symptoms presented with Class II malocclusion and a normal vertical pattern, whereas the majority of subjects who developed no or mild symptoms had Class I and Class II malocclusion and a normal vertical pattern. This is compatible with a study by Silva et al., who stated that Class II patients with smaller mandibles tended to have reduced sagittal airway dimensions.32 Moreover, Kirjavainen and Kirjavainen found that Class II malocclusion in a group of healthy patients with no respiratory disorders was related to narrower oro- and hypopharyngeal spaces as compared to controls with a Class I molar relationship.33 Kim et al. reported that a constricted nasopharyngeal airway was associated with retruded mandible and maxilla.34 On the other hand, Chokotiya et al. found that the airway dimensions were not significantly different between Class I, II and III skeletal relationships.35 However, in the present study, regression analysis revealed no association between the skeletal relationships (AP and vertical) and the severity of COVID-19 symptoms. The only cephalometric variable that showed an association with the severity of COVID-19 symptoms was LFH. A reduced LFH in the case subjects cannot be taken as an indicator of a vertical growth pattern, as other vertical variables (Max/Mand and facial proportions (FP)) were within the normal range.
A reduced LFH indicates a reduced distance between the palatal and mandibular planes, which in turn points to reduced room to accommodate the tongue. In such cases, the tongue and its associated soft tissues would be forced posteriorly, resulting in the narrowing of the sagittal airway dimensions. When the sagittal airway dimensions decrease, the vertical airway dimensions tend to increase as a response, which has been found to be associated with an accelerated decline in the lung function and an increased risk of hospitalization and death.21 Of note, it is relevant to mention that several studies have investigated the effect of orthodontic treatment on the upper airway dimensions. While the majority of studies found no significant clinical effect after treatment,17 some studies found a significant increase in the upper airway dimensions, in particular with rapid maxillary expansion appliances.36
In this study, subjects who developed moderate–severe symptoms had a reduced VAL and a superiorly positioned hyoid bone. It has been shown that the hyoid bone position differs in each type of malocclusion. It is positioned inferiorly in Class I and Class II malocclusion,37, 38 and superiorly in Class III malocclusion.39
In the present study, the hyoid bone was found to be more superior to the mandible in the cases as compared to the controls. It is due to the fact that the majority of controls had Class I and II malocclusion, which is consistent with what has been previously reported.37, 38 The majority of cases, however, had Class II malocclusion, but the hyoid bone was still located superior to the mandible; this can be explained by the fact that although the dominant malocclusion type was Class II, the associated LFH and VAL were reduced, which means that there was less space for the tongue, resulting in the stretching of the associated soft tissues which are connected to the epiglottis, thereby elevating the hyoid bone more superiorly.
Limitations
One limitation of this study is its high female/male ratio. Another one is a convenient sample, in which only orthodontic patients diagnosed with COVID-19 who had good-quality pretreatment LCs were included. Moreover, the study is a retrospective case–control study, in which the classification of cases vs. controls was based on symptoms and the treatment already provided to the patient. Finally, it is a single-center study, so the generalization of the results may not be possible.
Conclusions
The types of malocclusion were similar in the case and control subjects. COVID-19 patients with moderate–severe airway complications tended to have reduced LFH and VAL, and a superiorly positioned hyoid bone in relation to the mandible. COVID-19 patients with BMI ≥ 25 kg/m2 were more likely to develop moderate–severe airway complications.
Ethics approval and consent to participate
Ethical approval for the study was obtained from the Institutional Review Board at Hamad Medical Corporation, Doha, Qatar (No. MRC-01-21-238).
Data availability
All data generated and/or analyzed during this study is included in this published article.
Consent for publication
Not applicable.