Abstract
Background. Cone-beam computed tomography (CBCT) is used to provide multiplanar views of the temporomandibular joint (TMJ) bone components as well as TMJ pathologies without superposition, magnification or distortion.
Objectives. The study aimed to analyze degenerative changes in the condylar surface, and their relationship with patient age and gender, and the TMJ space measurements by using CBCT images.
Material and methods. A total of 258 individuals were retrospectively analyzed. The degenerative bone changes of the condylar head were evaluated and classified on the right and left sides. The shortest distances from the anterior, superior and posterior parts of the condylar head to the glenoid fossa were measured to represent the TMJ space. Univariate and multivariate logistic regression analyses then evaluated the effect of age and gender on the presence of degenerative changes.
Results. Condylar flattening was most frequently observed (413 TMJs, 53.5%). However, the presence or absence of the change types did not differ according to the sides. The mean values of the TMJ space measurements on the right and left sides were narrower in the group with changes than in the group without changes. Nonetheless, no statistically significant difference in the TMJ space was found between the groups (p > 0.05).
Conclusions. An increased risk of radiographically detectable degenerative alterations in left TMJs was detected for males and for increasing age. Degenerative changes in the condylar surface may affect the dimensions of the TMJ space.
Keywords: temporomandibular joint, cone-beam computed tomography, mandibular condyle, degeneration, age
Introduction
The temporomandibular joint (TMJ) is located between the mandibular condyle (the inferior part of the TMJ) and the glenoid fossa of the temporal bone (the superior part of the TMJ) and is considered to be the most complex articular system in the human body. The TMJ can move on different orthogonal planes with a balanced, dynamic, and complex mechanism.1, 2
The optimal condylar head position in the glenoid fossa is one of the most discussed subjects in dentistry. Despite the occlusion being detected directly intraorally, the condylar position in the fossa cannot be interpreted with the naked eye. However, the joint space dimensions could determine the ideal position of the condyle in the glenoid fossa. Indeed, the joint space is a commonly used radiological term to describe the radiolucent region between the condylar head and the temporal bone.3
Temporomandibular disorder (TMD) is a general term to describe conditions affecting the masticatory muscles, the TMJ, and related structures, either individually or all at once.4 Furthermore, TMD is often associated with disc displacement and degenerative changes that affect soft and/or hard tissues of the TMJ.5 Degenerative bone changes in the TMJ are more common in the mandibular condyle than in the glenoid fossa or the articular eminence, which includes various degrees of flattening, erosion, osteophyte formation, sclerosis, and pseudocysts.6, 7, 8, 9 It is essential to identify these pathologies, as in-depth knowledge of bone changes is necessary for the accurate diagnosis of disease-related dysfunctions and appropriate treatment planning.10
Radiographic examination is necessary for the proper diagnosis of TMD,11 with many imaging techniques and diagnostic modalities used to examine the joint. TMJ radiography assesses the degree of disease, progress, and treatment response.12 Meanwhile, panoramic radiography, conventional tomography, helical or multi-slice computed tomography (MSCT), and cone-beam computed tomography (CBCT) are used to evaluate the bony components, while magnetic resonance imaging (MRI) can examine the soft tissues, such as the disc or capsule of the TMJ.13
CBCT is reported to be more useful for detecting condylar surface pathologies than conventional imaging modalities. Indeed, the superimposing of structures in conventional radiography could result in misdiagnosis due to poor radiographic evaluation.6, 7 The Diagnostic Criteria for TMD (DC/TMD) indicate that CT imaging is required for determining degenerative joint disease.14 However, the relatively high radiation dose and cost limit CT use for TMJ examination.15 Recently, CBCT imaging has been used as an alternative method for evaluating the TMJ bone components in all three dimensions without superimposition and structural distortion.16
This study aimed to analyze degenerative condylar changes and to determine the possible relationship between degenerative condylar changes and age, sex, side (right/left), and joint space distances.
Material and methods
Study design
The local Research Ethics Committee approved the protocol of this multicenter study (No.: 14/3 and Ref.: 36290600/124), and the study complied with the 1964 Declaration of Helsinki ethical guidelines.
The digital images of patients who underwent CBCT examination at the Dentomaxillofacial Radiology Departments of Ankara University, Zonguldak Bülent Ecevit University, and the Near East University for various reasons from 2013 to 2019 were retrospectively analyzed. The CBCT records of the bilateral TMJs of 258 individuals (148 females and 110 males) aged 8–82 years (mean age: 39.81 ±15.6 years) were evaluated.
The study included CBCT images with completely visible bilaterally TMJs, all posterior teeth present, degenerative condylar changes in at least one TMJ, and cases without a history of systemic diseases. Exclusion criteria for the study included low-quality images, images with radiologic signs of metabolic bone disease, noticeable periodontal diseases, prosthetic restorations, a history of orthodontic treatment, disorders that may affect joint morphology such as rheumatoid arthritis, a history of surgery, trauma, cyst, or tumor in the maxillofacial region, and congenital or developmental disorders.
Imaging procedures
All CBCT scans were performed based on local imaging protocols. The technical parameters and dedicated software of the CBCT units used are presented in Table 1.
CBCT evaluation
A single informed and calibrated specialist in dental radiology (CG with 6 years of experience, Mİ and SA with more than 10 years of experience) analyzed images at each center. A standard positioning was defined before the evaluation, and the examiners placed each image in that position.
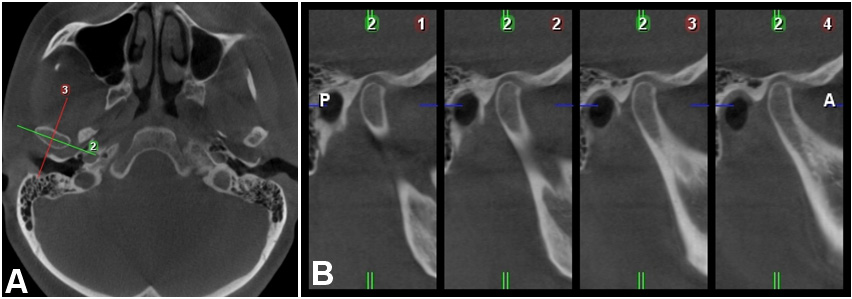
Adjustments to the CBCT images ensured that the vertical reference line ran through the patient’s midsagittal plane in the axial and coronal views. The hard palate was oriented in the sagittal view so that the horizontal reference line was positioned through the anterior and posterior nasal spine. The tool “TMJ module” was activated. When the largest mediolateral width of the condylar process was visible in the axial plane, paracoronal and parasagittal cross-sectional slices were obtained for qualitative and quantitative analysis (Figure 1).
Records for each patient included age, sex, degenerative alteration types, and TMJ space measurements. Bone changes were detected in at least two consecutive sections to avoid misinterpretations, and images were excluded when all examiners doubted the classification.
Diagnostic classification of degenerative changes in the condylar surface
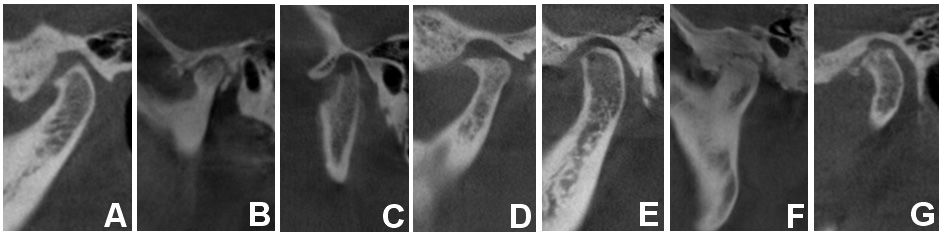
Previously reported definitions of flattening (Figure 2A), sclerosis (Figure 2B), erosion (Figure 2C), osteophytes (Figure 2D), subchondral cyst (Ely’s cyst) (Figure 2E), ankylosis (Figure 2F), and loose joint bodies (Figure 2G), evaluated degenerative changes of the condylar head.17, 18
The TMJs were classified into 2 groups: (1) without-change (when the condyles had a smooth, clear cortical bone surface); and (2) with-change (flattening, erosion, osteophytes, sclerosis, subchondral cyst, ankylosis, and/or loose joint bodies).
TMJ space measurements
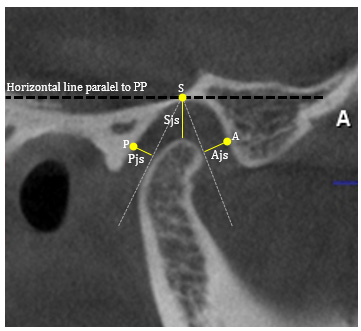
The TMJ space calculations used dedicated software programs on the central parasagittal view, with a horizontal line parallel to the palatine plane used as the reference line. Linear measurements were made at selected points of the glenoid fossa and the condylar head at the shortest distances. All landmarks used for measurements are presented in Figure 3.
Statistical analysis
All statistical analyses employed SPSS Statistics for Windows, v. 11.5 (IBM Corp., Armonk, USA). Student’s t test compared normally distributed variables between the TMJ groups, with the Mann–Whitney U test applied to non-normally distributed data. Meanwhile, McNemar’s test assessed differences in the right and left sides between the 2 groups. Logistic regression analyses determined the relationship between the risk factors and the occurrence of degenerative bone changes. A p-value <0.05 was considered statistically significant.
Results
Table 2 shows the frequency distribution of degenerative alterations in condyle based on gender and side. Degenerative bone changes were detected in the 467 TMJs (232 TMJs-right and 235 TMJs-left, respectively). A total of 209 of the 258 cases had bilateral condylar bone changes, with the remaining 49 individuals showing unilateral bone changes (26 on the right side and 23 on the left side). According to McNemar’s test, there was no significant difference in the degenerative change types between the right and left sides of the TMJ (p = 0.668).
Table 3 outlines the absence or presence of condylar bone alterations according to joint space measurements. The mean values of anterior joint spaces (Ajs ) and superior joint spaces (Sjs) of the right TMJs, as well as Ajs, Sjs, and posterior joint spaces (Pjs) of the left TMJs were smaller in the with-change group than in the without-change group. However, there was no statistically significant association between the presence of degenerative changes and joint space measurements.
Table 4 presents the prevalence of the degenerative change types on the right and left sides. The most common degenerative bone changes were flattening, erosion, and sclerosis, for the right and left sides. Meanwhile, ankylosis and loose joint bodies were the least common degenerative changes. The presence or absence of the change types did not differ between the left and right sides.
The univariate associations of degenerative bone changes with age and gender were analyzed. Increasing age and being male had a significant association, but only on the left side (p = 0.004 and p = 0.022, respectively) (Table 5). In the multivariate analysis, male gender and increasing age (odds ratio (OR): 4.37; 95% confidence interval (CI): 1.40–13.63; p = 0.011) had a significant association with left-sided degenerative changes (Table 6).
Discussion
Osteoarthritis has been described as a low-inflammatory degenerative disorder that initially affects the articular cartilage and subcondylar bone, then causes destructive changes in the cortical and subcortical bone areas. Furthermore, osteoarthritis appears to be a common degenerative and destructive joint change due to primary and secondary trauma or other acute or chronic extreme conditions.19
Larheim and Westesson described osteoarthritis as prominent inflammatory findings on MRI, whereas osteoarthrosis refers to joints without such symptoms.20 Osteoarthritis leads to bone deformation, including subcortical cysts, surface erosion, osteophytes, and sclerosis. However, osteoarthritis requires more specific and detailed diagnostic guidelines with the increasing use of CBCT.18
Several studies have reported the variable prevalence rates of structural TMJ alterations.8, 9, 17, 21, 22, 23 Koyama et al. examined condylar bone changes in 516 patients with TMD using helical CT and detected changes in 617 (63.7%) of 1032 joints.9 Also, Koç found that 67.3% of the retrospectively evaluated patients presented one or more osseous TMJ changes on CBCT images.21 Meanwhile, Pontual et al. examined the CBCT scans of patients with clinical symptoms or signs of TMJs and found TMJ bone alterations in 227 (71%).22 Cho and Jung examined CBCT images for osteoarthritic changes of the TMJ in Korean children and adolescents and found that TMJ osteoarthritis was much higher in symptomatic cases (26.8%) than in asymptomatic cases (9.9%).8 Moreover, Borahan et al. revealed osteoarthritic changes (17.9%) and developmental changes (2.6%) in the CBCT images of 795 patients.17 Walewski et al. reported a higher prevalence (52.3%) of degenerative TMJ changes in asymptomatic groups,23 with similar results presented by Krisjane et al. (42.7%).24 These reported differences may be due to variations in patient selection, imaging techniques, or evaluation criteria. The current study detected osteoarthritic alterations in 91.1% (n = 235) and 89.9% (n = 232) of the left and right joints, respectively. Such high rates were achieved as all images had an osseous alteration on at least one side.
There are disagreements about whether clinical symptoms affect the radiographic evidence of TMJ osteoarthritis. Indeed, some studies have reported a poor correlation between TMJ osteoarthritis and signs and symptoms of TMD.25, 26 Wiese et al. did not find any relationship between radiographic findings and pain-related variables.27 In contrast, Kurita et al. mentioned that TMJ pain was associated with mandibular function and osteoarthritic alterations in the articular surface.28 Radiographic examinations have an essential role in evaluating bone changes in the TMJ. Some of these changes can be due to age-related remodeling mechanisms or physiological responses without clinical signs, as radiographs indicate the effect of a previous process and not ongoing processes.29 Therefore, radiographic findings may not always correlate with the clinical situation. In this regard, the current study did not assess the clinical findings of the patients as it was designed to assess the types of degenerative changes of the condyle and to investigate the association between joint space and condylar alterations.
Some authors have reported a correlation between degenerative changes and increased age. Koç reported a significantly higher mean patient age with findings of osseous changes in the TMJ compared to those without any changes.21 According to Pontual et al., advanced age is related to having more frequent degenerative bone changes, and bone alterations occur more commonly in females.22 Alexiou et al. showed that older patients had more frequent bone changes than younger individuals.30 Similarly, Borahan et al. reported increased TMJ degenerative changes in individuals over 60 years, which were more common in females than in males.17 However, several studies found no association between age and osseous alterations.22, 23, 30, 31, 32 Cho and Jung evaluated symptomatic and asymptomatic children and adolescents and found no significant difference between the children and adolescents.8 Nonetheless, the older age group had a higher prevalence of degenerative changes. In addition, Crusoe-Rebello et al.31 and Isberg et al.32 concluded that there was no relationship between older age and the incidence of bone alterations. The present study found no correlation between age and degenerative changes in the right TMJ, whereas aging was a risk factor for condylar alterations on the left side. The difference may be related to an unbalanced distribution of biomechanical stress on TMJs caused by chewing side preferences. During mastication, bilateral usage is necessary, but unilateral predominance is a well-known and relatively consistent phenomenon.33 However, due to its retrospective design, this study did not include information related to parafunctional activity and chewing side preferences.
It is widely accepted that females are more likely to develop TMDs, with several studies revealing more frequent osteoarthritic changes in female patients, which is mainly due to hormonal differences between genders.21, 22, 28, 29 In contrast, some authors found no gender-based differences.23, 24 In research by Cho and Jung, the prevalence of osteoarthritic changes was higher for males in the symptomatic group, while no significant gender differences were observed in the asymptomatic group.8 The current study detected an increased risk of condylar degenerative changes in males with increasing age. However, the results may be associated with gender differences in willingness to seek help and may reflect the true predilection. Indeed, treatment-seeking rates may be lower in males than females, with the former only visiting the clinic at an advanced stage of the disease.
Borahan et al. reported a more common distribution of osteoarthritic changes on the right side, which could reflect individuals’ chewing side preference.17 However, Koç21 and Pontual et al.22 observed a higher prevalence of bone changes on left TMJs, but this difference was not significant. Similarly, this study showed no significant difference in degenerative changes between the sides.
In the current study, flattening, erosion, sclerosis, and osteophyte lesions predominated on both sides. These findings are in line with Güler et al., who scanned patients with bruxism using MRI.34 A similar result was also outlined in a CBCT study by Alexious et al., who found that erosion, flattening, and osteophytes were predominant, but sclerosis was the least common lesion.30 Meanwhile, Koç evaluated bone changes in the condylar head, articular fossa, and articular eminence and revealed more frequent osseous changes in the condyle than in temporal bone components.21 In that CBCT study, flattening was the most common finding for condylar head and articular eminence, but erosion in the articular fossa was more frequent.21 Indeed, flattening is the most frequently detected degenerative feature reported in the literature.7, 21, 22, 29, 30, 35 These results can be explained by the probability that flattening indicates an adaptive change, with the early finding of progressive disease or alteration secondary to internal derangement. Also, it can be related to the mechanical (masseter and temporal muscles) overloading of the TMJ.22 However, the imaging findings reported from other studies disagree with this result. Cho and Jung concluded that the most frequent radiographic findings were erosion (15.6%) and sclerosis (5.4%) for the symptomatic and asymptomatic groups, respectively.8 These authors also found that erosion was found more frequently in patients with pain and limited mouth opening. Nah et al. evaluated 220 TMJ patients using CBCT, and the most common finding was sclerosis (30.2%), followed by erosion (29.3%), flattening (25.5%), and osteophytes (8.0%).18 Meanwhile, Mani and Sivasubramanian detected erosion as the most predominant change.35 The discrepancy between findings may result from imaging technique differences, racial/ethnic diversity, age groups, and/or diagnostic criteria.
Structural changes may indicate different stages of degenerative joint disease. Erosion findings can correspond to acute changes and is a sign of the TMJ being in an unstable state and changes occurring on the bone surface. Flattening and osteophyte formation are detected in the advanced stage of the disease. Indeed, osteophytes, flattening, and sclerosis formations indicate the adaptation of the body to repair the joint.36
Panchbhai reported different TMJ space analysis methods and their comparisons and associations with other parameters in a review article.37 Meanwhile, Koç classified measurements of less than 1.5 mm in all directions (anterior, superior, and posterior) of the TMJ as reduced joint space.21 Furthermore, the research found a statistically significant difference between the mean age and joint space narrowing. It was concluded that joint narrowing accompanied osseous changes in the TMJ.21 The current study found narrower joint space values in the with-change group than in the without-change group, though the difference was not statistically significant. Similarly, Tsuruta et al. found no significant difference in Ajs or Pjs measurements, neither between the presence and absence of bone change nor between the bone-change subgroups.38 In addition, the joint space measurements were not categorized as continuous variables since there was no clinical or prognostic reason for this.
It has been reported that the TMJ space could be regarded as a diagnostic metric for TMD.39 However, the bone changes that might occur are not very predictable in an altered joint space or vice versa. To better understand this relationship, the disc position must be one of the parameters evaluated in future studies.
A potential limitation of the study is that the findings do not explain the longitudinal alterations in the condyle due to the study’s observational design. In addition, the observational design limits the degree of the cause-and-effect relationships. Furthermore, degenerative lesion-type frequency without clinical symptoms was described due to the study’s retrospective design. Moreover, changes in the other osseous structures of the TMJ were out of the scope of the present study. Even though degenerative changes in the condyle are more common than articular eminence,21 their relationship to alterations is still unclear.
Conclusions
Flattening, erosion, and sclerosis were the most common degenerative changes in the articular surface of the condyle. Degenerative condylar changes may affect the dimensions of the TMJ spaces. Increasing age and being male was associated with radiographically detectable degenerative findings in the mandibular condyle. Further longitudinal studies are needed to investigate these findings.
Ethics approval and consent to participate
The local Research Ethics Committee approved the protocol of this multicenter study (No.: 14/3 and Ref.: 36290600/124), and the study complied with the 1964 Declaration of Helsinki ethical guidelines.
Data availability
The datasets generated and/or analyzed during the current study are not publicly available, because they contain information that could compromise the privacy of research participants.
Consent for publication
Not applicable.