Abstract
Background. Normal airways are a key factor during the craniofacial growth of the young. Therefore, sleep-disordered breathing (SDB) without treatment can have harmful consequences for development and health.
Objectives. This study aimed to evaluate the cephalometric characteristics in non-snoring individuals and snoring subjects, and investigate differences in the pharyngeal airway space between the 2 groups.
Material and methods. This case–control study included 70 patients aged over 18 years, selected from a radiology center. The patients were divided into 2 groups: case (35 patients with a history of habitual snoring); and control (35 healthy patients). The Berlin sleep questionnaire was administered to the parents of the patients. The nasopharyngeal airway was measured according to the analysis of Linder-Aronson (1970), and 4 indices were measured and analyzed in each of the lateral cephalometric radiographs.
Results. No statistically significant differences were observed in the pharyngeal measurements between the 2 groups, although all means in the control group were higher than in the experimental group. However, there was a significant relationship between gender and the Ba-S-PNS and PNS-AD2 indices.
Conclusions. Although the patients with nocturnal snoring had smaller airway dimensions, their pharyngeal measurements were not significantly different from the control group.
Keywords: snoring, obstructive, cephalometry, sleep apnea, pharynx
Introduction
The normal development and extension of the pharyngeal airway are key factors in craniofacial growth.1 As a result, sleep-disordered breathing (SDB) in the absence of treatment may have harmful consequences for health.2 However, the epidemiological studies on apnea prevalence in the general population are inconsistent (3–7% in males and 2–5% in females).3
The primary causes of snoring include narrowing of the upper respiratory tract due to nasal septum deviation, adenoid hypertrophy, tonsillitis, obesity (body mass index (BMI) >27 kg/m2), edema secondary to inflammation of the oral cavity, sex (more common in males), and possibly genetics.4
A linear correlation exists between obesity and obstructive sleep apnea (OSA), with the precipitation of fat in the upper respiratory tract narrowing the airways and decreasing muscular activity, which leads to cyclic hypoxia and apnea.5
Snoring can lead to daytime sleepiness, increased risk of cardiovascular diseases,6 and pregnancy-induced hypertension,7 and continuous snoring may progress to OSA. This potential progression in complications requires specialist attention for diagnosis and treatment.4 In preschool children, snoring has been reported in approximately 10% of the population, with OSA occurring in around 0.7‒2.9%.2 According to a review by Benjafield et al., 936 million (95% confidence interval (CI): 903–970) adults aged 30–69 years reported mild to severe OSA, and 425 million (95% CI: 399–450) adults aged 30–69 years reported moderate to severe OSA.8
OSA is a common disorder characterized by a relative or complete collapse of airways during sleep,9 which can increase airflow resistance and stop breathing for 10 seconds or more and has significant medical and psychosocial effects on children and adults.10 Apnea refers to the complete discontinuity of air for at least 10 seconds, while hypopnea suggests a partial reduction in the oronasal airflow and decreased oxygen saturation of oxyhemoglobin. OSA can result from various combinations of anatomical and pathophysiological features, some of which may be influenced by genetic factors.11 Various characteristics reported for patients with OSA include a longer and thicker soft palate, decreased width of the oral or nasal airway,12 increased thickness of the soft palate, a retruded chin, maxillary retrusion,13 an increased craniofacial angle,8 micrognathia,14 and differences in the position of the hyoid bone.15
The prevalence of OSA among African Americans appears to be higher than in Caucasians.16 Meanwhile, the prevalence of OSA in Asian populations is similar to that of Caucasians, though the OSA severity is higher.17
According to Morsy et al., 82% of men and 93% of women with moderate to severe OSA are never diagnosed.18 Some studies have also shown a correlation between bruxism and OSA.19, 20
Lateral cephalometric radiography is a static imaging technique that provides data that can be reproduced in detail and focuses on the anatomical characteristics of upper airways.4 Generally, a lateral cephalogram is used in individuals with obstructive symptoms as a screening tool for assessing the upper airway morphology and craniofacial pattern, identifying individuals at risk of SDB, and studying the therapeutic effects of treatments.2
Definitive diagnosis of OSA requires polysomnography, though it is time-consuming and expensive. Cephalometric analysis is widely used as a diagnostic procedure in patients with OSA and for evaluating the effects of therapeutic interventions such as oral applicators.15 Evidence-based medical assessment suggests that locating the obstruction should be the primary goal when researching sleep disorders.21 However, no single assessment method is ideal, although lateral cephalometry may provide valuable information for the diagnosis, treatment, and screening of patients. Since individuals with narrow airways and craniofacial anomalies may be at increased risk of OSA and hypopnea syndrome, the use of a lateral cephalogram can play an important role in the early diagnosis and treatment of these patients.12
The present study aimed to compare pharyngeal airways in patients with and without snoring and to assess craniofacial features in individuals with SDB and snoring. The hypothesis was that patients with SDB would have large deviations from normal.
Material and methods
This case–control study selected participants from patients referred by their dentist for lateral cephalometric radiography for orthodontic treatment at a private radiology center in Qazvin, Iran. Initially, the parents of patients responded to the Berlin questionnaire.22, 23, 24
The Research Ethics Board at the Qazvin University of Medical Sciences, Iran, approved the study (IR.QUMS.REC.1396.145), which followed the guidelines of the Declaration of Helsinki. The questionnaire, developed at the Conference on Sleep in Primary Care in Berlin, Germany, in 1996, is a validated tool used to identify individuals at risk of OSA in primary and some non-primary care settings.18 The Berlin questionnaire contains 11 questions in three categories. The 1st category comprises 5 questions regarding snoring, witnessed apnea, and the frequency of such events. The 2nd category includes 4 questions addressing daytime sleepiness, with a sub-question on drowsy driving. The 3rd category comprises 2 questions on a history of high blood pressure (>140/90 mmHg) and BMI > 30 kg/m2. Categories 1 and 2 are considered positive if there are 2 positive responses to each category, while category 3 is regarded positive with a self-report of high blood pressure and/or BMI > 30 kg/m2. The patients were scored as being at high risk of having OSA if scores were positive for 2 or more of the 3 categories. Those patients who scored positively for 1 category were identified as being at low risk of having OSA.25
Exclusion criteria included a history of previous orthodontic treatment, <8 years of age, known upper airway anomalies, chronic or recurrent infections (for example, tonsillitis or sinusitis), asthma, smoking, BMI > 90 kg/m2, and systemic diseases, especially diabetes and hypertension. In addition, patients with skeletal class I occlusion with an A point, nasion, and B point (ANB) angle of 2‒4° were included. The weight and stature were measured upon medical examination to calculate BMI by dividing weight (kg) by height squared (m2).
The sample size was calculated as 34 patients in each group, according to a study by Kurt et al.,10 by considering α = 0.05, P (statistical power) = 90% and d = 1.6%. Seventy patients participated in the study and were divided into 2 groups to compare pharyngeal airways, with 35 participants (18 males and 17 females) who had a history of habitual snoring of >6 months in the experimental group and 35 healthy participants (16 males and 19 females) in the control group.
Lateral cephalometric radiographs were taken with the participants in a standing position, with the teeth at maximum intercuspation, the lips in a relaxed position, and the head in the natural position, with the Frankfurt horizontal plane parallel to the ground. A 2-millimeter aluminum filter was used to visualize the nasal pyramid.26 The nasopharyngeal airway was measured according to the analysis of Linder-Aronson (1970),27 and 4 indices were measured in each lateral cephalometric radiograph.
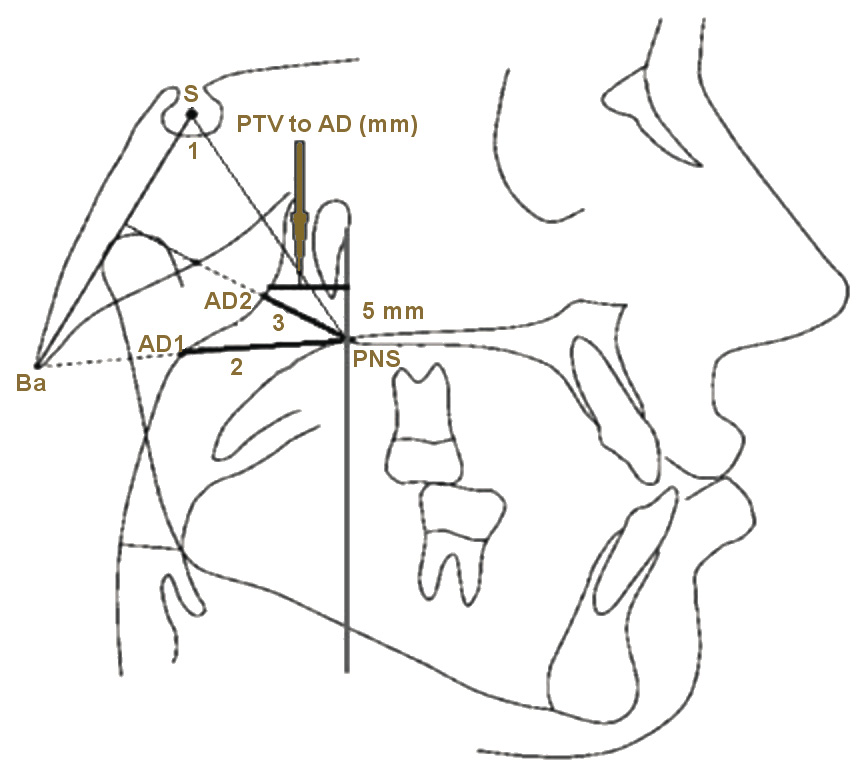
Ba-S-PNS is used to determine the hard palatal and soft palatal horizontal position and the cause of airway obstruction, while nasopharyngeal airway adenoid-1 (PNS-AD1) is used for screening the airway obstruction, which is the pharyngeal diameters at the levels of the adenoids. PNS-AD2 is used for screening the airway obstruction and is measured as the distance from PNS to the nearest adenoid tissue on a perpendicular line from PNS to sella-basion (S-Ba). The PTV distance to the adenoid (PTV to AD) is used for airway obstruction screening, using a distance of 5 mm above the PNS and on the PTV to the nearest adenoid tissue (Figure 1).
A radiologist and a dentist measured the indices for each patient separately. Subsequently, the mean of the variables associated with the upper airway was determined. Observations were repeated 2 weeks later, and the results were compared between the 2 stages. An independent-sample t test assessed intra-observer variations, with no significant differences found in the values of the observed parameters.
Statistical analysis
Data analysis employed IBM SPSS Statistics for Windows, v. 25.0 (IBM Corp., Armonk, USA). Data was expressed as mean and standard deviation (M ±SD). The Kolmogorov–Smirnov test determined the normality of data distribution. All variables were normally distributed except for age. The cephalometric measurements in the 2 groups were compared using the analysis of variance (ANOVA), and Levene’s test confirmed the equality of variance. The independent-sample t tests detected significant differences in the craniofacial and airway space measurements between the 2 groups. Statistical significance for all tests was set at p < 0.05 (2-tailed).
Results
The mean age of the participants was 10.4 years, which ranged from 8.1 to 12.9 years. The distribution of age, height and weight was the same among the studied groups. Based on the Berlin questionnaire, 19 samples (54.28%) were low-risk, and 16 (45.72%) were high-risk in the experimental group. The BMI values in the experimental and control groups were 43.0 ±5.3 kg/m2 and 39.0 ±8.7 kg/m2, respectively, with no significant difference between the 2 groups.
Table 1 presents the mean values for Ba-S-PNS, PNS-AD1, PNS-AD2, and the distance between PTV and adenoid. There were no significant relationships between the 4 indices in patients with and without snoring. Furthermore, the independent-samples t tests showed no relationship between indices in males and females with and without snoring (Table 2 and Table 3).
Table 4 shows the relationship between sex and radiographic indices. There was a significant relationship between sex and the Ba-S-PNS index in individuals with and without snoring. Also, a significant relationship was found between sex and the PNS-AD2 index in patients with snoring. However, the relationships between sex and the other indices in patients with and without snoring were not significant.
Discussion
Possible causes of OSA are anatomical narrowing of the upper airway as a consequence of alterations in the craniofacial morphology or soft tissue enlargement, sleep posture, age, male gender, nasal obstruction, and adipose tissue in the pharynx.25 However, the evaluation of airways in snoring patients has not been the focus of much attention.2 Therefore, this study used lateral cephalograms to investigate the upper airway structures in snoring and non-snoring patients.
The present study found no statistically significant differences in the indices between the two groups. However, the mean airway indices were numerically higher in all non-snoring individuals, which is consistent with the findings reported by Pirila-Parkkinen et al., who compared snoring and non-snoring individuals in terms of PNS-AD1 and PNS-AD2 indices.2 In their study, OSA patients showed the most deviations from the control group in terms of cephalometric findings compared to the other subgroups of obstructive sleep disorders. More specifically, there was a significant difference in PNS-AD1 between the OSA and the control groups. They also observed that airway obstruction was more severe in the OSA group. Also, the findings of the present study concur with a study by Kurt et al. comparing snoring and non-snoring patients in terms of the PNS-PPW1 index (upper pharyngeal space).10
In the present study, the difference between males and females only reached statistical significance for the Ba-S-PNS index (p = 0.016). Specifically, the mean value of this index was higher in non-snoring females than in non-snoring males, but the means of the other three indices in both sexes were almost the same. A study by Daraze et al. on healthy Lebanese participants showed a significant difference between sexes regarding the PNS-AD1 index. This contrast with the present study could be attributed to the difference in sample size and ethnicity. However, Daraze et al. reported no significant difference in the PNS-AD2 index between the two sexes.27
A longitudinal study by Peppard et al. showed that an increase in weight of 10% (relative to stable weight) predicted a 6-fold increase in the odds of developing moderate to severe SDB, and a 32% increase in apnea-hypopnea index (AHI) during a follow-up period of four years, while a weight loss of 10% led to a 26% reduction in AHI.21
Hou et al. reported that deviations in craniofacial morphology are more common in Chinese patients with severe OSA,28 whereas Rose et al. did not establish a direct relationship between cephalometric findings and OSA severity.29
The current study found a statistically significant difference in the Ba-S-PNS and PNS-AD2 indices between snoring males and females. However, no significant relationship was established between these two groups regarding the other two indices. In addition, Pirila-Parkkinen et al. showed no significant difference between sex and pharyngeal airway indices in patients with obstructive sleep disorders.2
Studies have considered the relationship between airways and anatomical structures and the type of malocclusion. According to Dastan et al., the upper airway volume in sub-groups did not show a significant difference.30 Therefore, these indicators were not evaluated separately in this study. However, some studies have shown that the vertical height of the face can affect airway volume.30, 31, 32
Patients with hypertension and diabetes were excluded because, according to studies, the risk of bruxism increases with these disorders, and bruxism can cause airway disorders.33, 34
According to Li et al.,35 orthodontic treatment interventions could change the dimensions of the upper airways, whereas Abdalla et al. did not confirm this finding.36 Numerous other studies demonstrated the corrective effect of combined surgical and orthodontic treatments on the airway space.35, 36, 37 Therefore, the present study excluded patients with a history of orthodontics.
This study examined the nasopharyngeal airway exclusively. Other factors, such as the oropharyngeal airway, hyoid bone, and nasal cavity anatomy, will be the subject of subsequent studies to evaluate their relationship with the nasopharyngeal airway.
Limitations of this study included difficulty in accessing OSA patients, expensive and time-consuming processes, the small sample size, and the assessment of two-dimensional radiographs for airway measurements. Future studies will overcome these limitations by initially employing three-dimensional imaging airway segmentation and volume measurements in the subsequent research phase.
Conclusions
The present study found no significant differences in the studied indices between the snoring and non-snoring subjects. Therefore, the airway anatomy was not significantly different between these two groups. However, the absence of no significant differences between the two groups could be attributed to the higher proportion of low-risk subjects than high-risk subjects in the experimental group.
Ethics approval and consent to participate
The Research Ethics Board at the Qazvin University of Medical Sciences, Iran, approved the study (IR.QUMS.REC.1396.145). Written informed consent was obtained from all study participants prior to the initiation of the research study.
Data availability
The datasets generated and/or analyzed during the current study are available from the corresponding author on reasonable request.
Consent for publication
Not applicable.