Abstract
Background. Chemotherapy, one of the most important treatment modalities for treating childhood cancers, is a major cause of bone loss in patients and survivors.
Objectives. This study aimed to evaluate mandibular bone structures in childhood cancer survivors (CCSs) by means of fractal dimension (FD) analysis and the Klemetti index (KI), and to compare them with regard to the control group.
Material and methods. In this retrospective study, the panoramic radiographs of 49 CCSs were included as the study group and the panoramic radiographs of 49 cancer-free volunteers were included as the control group. Based on the panoramic radiographs, FD and KI were determined.
Results. No significant differences were observed between the study and control groups in terms of mean FD values for regions of interest (ROIs) ROI_1, ROI_2 and ROI_3 (p = 0.750, p = 0.490 and p = 0.910, respectively). The mean FD values for ROI_1 for the study and control groups were 1.08 ±0.18 and 1.07 ±0.14, respectively. The mean FD values for ROI_2 for the study and control groups were 1.11 ±0.13 and 1.09 ±0.13, respectively. The mean FD values for ROI_3 for the study and control groups were 1.15 ±0.14 and 1.15 ±0.15, respectively. Statistically significant differences between the study and control groups were noted only in the distribution of the KI categories (p = 0.015).
Conclusions. Childhood chemotherapy may affect mandibular bone structures during a lifetime. The Klemetti index should be considered a useful clinical diagnostic tool for the examination of mandibular bone structures.
Keywords: pediatric oncology, panoramic radiography, fractals, childhood chemotherapy
Introduction
Cancer is associated with the abnormal and uncontrolled proliferation of cells.1 Childhood cancers are all cancers that occur in children up to the age of 19 years. The treatment and follow-up of these patients are performed in pediatric oncology service facilities. Although certain etiological factors (genetic predisposition or fetal exposure to ionizing radiation) have been suggested, the etiology of most childhood cancers remains unknown.2, 3 Leukemia and lymphomas are the most common childhood cancers in the world. They are followed by brain tumors, peripheral nervous system tumors, retinoblastomas, kidney tissue tumors, liver tumors, malignant bone tumors, sarcomas, germ cell tumors, malignant epithelial neoplasms, malignant melanomas, and other neoplasms.4, 5
The diagnosis of a childhood cancer can be made through blood work, a biopsy and a clinical examination. Different imaging methods can also be used, e.g., ultrasonography, computed tomography (CT), magnetic resonance imaging (MRI), or positron emission tomography/computed tomography (PET/CT).6
Treatment methods for childhood cancers include surgery, chemotherapy, radiotherapy, and stem cell transplant.7 Oncologists and surgeons can choose one of these treatment options upon mutual consultations after diagnosis, or they can decide on a treatment strategy that combines 2 or more of the aforementioned modalities. Depending on the type of cancer, 60–70% of childhood cancer patients can achieve complete response if provided with appropriate treatment.4 However, some studies have concluded that childhood cancer survivors (CCSs) struggle with chronic diseases for the rest of their lives.8
Unfortunately, cancer treatment has some undesirable effects. For example, in the surgical method, the tumor and the surrounding tissue are removed radically, which results in esthetic and functional handicaps. In chemotherapy, adjusting the drug doses can be a serious problem. Also, chemotherapeutic agents can cause destruction of varying extent in healthy tissues and organs throughout the body. Hair loss and nausea are among the most common side effects of chemotherapy, whereas fatigue, weakness, mouth sores, digestive system problems, bleeding, and febrile infections are less common.9 Radiotherapy consists in the direct application of X-rays to the area where the tumor is located. This treatment method is used as little as possible in childhood cancers, as it can cause growth and developmental retardation, and create a secondary malignancy risk in immature organs and tissues.10
Childhood cancer treatment may cause a decrease in bone mineral density (BMD), bone quality impairments or other side effects in the bone tissue, such as avascular necrosis due to chemotherapy-induced osteoporosis. Moreover, low BMD and bone microarchitecture disorders may persist during adulthood, thereby increasing the risk of fractures. There are numerous studies that report on osteoporosis and low BMD, previously induced by childhood cancer chemotherapy, observed in long bones with the use of dual-energy X-ray absorptiometry (DXA).11, 12, 13
The trabecular bone structure is essential in determining BMD.14 The degree of mineralization decreases with increasing trabecular porosity.15 The term ‘fractal’ defines self-similar geometric shapes. Fractal dimension (FD) analysis is a quantitative method for evaluating complex self-similar structures, such as the trabecular bone, and can easily be performed on dental radiographs. The resultant FD value represents the complexity of the structures. It has been previously demonstrated that as bone complexity increases, the FD value similarly increases.16, 17 Fractal dimension analysis has been successfully used to evaluate the osteoporotic conditions of the craniofacial bones.18, 19, 20, 21
The mandibular cortical index (MCI), also known as the Klemetti index (KI), is one of the most established techniques for the diagnosis and evaluation of osteoporotic bone changes on dental radiographs.22 The determination of KI is based on the qualitative evaluation of the mandibular cortical bone appearance on panoramic radiographs. It has been previously demonstrated that there is a statistically significant relationship between the BMD values obtained with DXA and the KI classification. Thus, KI could be used as a diagnostic tool to identify the risk of bone mass loss.23, 24, 25
To the best of our knowledge, our research is the first clinical study that evaluates mandibular bone alterations in CCSs by means of FD analysis and KI. Our study aimed to evaluate mandibular bone structures in CCSs after chemotherapy by means of FD analysis and KI, and to compare the obtained results with those for a cancer-free control group.
Material and methods
Image data acquisition
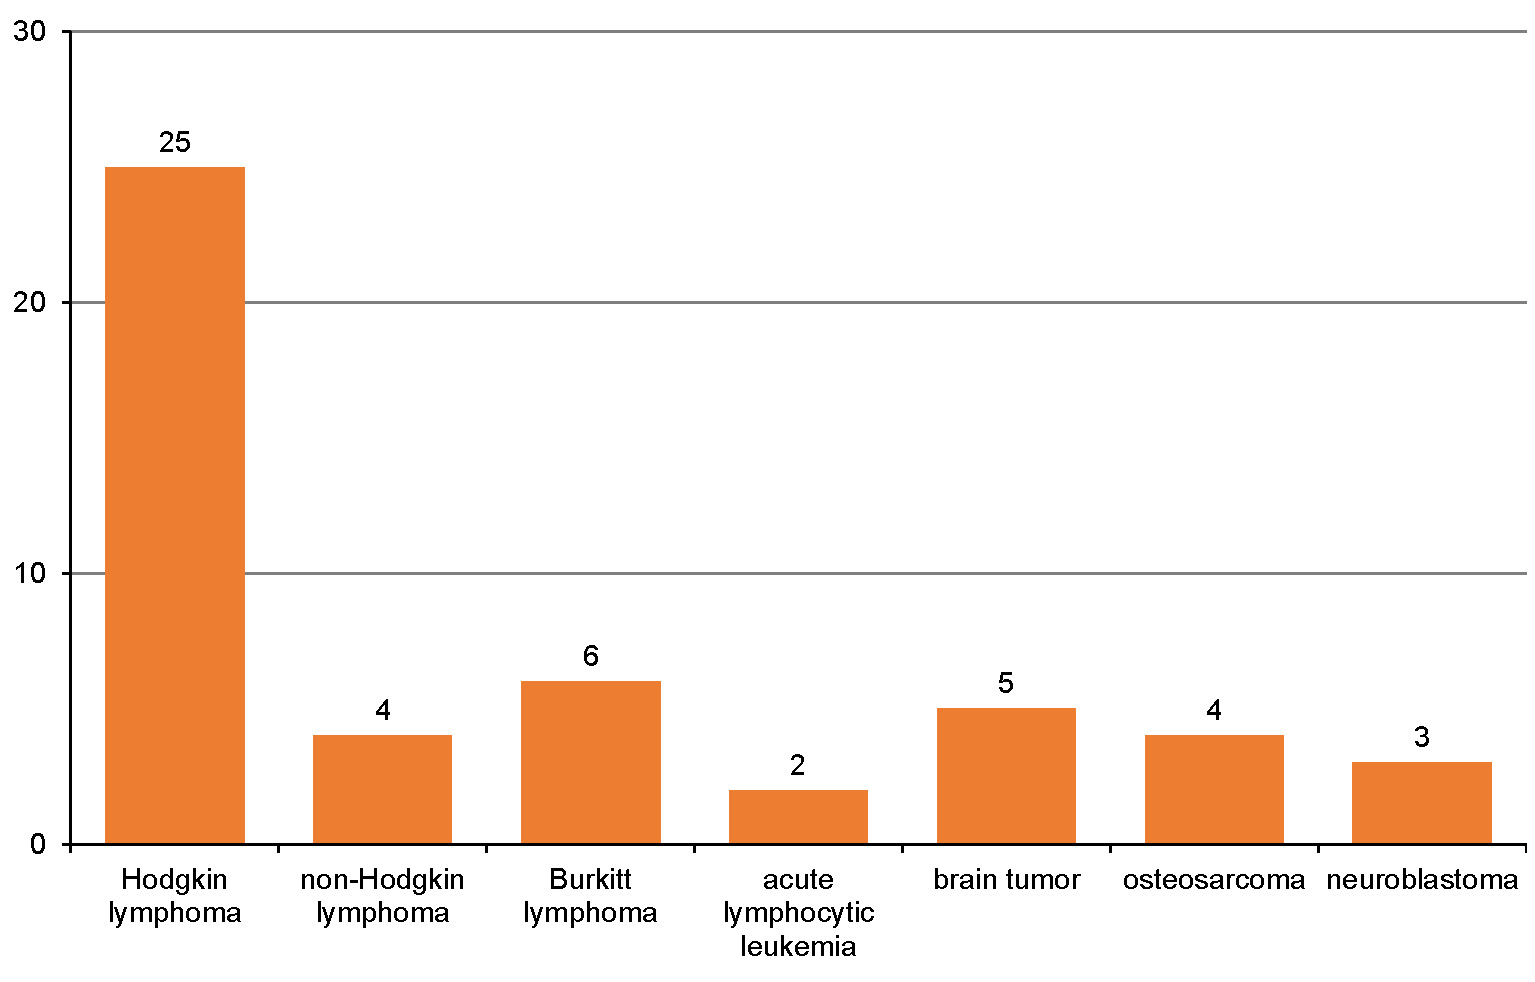
This study was carried out with the permission of the institutional Ethics Committee at Mersin University, Turkey (decision No. 2018/209). The study group consisted of the panoramic images taken from 49 CSSs whose detailed anamneses were received and referred to the clinic at the Department of Pediatric Dentistry of Mersin University in the years 2018–2019. All 49 patients were included in the study group. The patients were referred to our clinic for dental check-ups; their pediatric oncological follow-up was performed at least 2 years after the oncological treatment was completed. The types of cancer the patients in the study group were treated for are presented in Figure 1. Treatment modalities for all patients in the study group included at least one of the following: dexamethasone; prednisolone; or methotrexate. None of the patients in the study group underwent cranial radiation therapy. Patients in the study group were divided into 2 categories – solid tumor patients or blood cancer patients, according to the kind of chemotherapy they received. The control group, on the other hand, consisted of the panoramic images of 49 patients who were referred to the Department of Pediatric Dentistry due to different dental complaints, without any systemic disease or drug use listed in their detailed medical history. The panoramic images of those who used drugs that might affect bone metabolism (other than chemotherapeutics), underwent cranial radiation therapy or had any other systemic disease were excluded from the study.
All panoramic radiographs were taken using the same CRANEX® Novus panoramic machine (Soredex, Tuusula, Finland) set at 70 kVp, 10 mA and 8 s of exposure time. All participants were positioned so that the Frankfurt horizontal plane was parallel to the floor and the sagittal plane was adjusted to the vertical line produced by the device. All digital panoramic radiographs were stored at a resolution of 5.5 LP/mm. The size of all stored digital panoramic radiographic images was 2,976 × 1,536 pixels.
Evaluation of the images
Fractal dimension analysis
All digital panoramic radiographic images were exported in the JPEG (Joint Photographic Experts Group) file format at 1,600 × 887 pixels. The exported images were analyzed with the ImageJ software, v. 1.3 (National Institutes of Health, Bethesda, USA; https://imagej.nih.gov/ij/). Fractal dimension analysis was performed according to White and Rudolph’s box-counting method.18
Three different regions of interest (ROIs) were determined. Each ROI on both the left and right sides was measured, and the obtained values were used for statistical analysis (Figure 2):
– ROI_1 – a square of 30 × 30 pixels in the geometric center of the subcortical area in the mandibular condyle;
– ROI_2 – a square of 30 × 30 pixels in the supracortical area of the angulus mandibulae; and
– ROI_3 – a square of 30 × 30 pixels in the trabecular bone area, distal to the root of the first or second premolar, above the mandibular canal. This area was determined to detect the FD value in the mandibular corpus. To standardize the measurement in this area, as presented in Figure 2, it was made from the premolar tooth which did not have any lesion in or around its apical part.
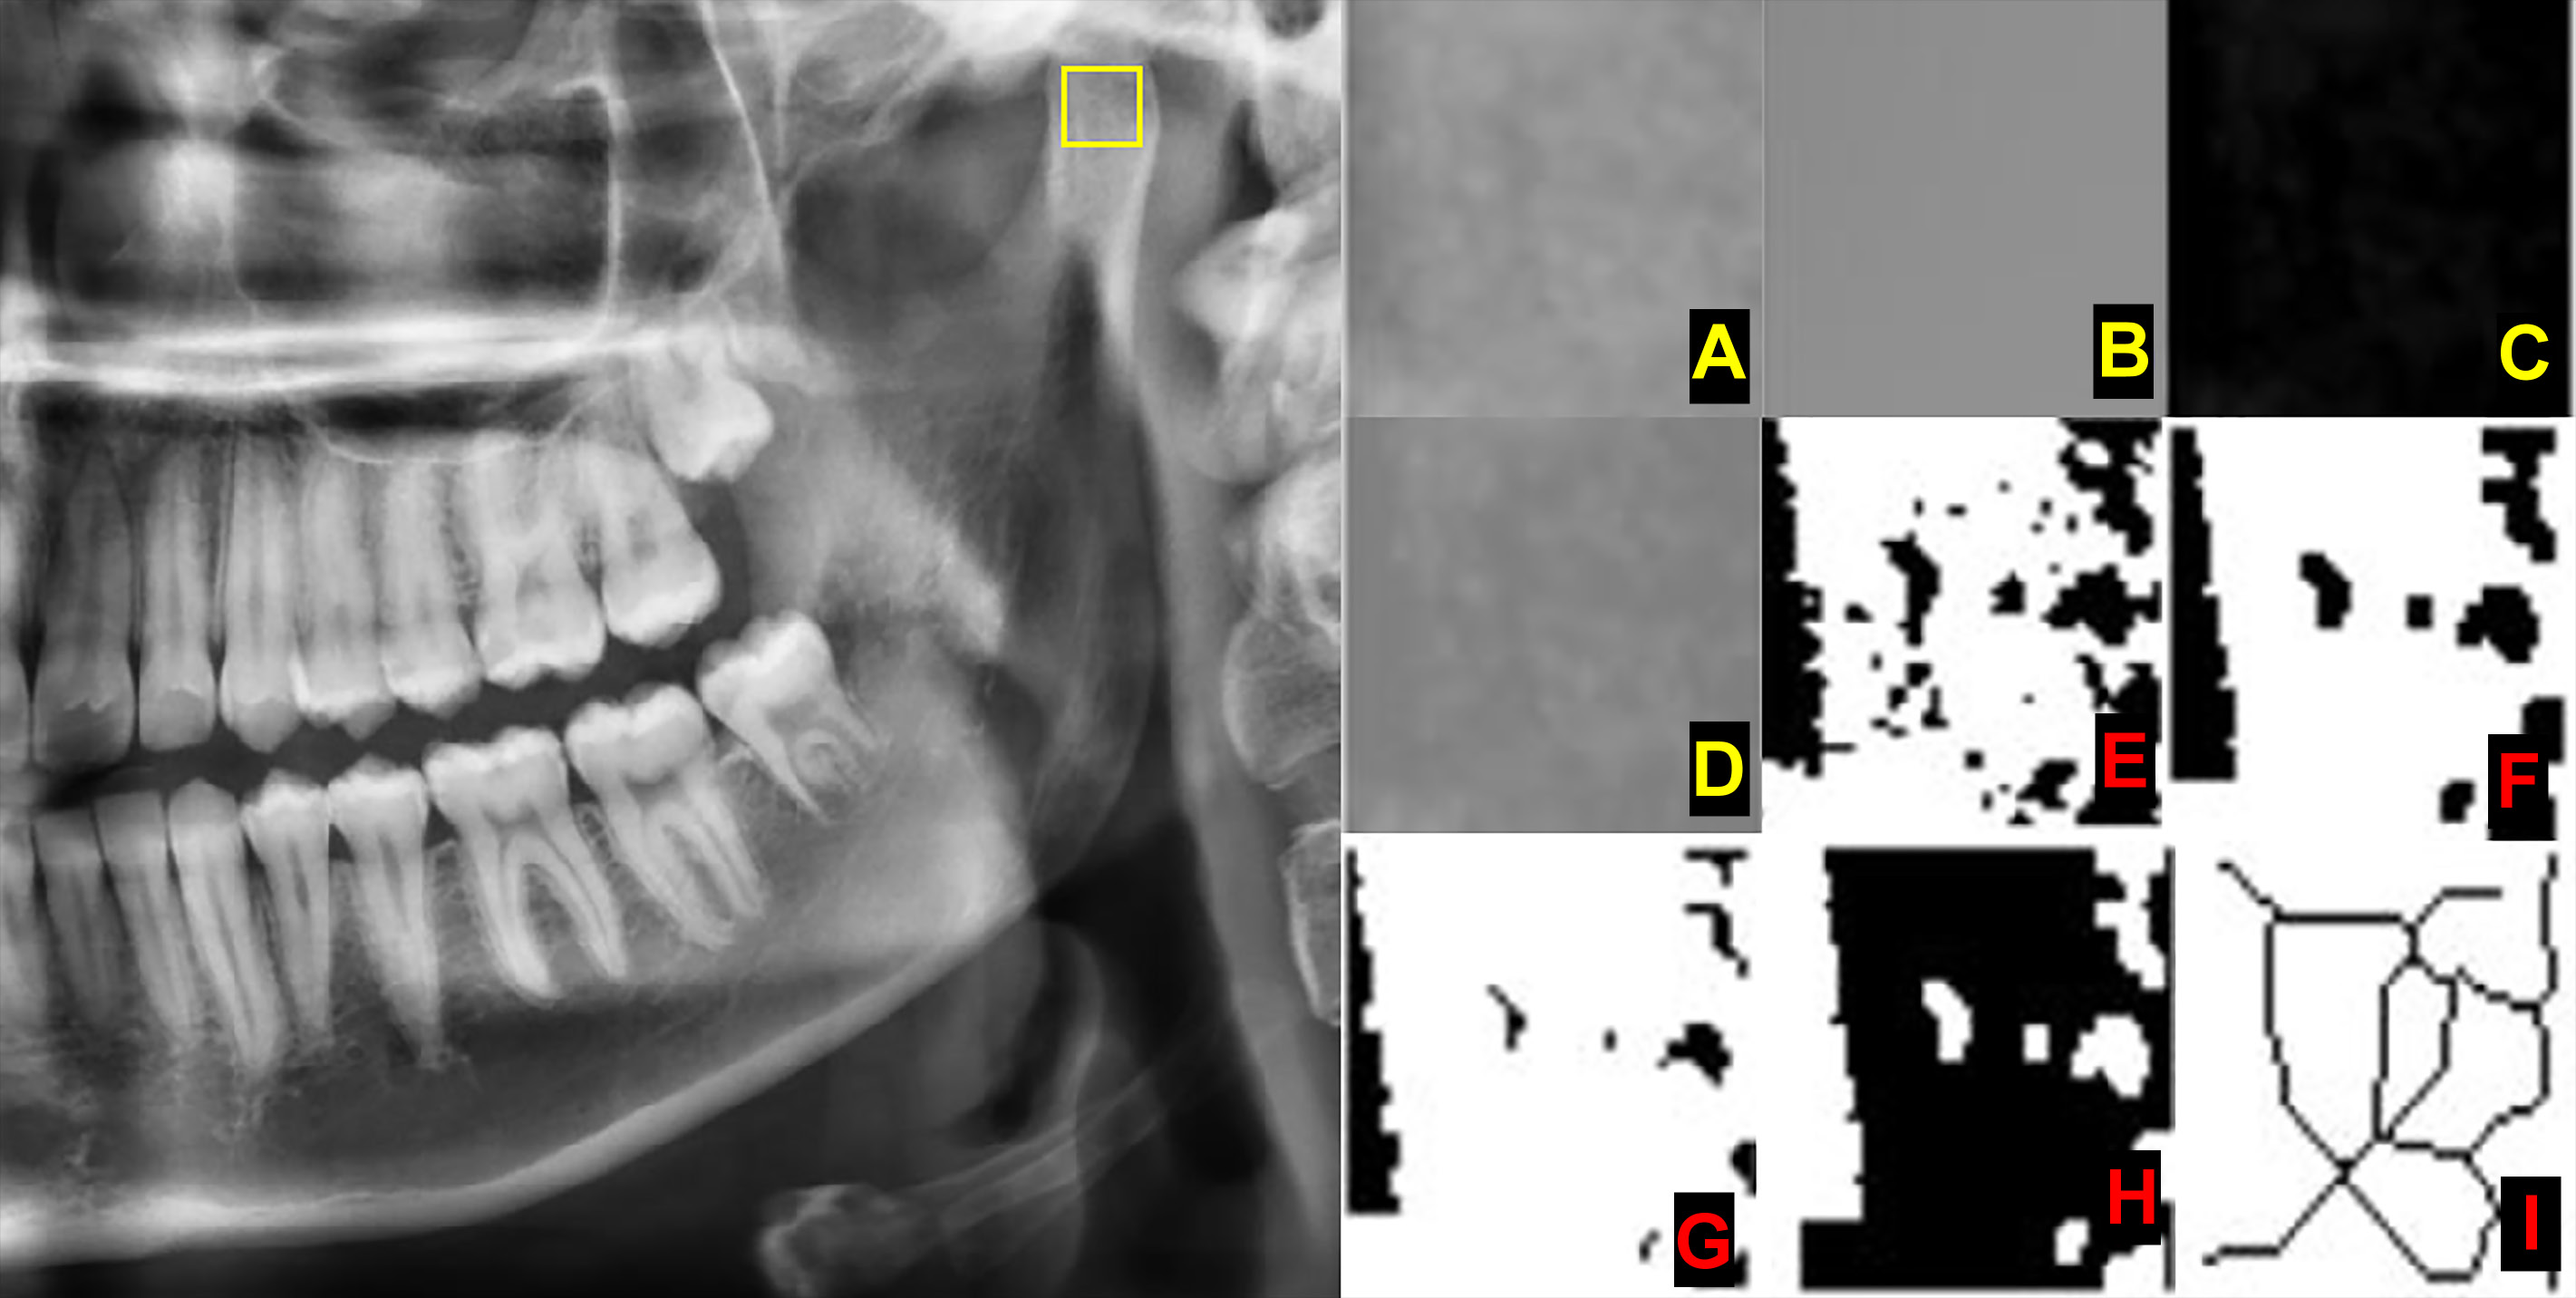
The chosen ROI was cropped and duplicated (Figure 3A). The image was blurred with the Gaussian filter to remove the large-scale variations of brightness related to object thickness or the soft tissue (Figure 3B). The overly blurred image was subtracted from the initial image (Figure 3C). A gray value of 128 was added to each pixel location, resulting in an image with a mean pixel value of 128 (Figure 3D). With this step, certain variations, such as trabeculae and bone marrow, become visible. The image was then made binary with the threshold function, resulting in an image of 2 values – black and white (Figure 3E). White areas represented trabeculae, while black areas represented bone marrow. Then, the image was eroded and dilated, reducing the noise (Figure 3F and Figure 3G). The resultant image was inverted so that the areas representing trabeculae were set to black (Figure 3H). The image was further eroded with the skeletonization function until the only centerline of the pixels was present (Figure 3I). The FD value was calculated with the box-counting function. The image was covered with squares of 2-, 3-, 4-, 6-, 8-, 12-, 16-, 32-, and 64-pixel-sized boxes. The number of boxes involving trabeculae and the total count of the boxes were calculated for each box size. The FD value was measured from the slope of the line in the logarithmic scale graph of the obtained values.
Klemetti index
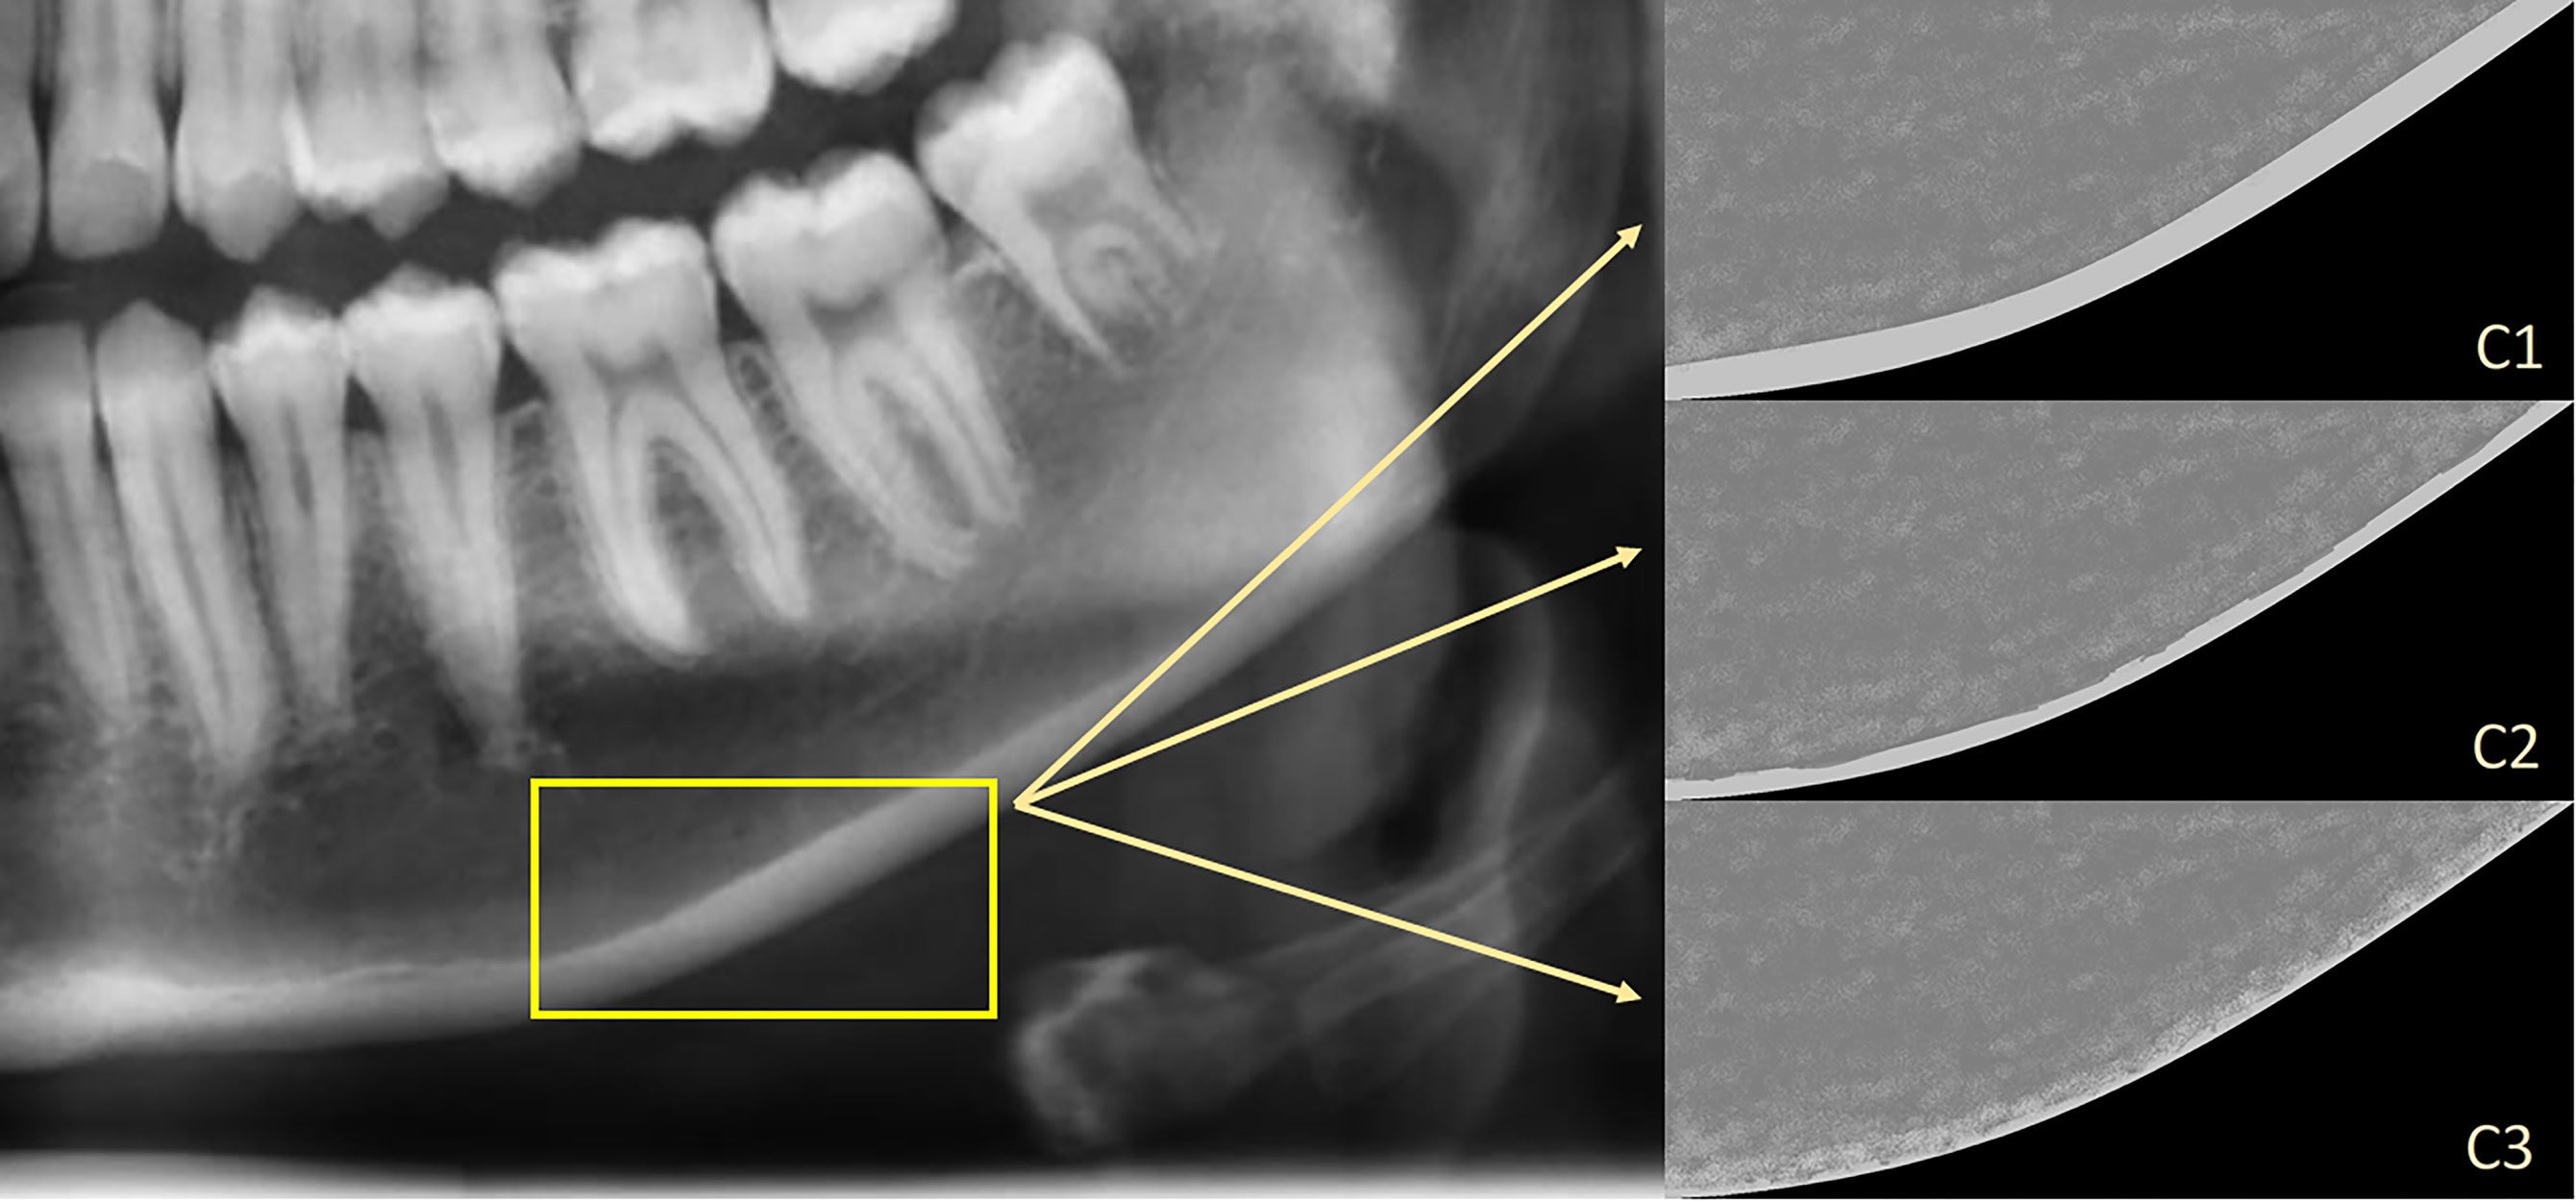
The appearance of the mandibular cortical bone, distal to the mental foramen, was evaluated bilaterally to make a classification. The classification was made according to KI and described as22:
– C1 – the endosteal margin of the cortex is homogenous, even and sharp (bilaterally);
– C2 – the endosteal margin of the cortex displays semi-lunar defects (lacunar resorption) or endosteal cortical residues (unilaterally or bilaterally); and
– C3 – the cortical layer is porous and displays endosteal cortical residues (Figure 4).
The measurements were performed by 2 oral radiologists with 4 years of experience. The observers re-evaluated a randomly chosen 20% of all patients 2 months after the completion of the first measurements to assess for intra-observer reliability and repeatability.
Statistical analysis
The analysis of the data was performed with the TURCOSA cloud software and the R programming language. Descriptive statistics was applied. The Shapiro–Wilk test was performed to test the normality of data distribution. As the values were normally distributed, parametric tests were used for all statistical analyses. Student’s t test was performed to compare the study and control groups with regard to ROI_1, ROI_2 and ROI_3. The χ2 test and Fisher’s exact test were performed to compare the categorical variables between the study and control groups. All tests were judged statistically significant at 5% (p < 0.05).
Results
The mean age of patients in the study and control groups was 14.5 ±4.4 years and 14.6 ±4.8 years, respectively. Both study and control groups were comprised of 32 males and 17 females. The summary of demographic variables is presented in Table 1. The distribution of all numerical variables conformed to a normal pattern. There were no statistically significant differences between the variances of the numerical variables. The study and control groups were similar in terms of age and gender (p > 0.5). The mean FD values for ROI_1, ROI_2 and ROI_3 were not significantly different in the study and control groups (p = 0.750, p = 0.490 and p = 0.910, respectively). The mean FD values for ROI_1 for the study and control groups were 1.08 ±0.18 and 1.07 ±0.14, respectively. The mean FD values for ROI_2 for the study and control groups were 1.11 ±0.13 and 1.09 ±0.13, respectively. The mean FD values for ROI_3 for the study and control groups were 1.15 ±0.14 and 1.15 ±0.15, respectively. The mean (M), standard deviation (SD), minimum (min), and maximum (max) FD values are shown in Table 2. There was a statistically significant difference in the mean FD values for ROI_3 between the solid tumor and blood cancer groups; the values for the latter group were found to be higher (Table 3).
Statistically significant differences were noted only in the distribution of the MCI (KI) categories. In the chemotherapy group, C2 and C3 bones together occurred more frequently than C1 bones (Table 4). There was no statistically significant association between the cancer type and the KI category (Table 5).
The results of the post-hoc power analysis for the t test and the χ2 test used in the intergroup comparisons of ROI_1, ROI_2, ROI_3, and the KI variables are presented in Table 6. The inter-observer agreement for ROI_1, ROI_2, ROI_3, and KI measurements and analysis was 0.79, 0.77, 0.79, and 0.72, respectively. The intra-observer agreement for observer 1 was 0.92, 0.96, 0.92, and 0.89, while the intra-observer agreement for observer 2 was 0.90, 0.92, 0.87, and 0.80 for ROI_1, ROI_2, ROI_3, and KI, respectively.
Discussion
Cancer is a major cause of death in children worldwide and the recorded incidence is increasing with time. With the help of advanced multimodality treatment, the 5-year survival of children diagnosed with cancer has improved considerably.4 However, CSSs have to cope with serious medical and psychosocial late side effects.8 Furthermore, CSSs are at risk for cardiomyopathy, cognitive impairment, chronic musculoskeletal diseases, renal failure, secondary malignant neoplasms, and early mortality. These late effects can often be attributed to cancer treatment-related risk factors.9 Skeletal damage (osteopenia, osteoporosis or avascular necrosis) may be caused by glucocorticoids and methotrexate, cranial radiation, direct radiation to the bone, and cyclophosphamide/ifosfamide, which can also cause gonadal damage.26, 27, 28 Glucocorticoids increase bone resorption, and inhibit bone formation as well as the gonadotropic and somatotropic axes. They also reduce the absorption of Ca+2 from the intestine, and change vitamin D metabolism and plasma parathyroid hormone (PTH) level, causing hypercalcemia.29 Methotrexate induces chondrocyte apoptosis, suppresses chondrocyte proliferation, triggers osteocyte apoptosis, suppresses the proliferation of secondary spongious bone, and reduces the total thickness of the growth plate and collagen-II mRNA expression. A reduction in the total thickness of the growth plate leads to reduced primary spongious bone production, and consequently, secondary spongious bone volume decreases. According to a study on rats, the cellular effects of short-term methotrexate treatment on the growth plate and the trabecular bone as well as on the histological parameters subsided by day 14 or 21.30 In the present study, all patients in the study group had different chemotherapeutic agents involved in their treatment, but all of them received cures that contained at least one of the following drugs: dexamethasone; prednisolone; or methotrexate. However, none of the patients in the present study underwent cranial radiation therapy. In addition to the late side effects of chemotherapy on the development of the permanent teeth, such as hypodontia, the cessation of root development, microdontia, taurodontism, and enamel hypoplasia were reported in previous studies.31, 32, 33, 34, 35
While investigating methotrexate-induced BMD loss in bone sarcoma survivors with DXA measurements, Pirker-Frühauf et al. found that the effects of childhood chemotherapy on bone loss were underestimated.11 According to that study, vitamin D deficiency, calcium malnutrition and lactose intolerance might potentiate the negative effects of chemotherapy, and should be taken into consideration in long-term patient management. In cancer survivors, chemotherapy-induced osteoporosis causes late side effects. However, the abovementioned study focused only on the analysis of long bones.11 In the present study, mandibular cortical and trabecular bone structures were examined for the first time in cancer survivors, and it was concluded that the mandibular cortical bone thickness in CSSs was affected in terms of KI as compared to the control group. However, no differences in mandibular trabecular structures were observed between the chemotherapy and control groups.
Marcucci et al., in a review of CCS bone health management, stated that there was a higher risk of low BMD and bone fracture after the treatment of some cancers, i.e., acute lymphoblastic leukemia, Hodgkin and non-Hodgkin lymphomas, osteosarcoma, Ewing’s sarcoma, chondrosarcoma, brain tumors, and neuroblastoma.7 In the current study, CSSs from the study group were treated for some of these types of cancer (Figure 1).
Fractal dimension analysis and KI have been used for the evaluation of the changes in craniofacial bone structures, related to osteopenic diseases or pharmacological treatment. Numerous studies reported that the FD values for mandibular bone areas, calculated on panoramic radiographs, were fair surrogate calculations of skeletal BMD.18, 19, 20, 21, 36 Apolinário et al. investigated the FD measurements in children with osteogenesis imperfecta under pamidronate treatment and concluded that the FD values were higher after the therapy.20 Gupta et al. evaluated the effect of selective serotonin reuptake inhibitors by using morphometric analysis on panoramic radiographs.37 They stated that KI was the strongest predictor of drug-related osteoporotic alterations.37 On the other hand, in a study by Allen et al., in which the researchers evaluated the compatibility of the BMD values for the mandible with KI by using quantitative computed tomography (QCT) and panoramic radiography, it was observed that KI was not compatible with the mineral density of the bone.38 On the contrary, in the current study, the C2 index frequency was higher in the study group.
To the best of our knowledge, the present study is the first to analyze mandibular bone structures in CSSs with the help of FD analysis and KI on panoramic radiographs. Overall, with regard to the effects of childhood cancer therapy on the mandibular bone FD, the study is inconclusive. As stated in the results of this study, there were no differences in mandibular bone structures between CSSs and the control group in terms of FD. Since the limitation of this study is the small size of the study group, there was a lack of adequate power to detect a statistically significant change. In this study, only the KI frequencies differed between the study and control groups. The C2 index frequency was higher in the study group, whereas the C1 index frequency was higher in the control group. One of the key findings of the present study is that KI is one of the precise indices for examining alterations in the mandibular cortical bone. These findings reinforce the general belief that childhood cancer therapy affects mandibular bone density.
Conclusions
Childhood chemotherapy may affect mandibular bone structures. The Klemetti index may be a useful clinical diagnostic tool for the examination of mandibular bone structures on dental panoramic radiographs. Since this study included a limited number of participants, more experimental and clinical studies are needed to investigate the potential effects of childhood chemotherapy on mandibular bone structures.
Ethics approval and consent to participate
This study was carried out with the permission of the institutional Ethics Committee at Mersin University, Turkey (decision No. 2018/209).
Data availability
The datasets generated and/or analyzed during the current study are available from the corresponding author on reasonable request.
Consent for publication
Not applicable.