Abstract
Background. There are studies that examined the effect of staining on the surface properties of composite resins, using different solutions and bleaching applications. However, the effect of both staining and bleaching on the same composite specimens is an issue that needs to be investigated.
Objectives. The aim of this study was to investigate the surface microhardness, roughness and color changes (ΔE) of 2 different composite resins after staining and bleaching.
Material and methods. A microhybrid and a nanohybrid composite were used in the study. One hundred and fifty specimens were prepared from each composite. The specimens were divided into 5 groups and stained for 30 days with tea, coffee, cola, red wine, or distilled water (control). Subsequently, each group was divided into 3 subgroups. Each subgroup received a 14-day application of Opalescence™ Boost, Opalescence PF or VivaStyle® Paint On Plus bleaching materials. The color as well as surface microhardness and roughness of all specimens were determined at baseline, after staining and after bleaching. Data was analyzed using the repeated-measures analysis of variance (ANOVA) and the Bonferroni method.
Results. A statistically significant decrease was observed in the surface microhardness of the microhybrid composite specimens after bleaching (p < 0.05).The highest ΔE values were observed in the red wine groups for both composite resins.
Conclusions. Staining and bleaching may affect surface properties and color, depending on the type, filler and matrix content of the composite resin.
Keywords: surface roughness, microhardness, bleaching, composite resin, color change
Introduction
Various kinds of cosmetic treatment are among the most important procedures in modern dentistry. The production of tooth-colored restorative materials, the development of bleaching materials as well as heightened patient expectations have increased the application of cosmetic dental treatment, and thus the clinical use of composite resins.1 Microhybrid composites are successfully used in anterior and posterior teeth due to their physical and mechanical properties, while nanohybrid composites, produced in recent years, provide clinical success with their attractive appearance and durability.2
The success of composite resin restorations depends on the mechanical and physical properties of the restoration, such as durability, hardness, abrasion resistance, and surface smoothness, the prevention of secondary caries, microleakage and plaque deposition, the appearance of the restoration, and patient satisfaction.3 The hardness of a material is defined as its resistance to surface indentation or abrasion, and is associated with strength and elastic limit. The resistance of a material to abrasion and scratching increases in line with its surface microhardness, while the risk of deformation decreases.4 In order to ensure successful restoration and occlusion, composite resins should possess surface hardness and abrasion resistance as close as possible to natural tooth surfaces.
The surface roughness of a composite resin restoration is an important characteristic that affects plaque deposition as well as the water absorption and cosmetic properties of the restoration. Rough surfaces may cause coloring materials to accumulate on the restoration surface, resulting in cosmetic problems.5 The colored substances released from commonly consumed beverages, such as tea, coffee or cola, may accumulate on the surface of the composite resin restoration and the teeth, and result in discoloration. Such beverages can also lead to increased discoloration of the composite resin by decreasing its surface hardness and smoothness.6 In addition to these extrinsic factors, intrinsic factors, like the structural properties of the resin, and photo-initiators, like camphorquinone, may cause discoloration in composite resins. The matrix structure, the monomer type, and the type and amount of filler may also affect the color and surface properties of the resin. Color measurement may be performed digitally, and the Munsell color system or the International Commission on Illumination (Commission international de l’éclairage – CIE) color scale are frequently employed for this purpose.7
Bleaching materials used to remove the coloration caused by intrinsic and extrinsic factors are generally divided into 2 types – office or home – depending on their use. These materials, which have similar mechanisms of action, react with and break down the organic pigment molecules responsible for tooth discoloration.8 The most commonly used active ingredients in bleaching materials are hydrogen peroxide and carbamide peroxide. These active substances may be used in different concentrations, depending on the type of bleaching agent. Home bleaching materials are applied for extended periods and have low active substance content, while office bleaching materials are used for shorter periods of time and contain high active substance content. A number of studies have shown that bleaching materials affect the surface properties of composite resins during application for tooth whitening. This effect varies, depending on the matrix structure, the polymerization dynamics, the monomer properties of the composite resin, and the type of bleaching agent.9
Previous studies have investigated the effect of immersion in frequently consumed beverages on the surface properties and color of composite resins.10 However, there is not enough research on changes that can occur on the surface of the composite resin following bleaching after such immersion. The purpose of this study was to investigate the effect of staining and bleaching on surface microhardness and roughness, and color changes (ΔE) in microhybrid and nanohybrid composites. Our hypothesis was that staining and bleaching do not significantly affect the surface microhardness, roughness and color of composite resins.
Material and methods
Specimen preparation
The 2 types of composite resin and 3 different bleaching materials used in this study are shown in Table 1. An A2 color tone microhybrid composite (Gradia® Direct Anterior; GC Corporation, Tokyo, Japan) and a nanohybrid composite (Grandio®; VOCO GmbH, Cuxhaven, Germany) were selected for the research. One hundred and fifty specimens were obtained from each composite resin, using a Teflon mold, 2-millimeter-thick and 8 mm in diameter. The composites were placed inside the mold; then, a celluloid microscope slide holder strip was placed on the composite surface to obtain a smooth surface, and finger pressure was applied. The composite materials were then polymerized on their upper and lower surfaces for 20 s, using a light-curing unit (Elipar™ FreeLight 2; 3M ESPE, St. Paul, USA) with a power of 1,000 mW/cm2. The light intensity of the curing unit was checked using a digital radiometer (Hilux Ultra Plus; Benlioğlu Dental Inc., Ankara, Turkey) and the calibration of the light-curing unit was repeated for each group. After polymerization, the surfaces of the specimens were polished for 30 s, using a slow-speed handpiece with polishing discs (Sof-Lex™; 3M ESPE) under water.
Surface microhardness measurement
The surface microhardness of the composite resin specimens was tested after 24 h of storage in distilled water. A Vickers diamond indenter was used in a microhardness tester (Micromet® 2001; Buehler, Lake Bluff, USA) for specimen indentation. Two random indentations were made on the top and bottom surfaces of each specimen, using a load of 10 g for 15 s for each microhardness test. All hardness values (HV) were calculated, where 1 HV = 1.854 P/d2, with P representing the indentation load and d the diagonal length.
Surface roughness measurement
The surface roughness (arithmetic mean roughness – Ra) of the specimens was examined with a contact mode profilometer. These values were obtained using the diamond tip of the profilometer (Surtronic® 25; Taylor Hobson Ltd, Leicester, UK), 5 μm in radius, with a cut-off value of 0.25 mm, a transverse length of 1.25 mm, a range of 100 μm, and a speed of 1 mm/s. This procedure was performed on 3 different sites, and the mean Ra values were obtained for each specimen.
Color change measurement
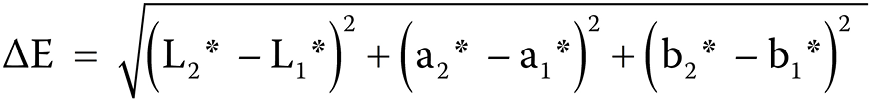
Specimen color measurements were carried out using a spectrophotometer (ShadePilot™, DeguDent GmbH, Hanau-Wolfgang, Germany) and were recorded as CIE L* a* b* values. The device was calibrated with its own calibration scale before starting color measurements in each group. Measurements were performed against a standard white background (L = 91.2; a = −0.6; and b = 1.4), and the mean CIE L* a* b* values from 3 measurements were obtained for each specimen. Color differences in the composite specimens were calculated using the following formula (Equation 1):
where:
L1*, a1*, b1* – initial CIE L* a* b* values of the composite specimens; and
L2*, a2*, b2* – CIE L* a* b* values measured at time periods (ΔL = L2* − L1*; Δa = a2* − a1*; and Δb = b2* − b1*).
Staining procedures
After the initial color, microhardness and roughness measurements had been taken, the specimens of each composite were divided into 5 groups, with 30 specimens in each group. The specimens were immersed for 30 days in tea (Yellow Label Tea; Lipton, Istanbul Turkey – a prefabricated tea bag was immersed in 150 mL of boiling water for 5 min, pH 5.78), coffee (Nescafé Classic 3in1; Nescafé, Bursa, Turkey – 3 g of coffee powder was dissolved in 150 mL of boiling water, pH 6.12), cola (The Coca-Cola Company, Istanbul, Turkey – pH 2.51), red wine (DLC Öküzgözü 2009; Doluca, Istanbul, Turkey – pH 3.28), or in distilled water (pH 6.47) as a control group. The specimens were stored in the staining solutions for 3 h per day and in distilled water for the rest of the day, at room temperature. The solutions were changed daily. The color measurements of the specimens stored in the staining solutions were repeated at 24 h, and at 7, 15 and 30 days. After 30 days of storage, microhardness and roughness measurements were performed on the surface of each specimen.
Bleaching procedures
After the completion of the staining period, the specimens stored in each solution were separated into 3 subgroups (n = 10). One of these subgroups was bleached with the 40% Opalescence™ Boost (OB) office bleaching agent (Ultradent Products Inc., South Jordan, USA) (20 min twice per week for 14 days), the second one with the Opalescence PF (OP) home bleaching agent (Ultradent Products Inc.) (30 min per day for 14 days) and the third with VivaStyle® Paint On Plus (VP) home bleaching agent (Ivoclar Vivadent AG, Schaan, Liechtenstein) (10 min twice per day for 14 days). After the 2-week bleaching period, color, microhardness and roughness measurements were repeated on the surfaces of the composite resin specimens. The value ΔE = 3.3 was determined as the clinically acceptable color change limit.
Statistical analyses
The data obtained from color, microhardness and roughness measurements was recorded and subjected to statistical analyses, using the PASW Statistics for Windows, v. 18.0, software (SPSS Inc., Chicago, USA). The surface microhardness and roughness data was compared using the repeated-measures analysis of variance (ANOVA) with 2 materials, 5 staining solutions and 3 bleaching agents, and by examining all interactions between them. Significant results were evaluated using the Bonferroni test (p < 0.05).
Results
The ANOVA results for microhardness measurements are shown in Table 2 and Table 3. Statistically significant differences were found in surface microhardness between different composite specimens subjected to staining and bleaching (p < 0.05). The surface microhardness of the microhybrid composite specimens decreased significantly after bleaching (p < 0.05). The mean surface microhardness of the nanohybrid composite specimens was significantly higher than that of the microhybrid composite specimens (p < 0.05).
The surface roughness measurement results are shown in Table 4 and Table 5. No statistically significant differences were found in surface roughness between the same composite specimens stored in different solutions and exposed to different bleaching agents (p > 0.05). In general, the mean Ra values of the nanohybrid composite specimens were significantly higher than those of the microhybrid composite specimens (p < 0.05).
Color changes in the composite resin specimens after staining with different solutions and bleaching with different agents are shown in Table 6 and Table 7. The mean ΔE values for the microhybrid composite specimens were higher than those for the nanohybrid composite specimens. The highest ΔE values in both composite groups were observed in the specimens stored in red wine. The mean ΔE values were higher than the clinically acceptable ones in the tea and red wine groups among the microhybrid composite specimens, and in all of the nanohybrid composite specimen groups, except for the control group. In general, the mean ΔE values decreased with bleaching applications and the highest decrease was found in the VP subgroups.
Discussion
In this study, the effects of staining and bleaching on the surface microhardness, roughness and color of microhybrid and nanohybrid composite resins were investigated. Considering the results, our hypothesis that staining and bleaching do not significantly affect the surface microhardness, roughness and color of composite resins was rejected. Restorative materials used in dentistry aim to mimic natural tooth structures. It is desirable for restorative materials to exhibit similar properties to dental tissues and contact enamel surfaces. It is also desirable that food, beverage, pH, and similar effects in the oral environment should not affect the surface properties of the restoration.11
The microhardness test is an effective method of measuring the mechanical strength and rigidity of a material. Microhardness testing relies on the principle that a suitably selected static diamond tip will leave a mark on the tested material when it is applied to the material under a given load within a certain period.12 The microhardness value is obtained by measuring the microscopic trace which occurs after the load has been removed. Different methods are used to measure surface hardness. Which method should be selected depends on the material to be tested. Since the Vickers test is suitable for measuring the hardness of brittle materials, it can be used to measure the mcrohardness of composite specimens.13 Vickers hardness tester tips are shorter than those of other testers, which means that the testing device is less affected by the surface properties of the material, thus producing more accurate measurements.14 Due to these advantages, in this study, microhardness measurements were taken using a Vickers hardness tester.
The chemical composition and filler content of composite resins affect their physical properties, such as surface microhardness. In their examination of the mechanical properties of composite resins, Braem et al. reported that materials with high filler content had higher surface hardness.15 Similarly, Rodríguez et al. found that the mechanical properties of composite resins were related to the amount of filler employed.16 The mean HV of the nanohybrid composite resin specimens in the present study were significantly higher than those of the microhybrid composite resin specimens (p < 0.05). The filler content of the nanohybrid composite resin used in this study (71.4% by volume) is higher than that of the microhybrid composite resin (66% by volume). Surface hardness is also affected by the degree of polymerization. There are some studies in the literature that report that nanohybrid composites show lower degrees of polymerization than microhybrid composites.17 In the present study, the higher surface microhardness of the nanohybrid composite specimens may also be related to the degree of polymerization.
Statistically significant differences were observed in the surface microhardness of the composite resin specimens after staining (p < 0.05). The mean surface microhardness of the specimens stored in cola and red wine generally decreased. Low-pH beverages, such as cola, are reported to cause erosion and dissolution on the surface of composite resin specimens, and to reduce surface hardness. In addition, the surfaces of Bis-GMA- and UDMA-based polymers tend to undergo chemical softening under the effect of alcohol.18 A decrease in the mean surface microhardness of the specimens stored in red wine in this study can be explained in terms of this effect. Similarly, Okte et al. reported decreases in the mean surface microhardness of the specimens stored in red wine in their study.19
Bleaching agents may affect the surface microhardness of composite resins, depending on factors that include the composition of the material, the concentration of the bleaching agent and the method of application. Cehreli et al. found that the surface microhardness of composite resin specimens decreased with bleaching applications.20 Okte et al. showed that bleaching applications reduced surface microhardness in microhybrid composites and that this was due to the oxidation effect of hydrogen peroxide in the bleaching agent on the resin matrix.19 The surface microhardness of the microhybrid composite specimens in the present study decreased significantly as a result of bleaching applications (p < 0.05). The mean surface microhardness of the nanohybrid composite specimens decreased; however, the differences were not statistically significant (p > 0.05). The bleaching agents used in this study, containing hydrogen peroxide and carbamide peroxide at different concentrations, reduced the mean microhardness of the composite resin specimens by affecting the surface matrix structure.
As the surface roughness of the restoration decreases, its appearance improves, coloring resistance and abrasion resistance increase, plaque deposition decreases, and the health of the periodontal tissues is maintained. In addition, as the surface smoothness of the restoration increases, microleakage between the tooth and the restoration decreases, and the risk of secondary caries declines. Studies have also proven that oral hygiene increases in line with the surface smoothness of the restoration.21 The most commonly used parameter for measuring the surface roughness of composite resins is Ra. Profilometer devices have long been used to obtain this value from the material surface in vitro. These devices are capable of calculating the mean Ra values of various materials by capturing two-dimensional (2D) images from the specimen surface.22
In the literature, some studies have indicated that the surface properties of the composite resin develop as the filler particle size decreases. These studies suggest that nanoscale particles form a smoother surface as compared to the conventional microhybrid composites.23, 24, 25 Ergücu et al. reported that smaller defects occurred on the surfaces of composite resins after polymerization and polishing, and that smoother surfaces were obtained.22 Similarly, Ereifej et al. found that nanofiller composites provided lower surface roughness and better polishability.26 In contrast to these studies, the mean Ra values of the nanohybrid composite specimens in the present study were higher than those of the microhybrid composite resin specimens. Although the primary particle size of the nanohybrid composite used in this study is very small, these particles aggregate in larger masses. This structure may increase the surface roughness of the nanohybrid composite. Other important factors affecting the surface roughness of composite resins in addition to the filler particle size include the type and amount of filler, and the organic matrix structure.26
The exposure of composite resin restorations to different solutions in the oral environment may also affect their surface properties. In the present study, the composite resin specimens were stored in commonly used alcoholic (red wine) and non-alcoholic (tea, coffee and cola) solutions, and their Ra values were compared with those of the control group. Although no statistically significant change in Ra values was observed after staining in either composite, the mean surface roughness increased, especially in the specimens stored in cola and red wine. Previous studies have shown that alcoholic beverages increase the surface roughness of composite resins.27 Alcohol derivatives, such as ethanol in red wine, can increase the surface roughness of the composite resin by penetrating the resin matrix structure. Bansal et al. investigated the effect of different solutions on the surface roughness of composite resins and observed the highest Ra values in the specimens stored in cola.27 They attributed this to the low pH of cola, which leads to wear and roughness on the surface.27 In the present study, an increase in the mean surface roughness of the specimens stored in alcohol and cola may be explained by the fact that these drinks cause a slight degradation of the resin matrix structure.
The surface roughness of the composite resins in the present study increased with the application of different bleaching agents, although this increase was not statistically significant (p > 0.05). Similar to our study, Türker and Biskin also reported that carbamide peroxide-containing agents increased the surface roughness of composites, but that this increase was not statistically significant.28 Bowles et al. reported that bleaching agents containing hydrogen peroxide did not affect composite surface roughness.29 Consistent with our results, that study concluded that bleaching agents slightly impaired the composite structure through oxidation, but that this was not statistically significant.29
Color plays an important role in the success of esthetic restorations. In order to provide a pleasing cosmetic appearance for an extended period of time, the color of the restorative material must be compatible with the tooth color and resist coloring.30 Discoloration can be assessed using different methods, such as visual or instrumental techniques. Seghi et al. reported that color change could only be perceived with difficulty at a ΔE value equal to or lower than 1, whereas a ΔE value greater than 2 could usually be detected clinically.31 Johnston and Kao investigated color differences with the use of visual evaluation and colorimetry, and they reported ∆E = 3.3 as the threshold value at which color differences can be distinguished in the oral environment.32 The generally acceptable clinical ΔE value in the literature is 3.3, since a lower ΔE value will be visually imperceptible.33 A spectrophotometer equipped with an integrating sphere can be used to measure ΔE in composite resins. This configuration of a spectrophotometer yields a more accurate result than visual assessment or other instruments.34 Due to these advantages, a spectrophotometer was employed for color measurement in this study.
The mean ΔE values of the nanohybrid composite specimens before and after staining were higher than those of the microhybrid composite specimens. Water absorption can lead to color change in restorations. In addition, absorbing excess water, composite resins can expand and plasticize, which results in the formation of microfractures. Microfractures or voids in the interface between the filler and the matrix thus cause stain penetration and color change. The chemical properties of composite resins therefore directly affect color change. The hydrophilic TEGDMA molecule has been reported to increase the water absorption of composite resins, thus causing discoloration. In addition to water absorption, the surface roughness of composite resins is an effective factor in stain retention.35 In the present study, the monomer content and the higher mean surface roughness of the nanohybrid composite resin specimens may explain the higher mean ΔE values observed.
The highest ΔE values in the present study were observed, in descending order, in the specimens stored in red wine, tea and coffee. Similar to our study, Stober et al.36 and Ertaş et al.37 reported that the highest color change was caused by red wine followed by tea and coffee. Um and Ruyter reported that the low pH of cola affected the surface integrity of the composite resin, thus causing less discoloration than tea and coffee.38 The exposure time is also important in staining composite resins. In the present study, the clinically unacceptable color change was observed after 24 h in the specimens stored in red wine, and after 15 days in those stored in tea and coffee.
The mean ΔE values of the bleached specimens decreased below the clinically acceptable threshold in this study, except for those kept in red wine. The lowest ΔE values after bleaching were observed in the VP specimens. This bleaching agent contains fewer active ingredients than the others (6% hydrogen peroxide). Since OB and OP are gel-like agents, they were easily removed from the specimen surfaces by washing. However, since VP is a highly adhesive agent, it could not be completely removed from the specimen surfaces and may have exerted a more prolonged effect than the other agents over a 14-day period. This may explain the lower ΔE values of the VP subgroups. Bleaching agents penetrate from the surfaces of the teeth and exert an oxidizing effect. When they are applied to the surfaces of composite resins, they perform only superficial cleaning and do not affect the internal coloration. This situation is manifested by the stained composite returning to its original color.39 In the present study, it was determined that color change that occurred in the specimens after staining decreased after bleaching.
Conclusions
According to the results of the present study, staining and bleaching processes may cause changes in the microhardness, roughness and color of composite resin surfaces, depending on structural properties, such as the type of composite material, its matrix structure and filler content. Although bleaching is effective in cleaning the composite surface, it cannot act in the same way as in the case of dental tissues, and bleaching agents may also affect the surface properties of composite resins. Therefore, bleaching agents should be applied carefully in order to remove staining on restored tooth surfaces. If the bleaching agent is found to degrade the surface properties of the old restoration, or if a color difference is observed between the tooth and the restoration, the old composite resin restoration should be replaced after bleaching.