Abstract
Background. In the oral cavity, restorations and teeth are subject to occlusal stresses, as well as physiological and chemical wear processes. The consumption of alcoholic and non-alcoholic beverages is popular among adolescents, and this habit often persists into adulthood, contributing to tooth erosion. The erosive potential of these beverages is influenced by various factors, including the pH, acid type, buffer capacity, adhesion, chelating effect, and phosphate or calcium or fluoride content of the drink. Several studies have confirmed that the excessive consumption of alcoholic and non-alcoholic beverages reduces the microhardness and flexural strength of composites.
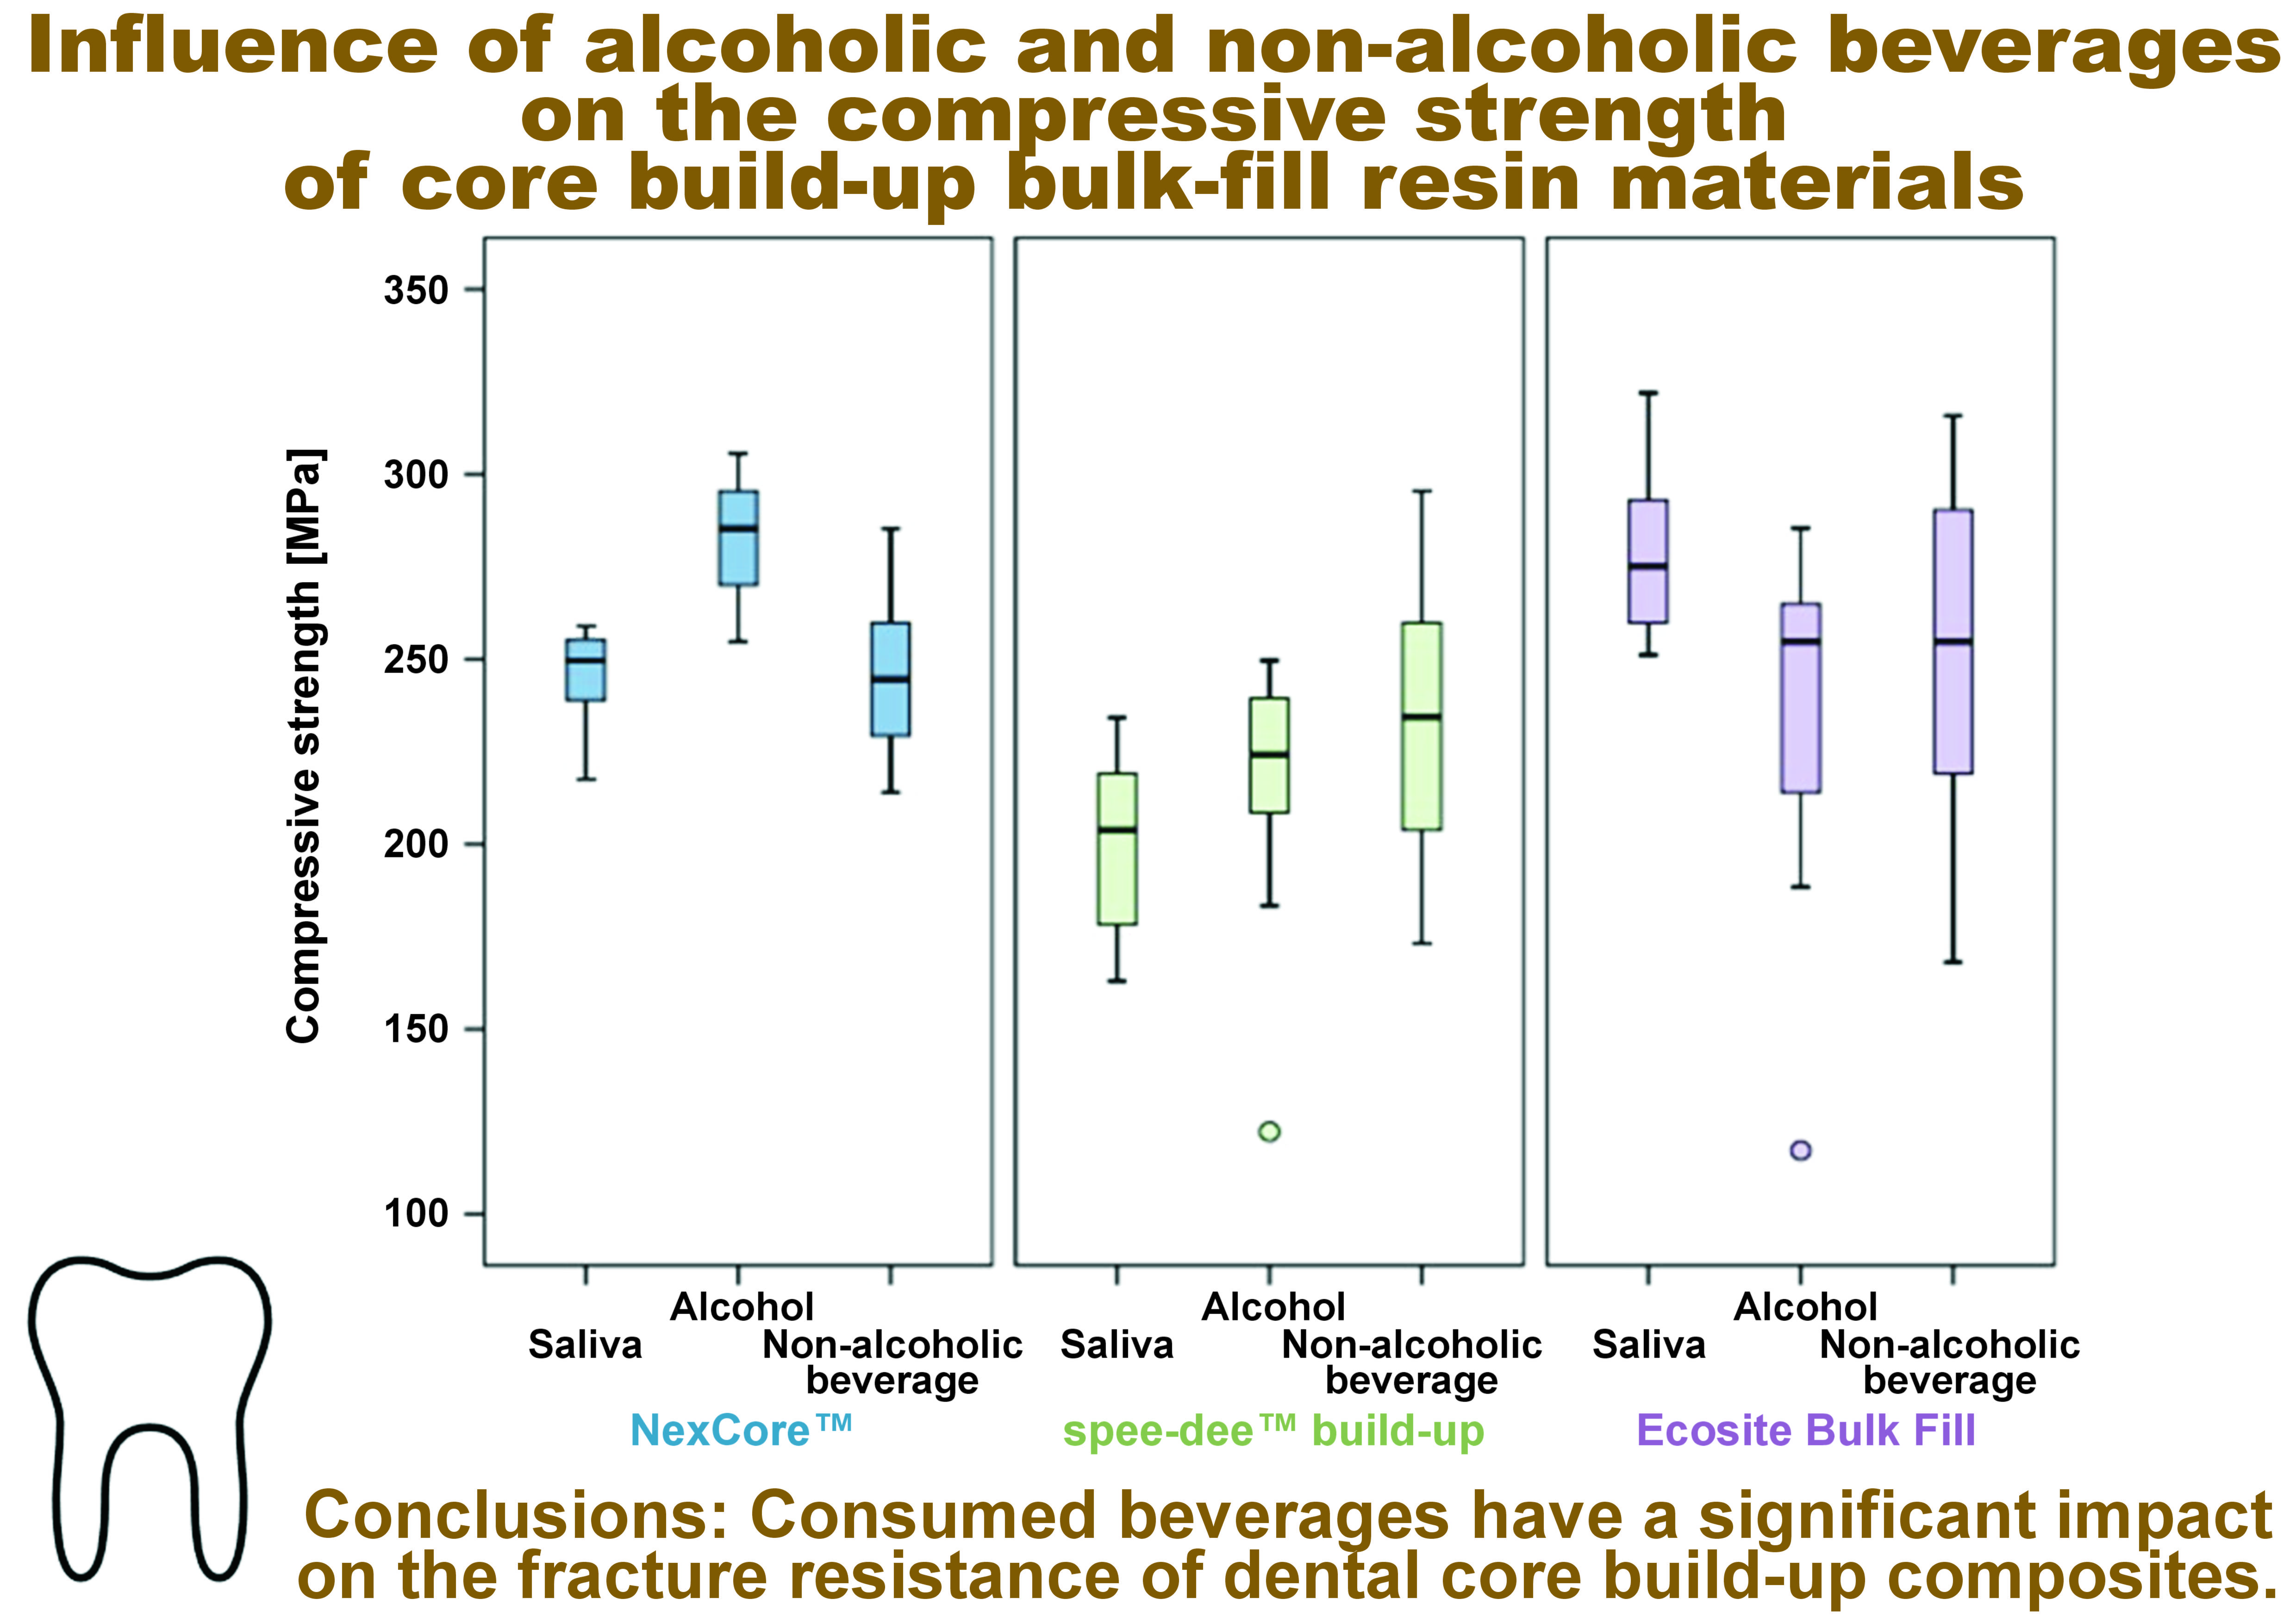
Objectives. The purpose of this study is to compare the compressive strength (CS) of 3 core build-up resin composite materials in the presence of different alcoholic and non-alcoholic beverages.
Material and methods. A total of 135 specimens (blocks measuring 5 mm × 4 mm) made from different composites (NexCore™, spee-dee™ build-up, and Ecosite Bulk Fill) were divided into 3 experimental groups (n = 45). The experimental liquids used in each group were artificial saliva, Kingfisher® beer (an alcoholic beverage) and Thums Up® (a non-alcoholic beverage), which were maintained for 24 h at 37°C. The compressive strength of the samples was measured with the use of a universal testing machine.
Results. Nexcore™ and Ecosite Bulk Fill exhibited the highest fracture resistance among the tested liquid mediums. The mean CS for NexCore™ was significantly higher after immersion in alcohol compared to saliva and non-alcoholic medium (p < 0.0001).
Conclusions. The immersion medium affects the CS of bulk-fill composites. Moreover, NexCore™ and Ecosite Bulk Fill composites exhibited substantial CS, while spee-dee™ build-up demonstrated the lowest CS among the tested media.
Keywords: compressive strength, beverages, composite
Introduction
A root canal-treated tooth with extensive loss of the coronal tooth structure is susceptible to fracture.1 A significant reduction in the remaining tooth tissue represents a major restorative challenge. It has been established that the quality of coronal restoration affects the outcome of endodontic therapy.2 According to the guidelines and treatment standards established by the American Association of Endodontists (AAE), endodontically treated teeth (ETT) should be restored with a core build-up (optionally, a root canal post) and a full crown to ensure the longevity of the tooth–restoration complex.3 Moreover, the quality of the coronal restoration is equally or more important for the outcome of endodontic treatment than the quality of the actual root canal treatment.4 Therefore, root canal treatment cannot be successful without timely and adequate definitive restoration.3, 4 However, most of the ETT undergo full coverage crown restorations, which lead to the removal of tooth structure.5, 6 The restorations should always be designed conservatively with the aim of retaining as much sound residual tooth structure as possible.
In recent years, advancements in the field of adhesive restoration and a shift toward minimally invasive access cavity preparation have led to a preference for direct or indirect bonded restorations of ETT with intact proximal walls.7 In clinical practice, direct restorations offer several advantages, including time efficiency, conservation of tooth structure, and cost efficiency compared to laboratory restoration.8
Light-cure or dual-cure composite resins are commonly used with or without posts as a restoration material for ETT. Dual-cure materials can be further categorized into those with higher viscosity (paste-like) or those more flowable.9 The composites intended to be used as a core build-up demonstrate higher levels of inorganic filler content, increased molecular weight per reactive group and reduced shrinkage.9, 10 The resin core build-up can be executed through either the conventional multi-increment fill or the bulk-fill technique. Recent advancements in bulk-fill composites have enabled incremental filling of up to 4–5 mm, exhibiting adequate polymerization.11, 12 This enhancement can be attributed to the high color translucency of the composites, which increases the depth of cure, and a more innovative initiator system, which shortens the light-curing time.13
Within the oral cavity, both restorations and teeth are subject to occlusal stresses, as well as physiological and chemical wear processes. The consumption of alcoholic and non-alcoholic beverages is popular among adolescents, and the habit often persists into adulthood, contributing to tooth erosion.14, 15 The erosive potential of these beverages is influenced by various factors, including the pH, acid type (phosphoric acid or citric acid), buffer capacity, adhesion, chelating effect, and phosphate, calcium or fluoride content of the drink.14, 15 Several studies have confirmed that the excessive consumption of alcoholic and non-alcoholic beverages reduces the microhardness and flexural strength of composites.14, 15, 16, 17, 18 A potential explanation for this phenomenon is that polymer materials absorb water, while coupling agents cause hydrolysis, resulting in the loss of chemical bonds between filler particles and the resin matrix.14, 17, 19, 20 Filler particles dislodge from the outer surface of the material, causing surface roughness and decreasing hardness. The effect on the resin matrix, the degradation of the resin–filler interface, and the inorganic fillers may also play a role in the reduction of surface hardness.17, 18, 19
Given the paucity of data on the influence of beverages on the compressive strength (CS) of core build-up materials, the authors decided to investigate this area. The aim of the study was to evaluate the CS of 3 core build-up materials after exposure to alcoholic and non-alcoholic liquids. The null hypothesis (H0) states that there is no difference in the CS of core build-up bulk-fill resin materials after immersion in alcoholic beverages compared to non-alcoholic beverages.
Material and methods
Sample preparation
The study evaluated 3 core build-up materials: NexCore™ (Meta Biomed, Cheongju-si, South Korea) (NC group), spee-dee™ build-up (PULPDENT Cooperation, Watertown, USA) (S-D group), and Ecosite Bulk Fill (DMG, Hamburg, Germany) (E group). The characteristics of the materials are presented in Table 1. In each study group (NC, S-D and E), 45 samples were prepared using cylindrical Teflon molds measuring 5 mm in diameter and 4 mm in thickness. The molds were filled with core build-up material using a composite instrument (PF21; GDC Fine Crafted Dental Pvt. Ltd., Punjab, India).
Photoactivation was performed for 20 s, in accordance with the manufacturer’s instructions, using a light-emitting diode (LED) curing unit (Bluephase; Ivoclar Vivadent, Schaan, Liechtenstein) operating in a continuous high-power mode. The light tip was positioned in contact with a glass slide placed on the top surface of the specimen. A calibrated LED radiometer (DB686 NANO; COXO Medical Instrument Co., Ltd., Foshan, China) was used to verify the light intensity output of the curing unit before each sample preparation. Next, the mold and any excess material were removed.
Storage solutions
The study groups were divided into 3 subgroups of 5 specimens each, based on the storage fluid. Within each subgroup, the samples were immersed in an experimental fluid: a saliva substitute (Wet Mouth; ICPA Health Products Ltd, Mumbai, India); Kingfisher® Strong Premium beer (United Breweries, Mangaluru, India) (an alcoholic beverage); or Thums Up® (Coca-Cola Company, Bengaluru, India) (a non-alcoholic beverage) (Table 2). Containers with specimens and solutions were secured to prevent evaporation and maintained at 37°C for 24 h.
Compressive strength calculation
Next, all samples were individually mounted on a computer control universal testing machine (Model No. 8801; Instron, Norwood, USA) with a loadcell of 5 kN (Figure 1). The data was recorded using the WaveMatrix™3 Dynamic Testing Software and Bluehill Universal® software (Instron, Norwood, USA). All samples were subjected to a compressive load at the center of the machine, at a crosshead speed of 1 mm/min, until fracture of each specimen. The load required to fracture the specimen was recorded in kN, and the CS was calculated according to the following formula (Equation 1):
where:
F – force [N], calculated as load [kN] × 103;
A – cross-sectional area [mm2], calculated as π × r2 (r – radius of the specimen) or as π × (d/2)2 (d – diameter).
Power analysis
The post hoc power analysis for the comparison of 2 distributions with the Mann–Whitney U test and analysis of variance (ANOVA) in 3 groups was conducted using the G*power v. 3.1.9.4 software.21 The power exceeded 0.90 for the various tests conducted in the study.
Statistical analysis
The data analysis was performed using the IBM SPSS Statistics for Windows software, v. 25.0 (IBM Corp., Armonk, USA). The variables obtained from the 3 fluid groups were subjected to the Shapiro–Wilk test of normality. The saliva data in the NC and S-D groups, alcohol data in the S-D and E groups and data on all liquids in the E group did not conform to a normal distribution. Hence, the comparison of distribution was conducted using the non-parametric Kruskal–Wallis and Mann–Whitney U tests. The non-alcoholic liquid data for the 3 material groups conformed to normality, enabling a comparison of mean fracture resistance. This comparison was performed using parametric ANOVA and the Bonferroni post hoc test.
Results
Compressive strength in artificial saliva
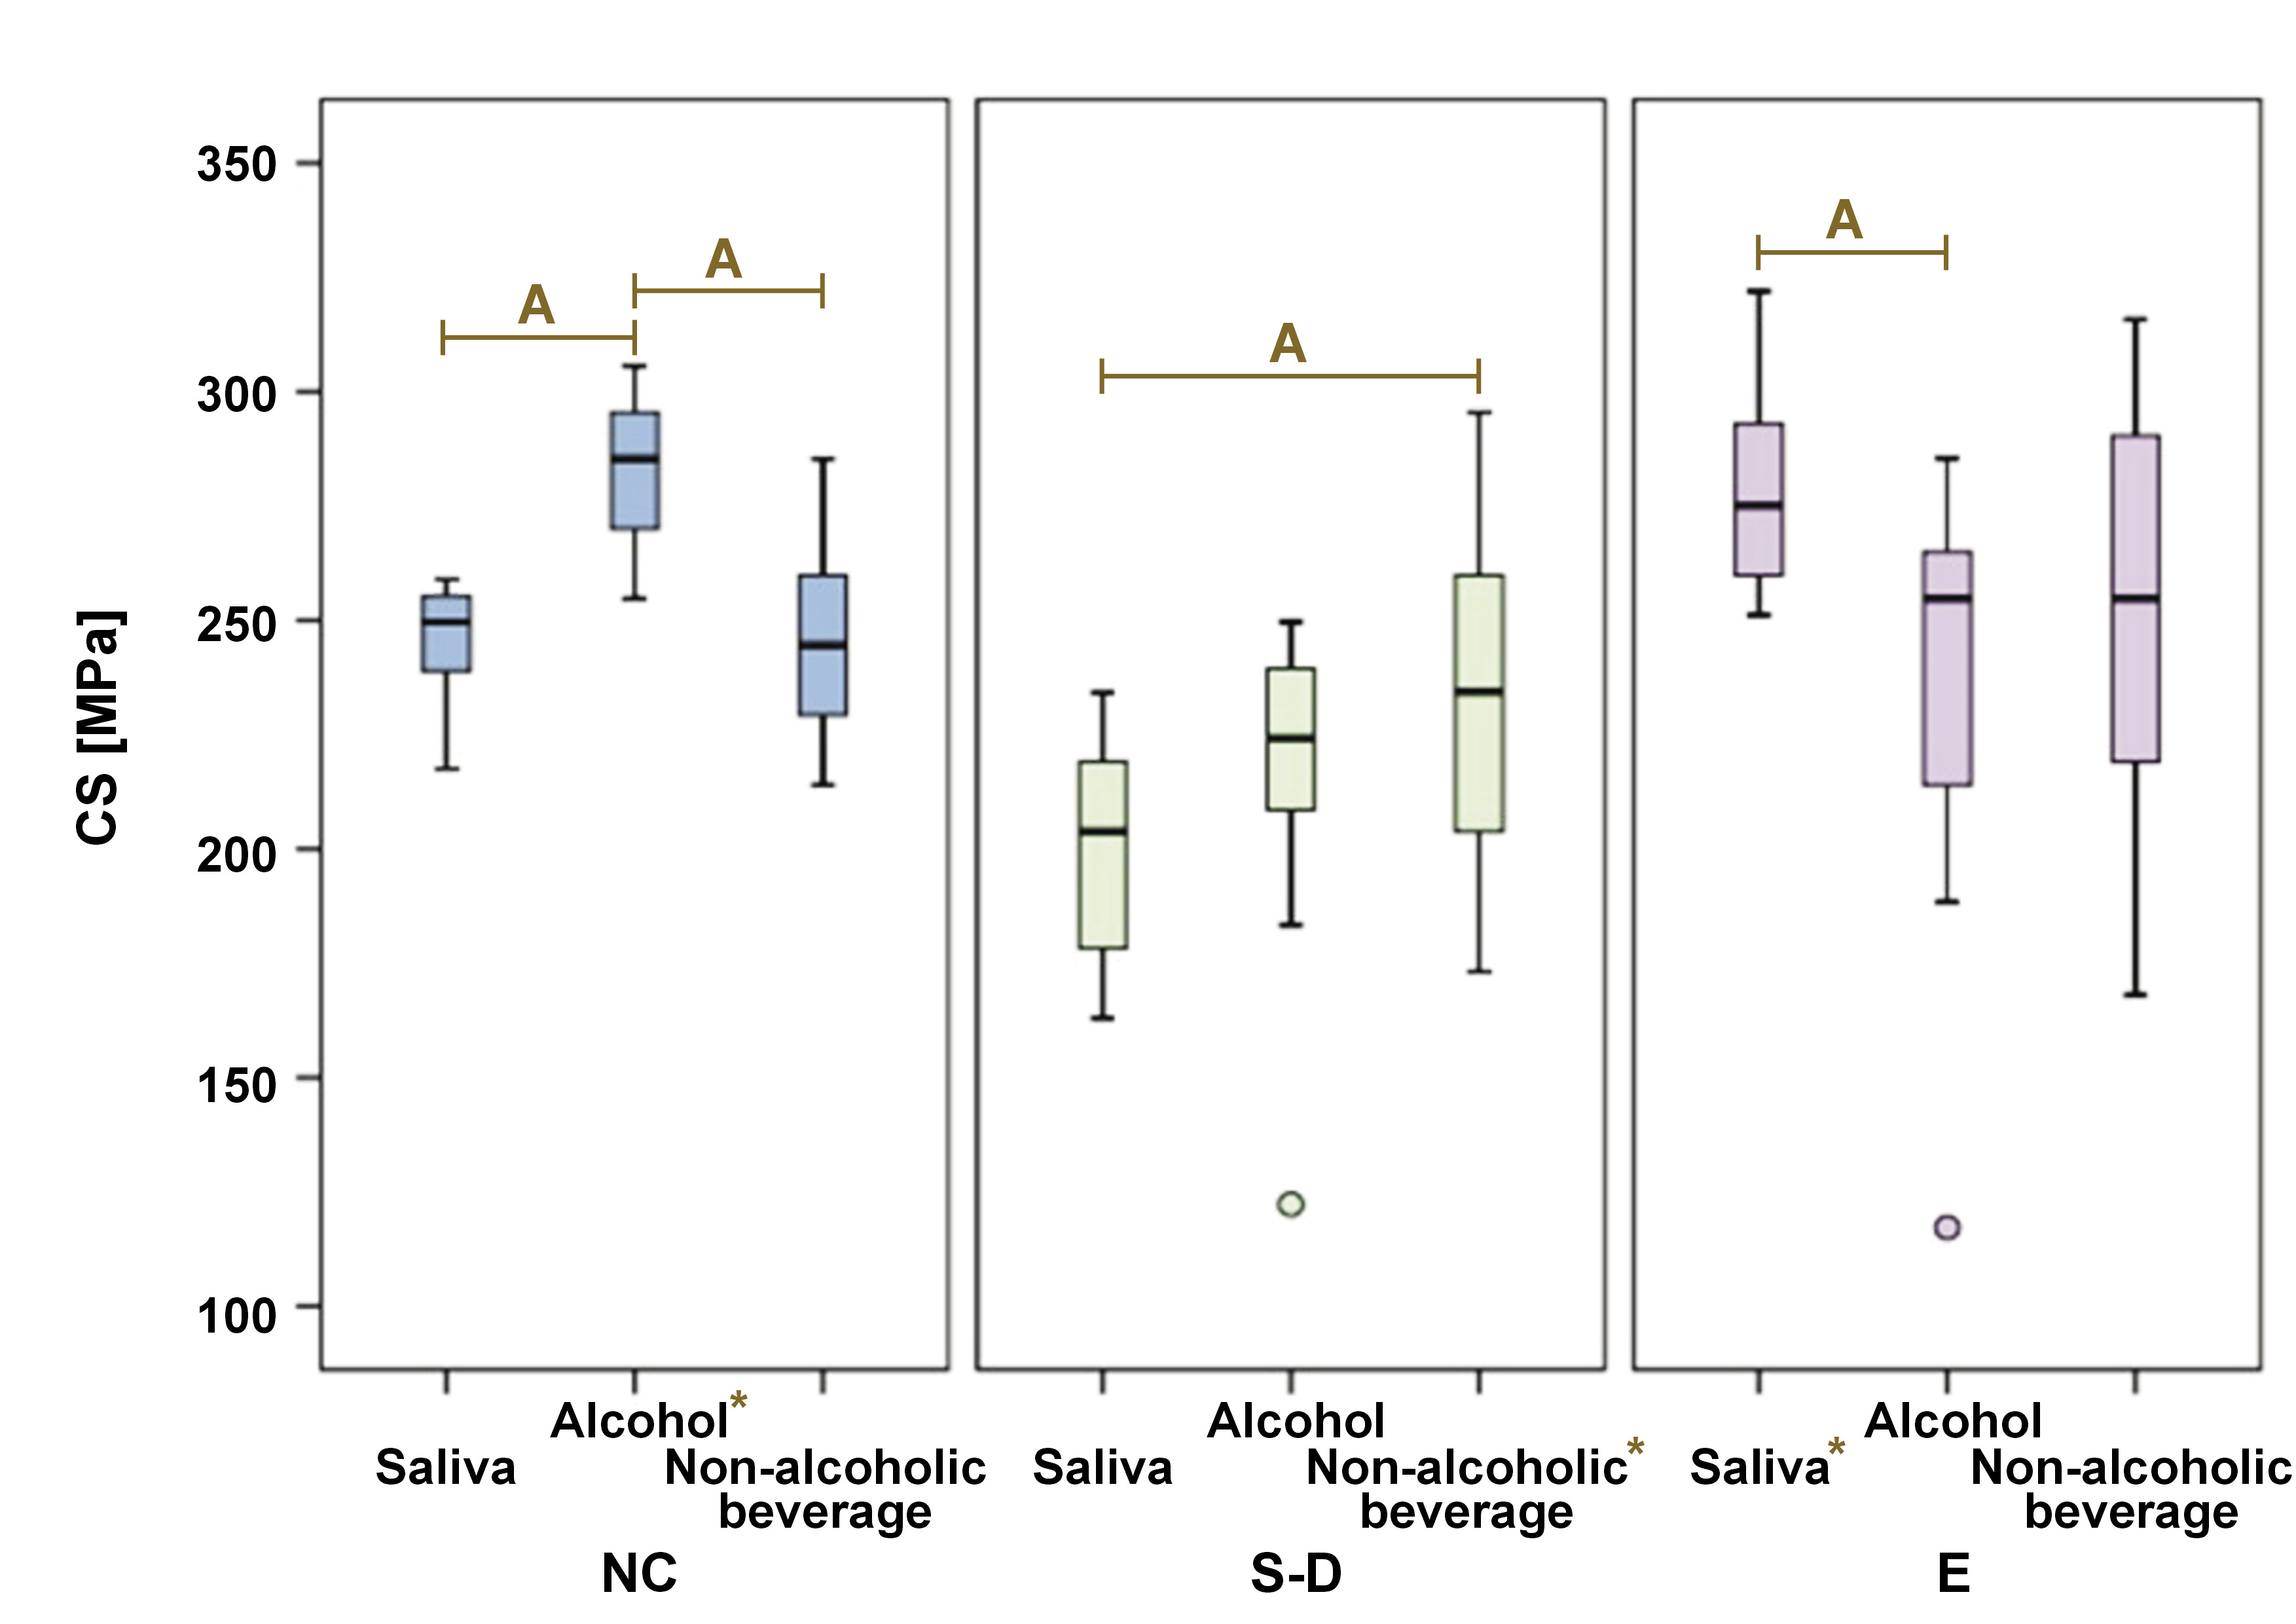
For the saliva, the CS values were the highest in the E group (median (Me) (interquartile range (IQR)): 275.1 (259.8–295.5) MPa) and the lowest in the S-D group (203.8 (163.0–219.1) MPa). The CS values for Ecosite Bulk Fill were significantly higher than those for NexCore™ and spee-dee™ build-up. The significant differences were observed in the distributions across the 3 material groups, as evidenced by a pairwise comparison (p = 0.000) (Table 3).
Compressive strength in an alcoholic liquid
For the alcoholic liquid, the highest CS values were observed in the NC group (285.3 (270.0–295.5) MPa) and the lowest values were noted in the S-D group (224.2 (198.7–239.4) MPa). In the NC group, the values were significantly higher when compared to the other groups. The significant differences were observed in the distributions across the 3 material groups, as demonstrated by the results of the pairwise comparison (p < 0.05) (Table 4).
Compressive strength in a non-alcoholic liquid
For the non-alcoholic liquid, the highest CS values were noted in the E group (254.7 (214.0–295.5) MPa) and the lowest values were observed in the S-D group (234.3 (193.6–275.1) MPa). However, the distribution of the CS across 3 materials did not show any significant differences, as evidenced by a pairwise comparison (p > 0.05) (Table 5).
Comparison of the compressive strength of composites across different subgroups
The mean CS values were compared between the liquids within each of the 3 materials (Table 6,Table 7) (Figure 2). The mean CS for the NC group was the highest for alcohol (282.2 ±17.3 MPa) and the lowest for saliva (244.2 ±14.9 MPa). These values were significantly higher after storage in alcohol than in saliva and non-alcoholic liquid (p = 0.0001).
In the S-D group, the CS was the highest for the non-alcoholic liquid (233.3 ±41.2 MPa) and the lowest for saliva (199.7 ±25.6 MPa). These values were significantly higher after exposure to the non-alcoholic liquid compared to saliva (p = 0.029).
In the E group, the CS was the highest for saliva (279.4 ±22.6 MPa) and the lowest for the alcoholic liquid (236.7 ±44.0 MPa). Compressive strength was significantly higher after storage in saliva in comparison to alcohol (p = 0.015).
Discussion
Composite resin materials are being increasingly applied in modern reconstructive dentistry. However, despite the improvement in their physical and chemical properties, the long-term clinical performance in the oral cavity remains a challenge.
The present investigation demonstrates that the type of immersing liquid affects the CS of the bulk-fill composites applied as core build-up restorations. Therefore, the null hypothesis should be rejected. These findings are consistent with those of previous studies that evaluated the physical properties of different core build-up materials when immersed in food-simulating liquids.22, 23
The duration of sample fabrication and storage were chosen based on the literature.23, 24, 25, 26, 27, 28, 29 The storage time of 12 h simulated a 1-year exposure of 2 min/day. Consequently, the calculated time equaled 2 years of clinical service.24, 30 Compressive strength is a vital parameter for the performance and longevity of core build-up materials. It influences the ability to withstand functional loads and prevent fractures, ultimately contributing to better clinical outcomes.31 Core build-ups are subject to occlusal forces due to load transfer from the crown to the supporting material during function.
A substantial body of research has indicated that the mechanical properties of resin materials deteriorated after immersion in solutions such as coffee, tea and juices.14, 15, 16, 17, 22, 23, 24, 25, 28, 30, 32, 33, 34, 35, 36, 37, 38, 39, 40, 41, 42, 43, 44, 45 However, only few studies investigated the influence of alcoholic and non-alcoholic beverages on core build-up bulk-fill materials.14, 22 None of the studies have evaluated the CS of NexCore™ and spee-dee™ build-up after storage in beverages. Additionally, in the present study, a salivary substitute was used as a control to imitate the oral cavity environment, as recommended by literature.46 Beer was chosen as one of the liquids, due to its status as the most ancient and frequently consumed alcoholic beverage in the world.41 Likewise, one of the most popular brands of soft drink was selected for the non-alcoholic beverage.43 Moreover, both Kingfisher® beer and Thums Up® are popular products.41
The current study revealed a significantly higher CS of Ecosite Bulk Fill when immersed in the salivary substitute and of NexCore™ after storage in the alcoholic fluid when compared to the other liquids tested. Spee-dee™ build-up demonstrated the lowest CS after storage in both salivary substitute and alcohol. However, in the non-alcoholic fluid, no statistically significant differences in CS were observed between the investigated materials. It is worth mentioning that the materials under investigation exhibited CS within the average range, demonstrating sufficient performance for clinical purposes.47, 48
Several studies have demonstrated that liquids have an impact on the physical and mechanical properties of composites.14, 22, 23, 25, 28, 37, 49, 50, 51, 52, 53, 54 It has been shown that composites aged in distilled water exhibit reduced microhardness and flexural strength values when compared to dry samples.17, 44, 55 The increased content of triethylene glycol dimethacrylate (TEGDMA) in the resin matrix may result in an increased water uptake due to the higher hydrophilicity of this monomer compared to bisphenol A-glycidyl methacrylate (Bis-GMA) and urethane dimethacrylate (UDMA).56 This increased hydrophilicity could be a contributing factor to the lower CS of the TEGDMA-containing composite, NexCore™. Water immersion causes hydrolytic degradation of the filler surface and erosion of resin composite by filler matrix debonding.54 Sorption, as a co-existing process, results in the swelling of the matrix and a subsequent formation of pores inside the material.54 Additionally, unbound monomers and additives may be eluted by solvents after setting. The second mechanism causing mass loss is surface erosion, which leads to the long-term release of components.43, 49 The type of inorganic filler may influence the material’s properties after immersion in water. Specifically, zinc, barium glass and zirconia/silica fillers have been found to modify the material’s properties in comparison to those containing quartz fillers.36, 52
The most frequently investigated and consumed alcoholic beverage is wine. A high risk of dental erosion has been identified in individuals with a predilection for wine.42 However, beer is the second most widely consumed alcoholic beverage worldwide.42 In the present study, it was noted that beer (7.2 vol%) reduced the CS of Ecosite Bulk Fill and spee-dee™ build-up composites. These findings are consistent with the conclusions of previous studies, which demonstrated that the presence of alcohol leads to a reduction in the physical properties of composites.14, 57, 58 Due to their low pH and ethanol content, alcoholic beverages can cause erosion and modify the properties of composites.30 The ethanol component of alcoholic beverages and the citric acid present in non-alcoholic beverages induce plasticization, increase surface roughness and solubility, and decrease flexural strength and flexural modulus.35, 54, 59, 60, 61 However, some studies have reported no changes in the surface roughness of composite materials following exposure to alcoholic and non-alcoholic liquids.35, 52 The investigators of these studies have posited that the absence of marked changes in pH over time in the stored solutions, in comparison to freshly prepared solutions, may be a contributing factor. Secondly, the filler components (zirconia or silica) of the composites used were more inert in different solutions.
Interestingly, beer was found to increase surface roughness when compared to strong alcohols.49 This phenomenon can be attributed to the higher acidity levels of beer compared to vodka. In other words, an increase in the acidic concentration of beverages corresponds to an increase in the surface roughness of composite materials.51, 62 Moreover, low pH leads to the degradation of calcium, aluminum and silicon ions present in restorative resins, consequently resulting in an increased roughness of the material. Acids penetrate the resin matrix, triggering the release of unreacted monomers into the environment.63 The increased surface roughness may result in staining of resin restoration and bacterial adherence, leading to the formation of secondary caries.
It is worth mentioning that the majority of in vitro studies focus on the erosive potential of beverages and disregard the protective properties of saliva, which are attributable to buffer substances that facilitate pH neutralization. However, it should be noted that clinical performance of composite materials, apart from erosive factors, is influenced by occlusal forces, endogenic acids, eating disorders, diet and hygienic habits, smoking, and the use of drugs.64
Additionally, NexCore™, after immersion in beer, exhibited statistically higher CS than other study groups. NexCore™ core build-up contains a filler matrix composed of barium glass, ytterbium (III) fluoride and pyrogenic silicic acid, and a resin matrix of Bis-GMA with TEGDM.65 The alcoholic liquid increases the ductility of composites by acting as a plasticizer of the polymeric matrix.59 Moreover, ethanol can contribute to the reduction in the bond between the resin matrix and inorganic fillers, causing a decrease in mechanical properties.38
All investigated bulk-fill composites exhibited comparable CS after immersion in non-alcoholic beverage (Thums Up®). A potential explanation for this phenomenon is that the major component of this beverage is citric acid (pH = 2.5). However, this component did not cause significant changes in the flexural strength of both silorane- and methacrylate-based composites.19, 66 In other studies, citric acid immersion resulted in a significant reduction in flexural strength and hardness, and an increased roughness of methacrylate-based materials.26, 53 The reduced values of these parameters could be attributed to the high acidic and low fluoride and calcium levels of Thums Up® cola drink, which exerts a softening effect on Bis-GMA.45, 66 Bis-GMA constitutes the main resin matrix component of NexCore™ and Ecosite Bulk Fill. These findings align with those reported in previous studies.14, 37
In the present study, a significantly higher CS of the dual-cure core build-up material (spee-dee™ build-up) was observed after immersion in the non-alcoholic beverage compared to artificial saliva. According to the literature, the consumption of non-alcoholic beverages (i.e., Coca Cola) may increase surface roughness and decrease microhardness of microhybrid and hybrid resin composites.18, 37, 55
Spee-dee™ build-up exhibited the lowest CS in all liquids. It is a hydrophilic material based on the Embrace monomer that is believed to be more hydrophilic than UDMA- or Bis-GMA-based composites.19 Moreover, the low CS value may be due to high water sorption of spee-dee™ build-up when compared to other composites.66
The tested composite materials differ in terms of their filler content and size. In the present study, NexCore™ and Ecosite Bulk Fill had higher filler content (75 wt% and 82 wt%) than spee-dee™ build-up (54.5 wt%). Filler loading affects the flexural strength, modulus of elasticity, fracture toughness, microhardness, and surface roughness of composites.56 Increasing the filler load beyond 55% results in the crack browning effect, when crack branching occurs or the matrix around the filler plastically deforms. This could explain why both NexCore™ and Ecosite Bulk Fill have higher CS than spee-dee™ build-up.
Limitations
There are some limitations of the study that should be acknowledged. First, the study design did not fully replicate the multifactorial oral environment (saliva flow, different types of saliva composition released by glands, plaque, temperature changes, and occlusal load). Artificial saliva lacks the full range of proteins and enzymes present in natural saliva. Therefore, it does not provide antibacterial properties and buffering capacity. Moreover, the utilization of composites and beverages was restricted, and the study did not evaluate the tooth–restoration complex samples. Another limitation is the non-normal distribution, which is attributable to the relatively small sample size. It is therefore recommended that the sample size be increased in future studies. Another aspect that affects the normality of distribution are outliers, which mainly influence the average.67 The results of the present in vitro research cannot be extrapolated to clinical conditions. Therefore, further studies should be carried out to evaluate other types of beverages and their influence on various resin composites. Additionally, pH cycling simulation, microhardness, three-point bending, and diametral tensile strength testing of bulk-fill composites should be carried out. Furthermore, a comprehensive evaluation of the tooth–restoration complex and interface is imperative to ascertain their quality and longevity. Subsequent studies should also incorporate the complexity of oral cavity conditions to fully investigate the influence of beverages on the tooth–restoration complex in clinical settings.
Conclusions
The immersion medium affects the CS of bulk-fill composites. Moreover, NexCore™ and Ecosite Bulk Fill exhibited significant CS, while the CS for spee-dee™ build-up was the lowest after storage in the tested liquids.
Ethics approval and consent to participate
Not applicable.
Data availability
The datasets generated and/or analyzed during the current study are available from the corresponding author on reasonable request.
Consent for publication
Not applicable.
Use of AI and AI-assisted technologies
Not applicable.