Abstract
Background. Poor oral health is correlated with participation in various sports and has a significant impact on athletes’ quality of life (QoL).
Objectives. The aim of the present study was to evaluate oral health and selected salivary parameters in young athletes in relation to the environment of the performed sport.
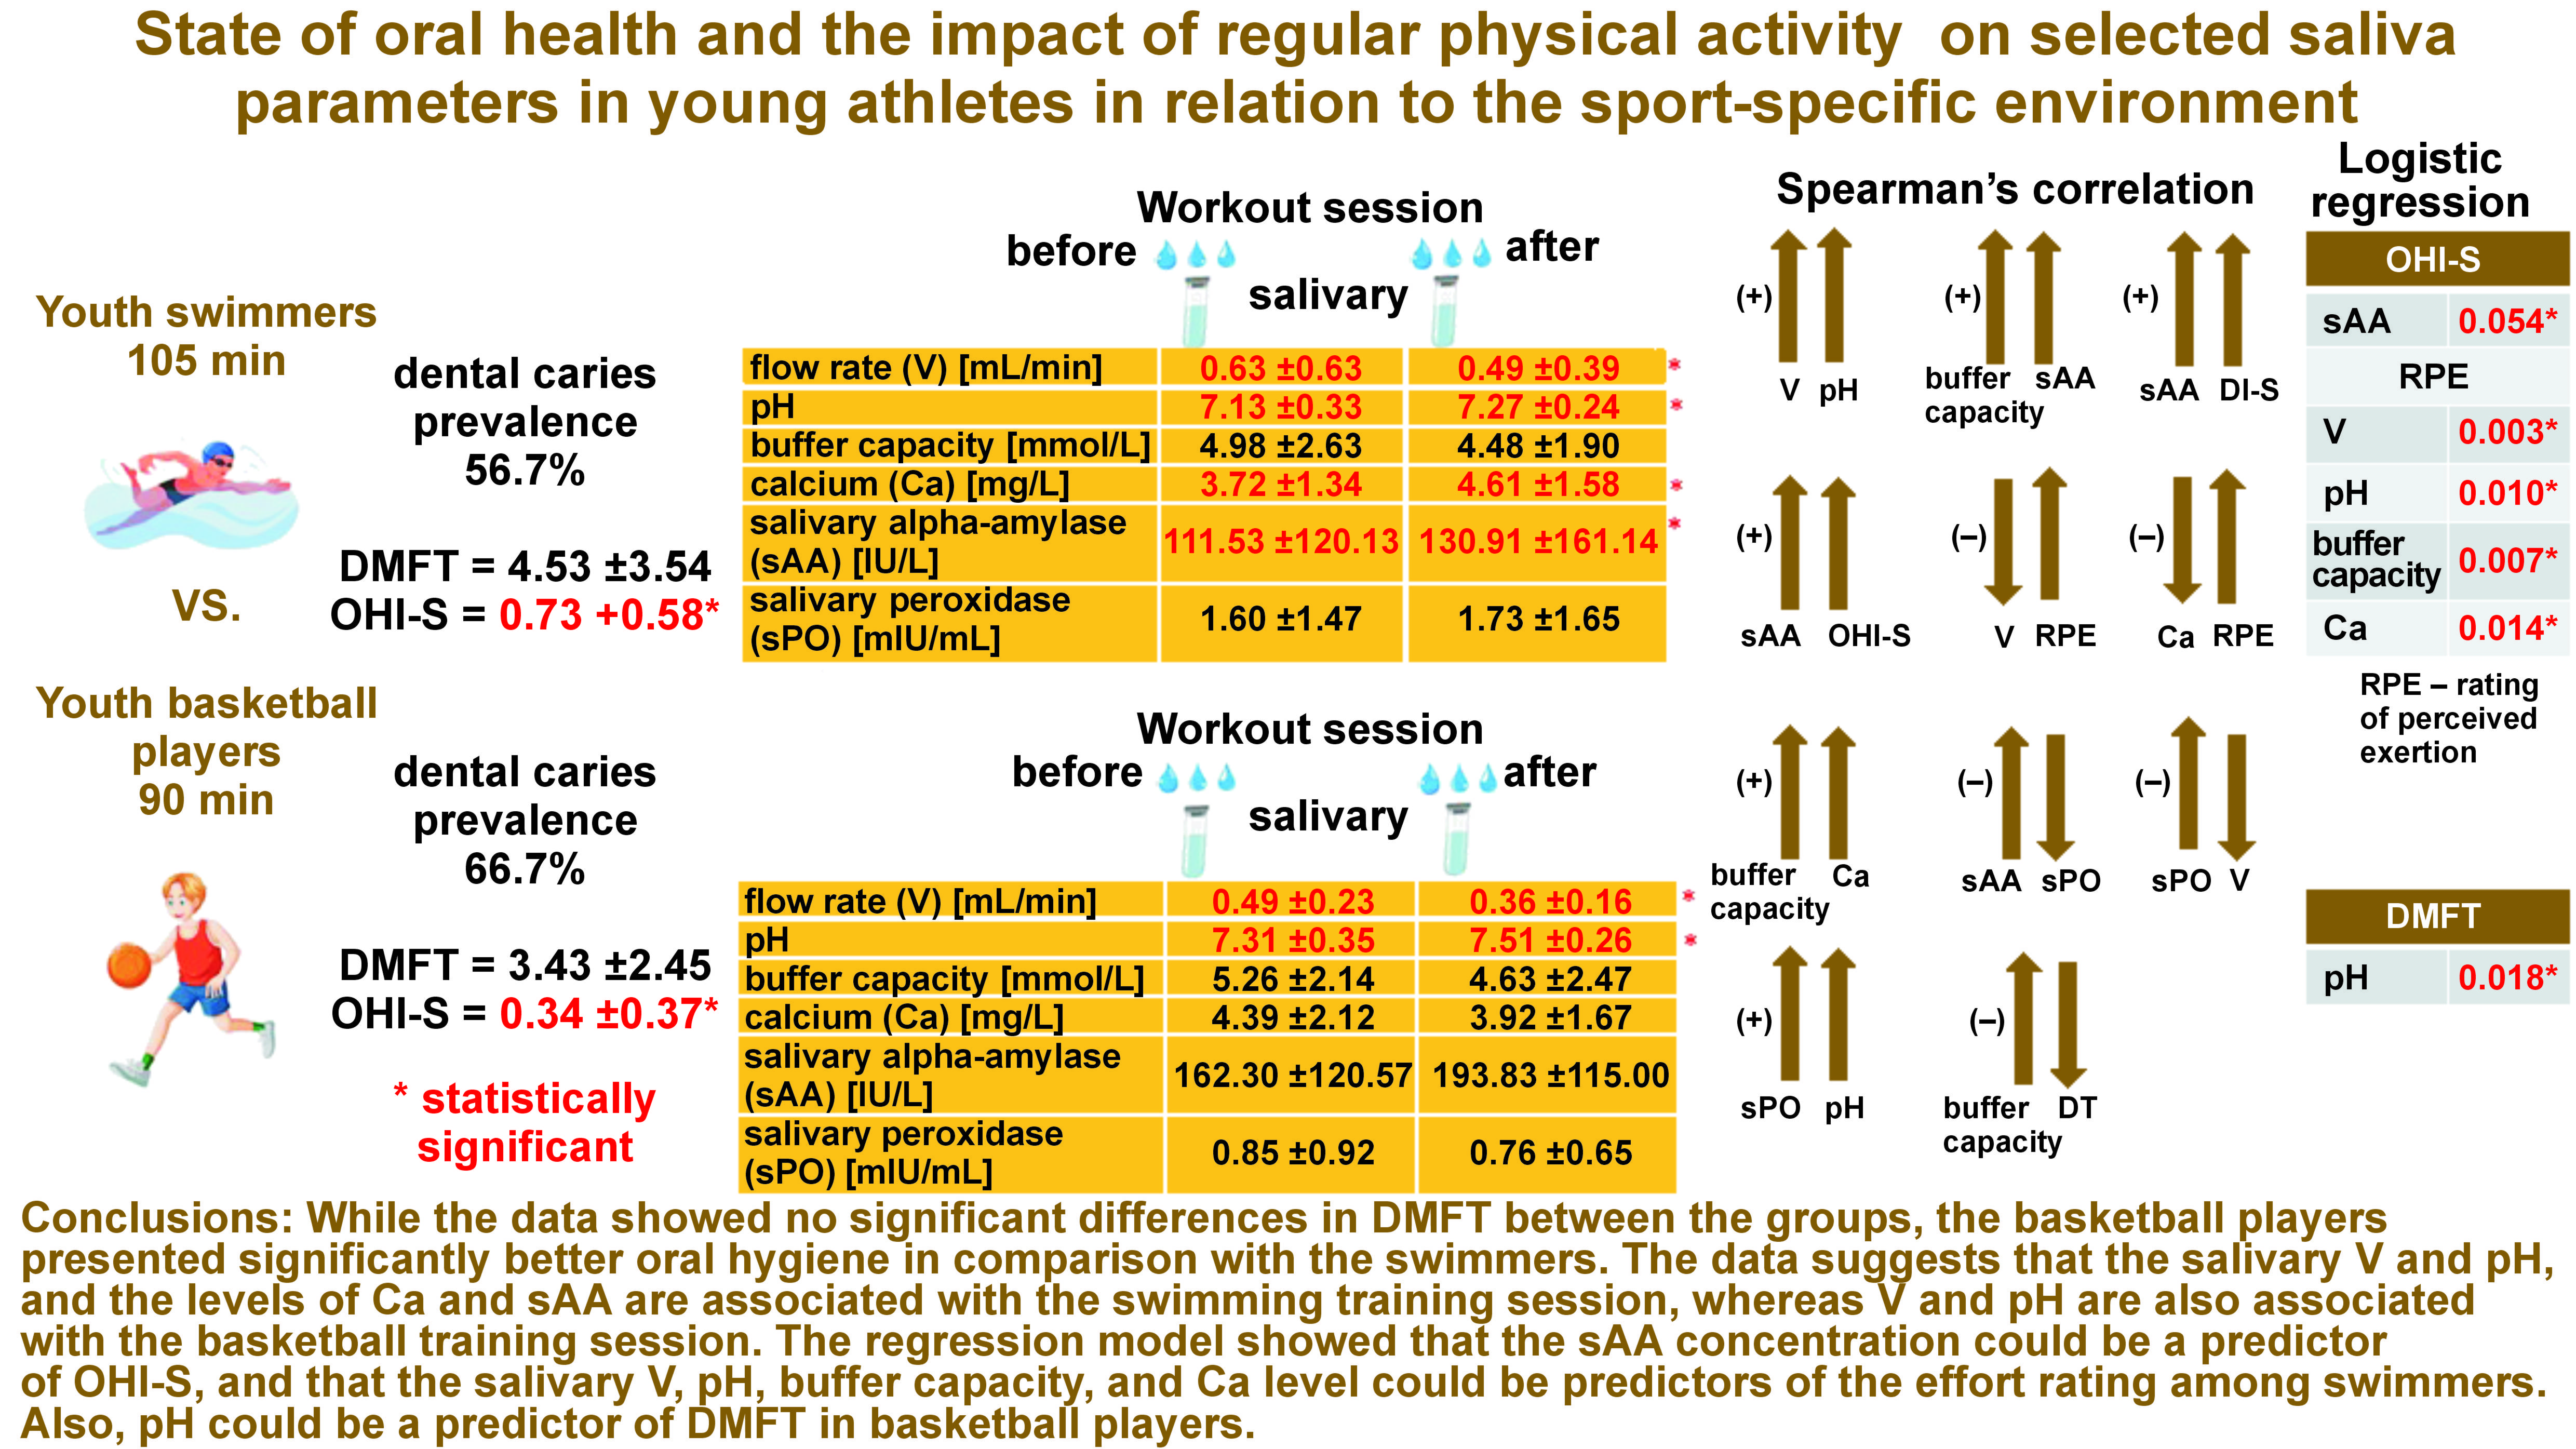
Material and methods. Sixty adolescents aged 12–15 years (mean age: 13.0 ±0.5 years), including 30 competitive swimmers and 30 competitive basketball players, participated in the study. The following indices were calculated: the number of teeth affected by caries – decayed, missing and filled teeth (DMFT); and the simplified oral hygiene index (OHI-S). Saliva samples were collected from all subjects before and after the training. The saliva flow rate (V), pH, buffer capacity, and calcium (Ca) level, as well as salivary alpha-amylase (sAA) and salivary peroxidase (sPO) concentrations, were measured. In addition, the athletes rated the intensity of the training session using Foster’s rating of perceived exertion (RPE) 0–10 scale.
Results. The mean DMFT score was 4.53 ±3.54 in the swimmers and 3.43 ±2.45 in the basketball players. The mean OHI-S score in the swimmers was 0.73 ±0.58, which was significantly higher than in the case of the basketball players (0.34 ±0.37). Some fluctuations in the salivary parameters were noticed in the swimmers vs. the basketball players, which was related to the type of training. When comparing the swimmers with the basketball players after the training, a significantly lower Ca level was observed in the latter group. However, when comparing post-training changes in the salivary parameters with regard to the pre-training values, significant decreases in V and increases in pH were observed in both groups. After the training, significant increases in the Ca level and the sAA concentration were found in the swimmers. The average RPE score was 4.96 ±2.16 in the swimmers vs. 5.13 ±2.02 in the basketball players. Most swimmers perceived the training as ‘somewhat hard’ or ‘hard’, and so did the basketball players.
Conclusions. While the data showed no significant differences in DMFT between the groups, the basketball players presented significantly better oral hygiene in comparison with the swimmers. The data suggests that the salivary V and pH, and the levels of Ca and sAA are associated with the swimming training session, whereas V and pH are also associated with the basketball training session. The regression model showed that the sAA concentration could be a predictor of OHl-S, and that the salivary V, pH, buffer capacity, and Ca level could be predictors of the effort rating among swimmers. Also, pH could be a predictor of DMFT in basketball players.
Keywords: saliva, youth athletes, rating of perceived exertion, DMFT, OHI-S
Introduction
Oral health is now recognized as one of the main factors directly influencing overall health, which subsequently determines the person’s quality of life (QoL) through well-being and physical fitness.1
The oral cavity is considered the primary site of inflammatory outbreaks. Studies have shown that 80% of the seeding sources of pathogenic microorganisms are located in the head area, and of these, more than 90% involve the oral cavity.2 Oral pathologies, such as dental caries disease and periodontal disease, among others, are correlated with the practice of various sports and have a significant impact on athletes’ QoL. Athletes should, therefore, pay more attention to their oral health in order to improve performance.3 According to the World Health Organization (WHO), dental caries is defined as a pathological process of localized external origin, leading to the decalcification of enamel and dentin, the breakdown of the hard tissues of the tooth, and subsequent cavity formation.4 It is considered one of the most common global health problems.5 It is assumed that dental caries is due to the imbalance between the alternating demineralization and remineralization processes at the enamel–dental plaque–saliva interface.
Caries develops as a result of the accumulation of plaque on the tooth surface. The bacteria in the plaque metabolize the carbohydrates supplied by the diet into acids, leading to the lowering of pH in the mouth and the plaque, and consequently to the demineralization of the tooth tissues. Bacteria that cause tooth decay are mainly Streptococcus mutans, Streptococcus sobrinus and lactic acid bacilli. Individuals with poor oral hygiene show higher rates of caries.6
Athletes themselves often have a dismissive attitude toward oral health.7 Obsessive calorie counting to maintain weight as a goal to achieve better and better performance in sports leads to eating disorders that are often hidden in the sports community and are difficult to diagnose.8
One of the main factors playing a very important role in keeping the oral microflora in balance is saliva.9 The constant flow of saliva removes food debris and microorganisms from the oral cavity. The buffering effect (acid neutralization) maintains the proper acid–base balance through the regulation of pH. Depending on oral hygiene habits, dietary habits and the buffering action of saliva, the pH values vary from 5.7 to 6.2 at rest and 8.0 as a result of stimulation.3 When pH falls below the critical value of 5.5, the superficial demineralization of the tooth tissues occurs. The remineralization capacity of the hard dental tissues is linked with the content of calcium (Ca), phosphate and fluoride ions in saliva, among other things.10, 11 At pH = 5.5, saliva is a saturated solution of these ions. Apart from the aforementioned salivary parameters, also salivary alpha-amylase (sAA) and salivary peroxidase (sPO) have a protective effect on oral health.
Salivary alpha-amylase is the predominant enzyme found in saliva, and also in plaque. It is one of the proteins that can bind to several oral bacterial species, thus inhibiting their adhesion to various surfaces in the mouth. The enzyme is responsible for breaking down the ingested starch and glycogen into maltose.9, 12 Furthermore, sAA is used as a psychophysiological stress marker during endurance exercise in various sports.13 The sAA levels increase in response to stress-related activities. This reaction is triggered by the elevated levels of catecholamines (norepinephrine and adrenaline), which are released into the bloodstream under stress conditions.14
Salivary peroxidase, on the other hand, has a beneficial effect on the oral microflora. It participates in the antimicrobial protection of all surfaces in the oral cavity. It has a bacteriostatic, and even bactericidal effect on carious bacteria.12, 15
Numerous studies have documented that exercise significantly affects the saliva secretion and composition.12, 16, 17, 18 The reduction in the saliva secretion during intensive exercise is explained by an increase in the sympathetic innervation activity, which causes the constriction of the vessels supplying blood to the salivary glands, as well as an increase in the level of vasopressin (an antidiuretic hormone) and, consequently, a lower salivary volume.19, 20 What cannot be overlooked is the effect of dehiscence, defined as the disruption of the continuity of the oral mucosal tissue, and mouth breathing during exercise. These factors can lead to saliva evaporation and hyperventilation.20, 21
Basketball players are known to experience greater dehydration of the body as compared to swimmers, which also affects the volume and composition of saliva, and may translate into oral health and the occurrence of dental caries in particular.
Saliva analysis has been shown to have some medical and practical advantages. From a medical point of view, saliva collection is a non-invasive method with a reduced risk of possible infections as compared to other methods, such as blood analysis.22, 23 From a practical point of view, in comparison with invasive methods, a generally lower cost and athletes’ tolerance are among the advantages of using saliva markers, which may be particularly applicable in the assessment of a cohort of young athletes.22
Saliva used as a diagnostic tool, and particularly determining its secretion rate, buffer capacity, pH value, and the growth of carious bacteria, is applied in caries risk assessment.3, 5, 24 Saliva can also serve as an alternative diagnostic material to monitor the response of the body to the physical exertion associated with sports activities.25
Monitoring the body’s response to different types of exercise is significant in modifying the performance of exercisers while preventing undesirable situations, such as fatigue and overtraining.26 Monitoring the training load during daily sessions with the use of common physiological measurements, such as the heart rate, the blood lactate concentration or the oxygen uptake, is challenging. Alternatively, non-invasive biochemical measures to assess exercise intensity may include salivary cortisol, total protein and sAA.3, 27
However, the simplest form of assessing exercise intensity is the reporting of the perceived exertion. The exerciser expresses their subjective, post-training sensations of discomfort and fatigue.28 Several methods have been developed for the subjective assessment of effort. Foster et al. proposed a modified Borg scale based on a 10-point rating of perceived exertion (RPE), which comprises both the intensity and duration of the training, allowing the determination of the training load of the so-called session-RPE.29 This scale has been used in the assessment of young athletes’ training.18, 30, 31
A number of studies on the monitoring of salivary biomarkers in the athletes of team sports, such as basketball, volleyball and soccer, and individual sports, such as running and swimming in a specific aquatic environment, are available.17, 18, 32, 33, 34, 35, 36 However, an area that still requires more investigation are the younger age categories. In the context of the popularity of sports such as swimming and basketball among young athletes, it is important to understand what load is placed on the athletes’ bodies during individual training sessions. The swimming training is characterized by the endurance nature of the effort undertaken in a specific aquatic environment and based on the predominant aerobic metabolism.37, 38 Basketball, on the other hand, is a contact sport characterized by variable intensity and high dynamics of the undertaken technical and tactical actions, with performance depending on physical aptitude (i.e., power, speed, agility, and endurance).39 It is a team sport, and thus psychological (mood, motivation) and social factors (relationships, team microclimate) influence the level of performance.40 Differences in the specific conditioning and physical demands of swimming and basketball suggest that the training sessions may induce different internal stresses in exercisers, which can be understood as subjective responses and objective changes in the salivary biomarker concentrations.
A number of studies have found that playing competitive sports reduces the risk of cardiovascular disease and diabetes, helps control body weight, enhances physical fitness and joint mobility, and improves sleep quality.41 According to the few published papers, poor oral health can negatively affect overall athletic performance and the training itself.42, 43, 44, 45 However, according to the World Dental Federation (FDI) guidelines, a healthy mouth is an important factor in helping athletes perform at their best.46
Despite a growing body of research on the effect of exercise on biochemical changes in saliva, little information is available on the oral health of adolescents in competitive sports.
The aim of the present study was to evaluate the dental and oral hygiene status, and the effect of physical activity on selected salivary parameters, depending on the environment of the sports practiced.
Material and methods
The study protocol was approved by the Bioethics Committee of Wroclaw Medical University, Poland (approval No. KB-327/2009). All examinations were conducted in accordance with the relevant guidelines and regulations, and all the recruited participants provided written informed parental consent.
The study included 60 adolescents aged 12–15 years (mean age: 13.0 ±0.5 years), half of whom (n = 30) were competitive swimmers (23 males and 7 females) and the other half (n = 30) trained in basketball (30 males). This study was a quasi-experiment. The inclusion criteria comprised swimmers and basketball players recruited from 2 sports championshipclubs in swimming and basketball operating in the city. All subjects had to provide their parents’ or legal guardians’ written consent to be able to participate in the study. They had to be willing to submit to the collection of a saliva sample and answer the questionnaire. Those who did not meet the inclusion criteria were excluded from the study.
Both the swimming and basketball training was held 5 days a week, Monday through Friday. The subjects had trained for 2–5 years. The test was conducted at the same time of day in both study groups. The test was conducted on Tuesday. It referred to one training session. Each athlete was tested once. The study was based on a questionnaire containing questions about the diet, eating and circadian habits, the RPE questionnaire regarding the subjective evaluation of the perceived exertion after one training session, and laboratory tests of the saliva collected before and after the training session, conducted by a pediatric dentist with 24 years of professional experience.
Each swimming training session lasted 105 min in the afternoon (from 4:00 to 5:45 p.m.). The swimming workout session consisted of swimming a distance of 5,000 m. Each routine 90-minute basketball training session included a 15-minute warm-up, 60 min of physical, technical and tactical exercises, and 15 min of game play. The training sessions were held at an indoor basketball court in the afternoon (from 4:00 to 5:30 p.m.). Prior to the training, each subject was instructed to refrain from drinking during the training session, and underwent a clinical examination with a standard mirror and a probe under artificial lighting. The examination included the assessment of the condition of the tooth tissues in terms of caries disease, and the evaluation of oral hygiene in terms of plaque and calculus.
The condition of the teeth was assessed according to the WHO criteria based on the number of decayed (DT), missing (MT) and filled teeth (FT); the DMFT index was calculated for each subject and the prevalence of caries in both groups was established. The oral hygiene status was assessed using the simplified oral hygiene index (OHI-S) for plaque/debris (DI-S) and calculus (CI-S) separately. The presence of dental deposits on the buccal surfaces of teeth 16, 11, 26, and 31, and on the lingual surfaces of teeth 36 and 46 was evaluated.
The evaluation of the presence of dental deposits was carried out using a dental probe. The assessment of the presence of plaque and calculus was based on a scale from 0 to 3, where 0 means no plaque and no calculus, 1 – plaque or supragingival calculus covering less than ⅓ of the tooth surface, 2 – plaque or supragingival calculus covering less than ⅔ of the tooth surface, or the presence of single points of subgingival calculus, and 3 – plaque or supragingival calculus covering more than ⅔ of the tooth surface, or a thick band of subgingival calculus around the tooth neck. The values for each indicator (DI-S and CI-S) were obtained separately by summing up the scores for each tooth surface and dividing the total score by the number of examined surfaces. To obtain OHI-S, the DI-S and CI-S values were added.
Salivary sample collection and the studied parameters
All unstimulated mixed saliva samples were collected from the swimmers and basketball players only once in the afternoon, before and after the swimming and basketball training session. All subjects were asked to rinse their mouths with water before saliva collection. The total number of saliva samples was 120. During sampling, the subjects sat with their heads bowed and mouths open. Saliva was collected with a plastic pipette and put into a graduated tube placed on crushed ice. The saliva flow rate (V) was calculated in mL/min, through measuring the volume of the collected sample and the time required for its collection. The samples were centrifuged at 3,500 rpm for 10 min before biochemical tests were performed. The following salivary parameters were evaluated through laboratory tests: pH; buffer capacity in mmol/L (the potentiometric method); the Ca level in mg/L (the method based on the formation of a chromogenic complex between the Ca ions and o-Cresolphthaelin – a commercial kit; Alpha Diagnostics, Warsaw, Poland); sAA in IU/L (Caraway’s colorimetric method – commercial kit; Alpha Diagnostics); and sPO in mIU/mL (the Nbs-SCN method).47
In addition, training intensity was self-assessed by the swimmers and basketball players using Foster’s scale – a modified Borg CR-10 scale, which is a category-ratio RPE scale. It relates the athlete’s perception of effort to a numerical score (from 0 – rest to 10 – maximal).28
Foster’s RPE scale was used about 30 min after the training session to assess the internal load of the entire training session. The training load was dichotomously categorized as light (scores 0–4) or high (scores 5–10).
Statistical analysis
Depending on the type of variable distribution, either Student’s t test or the Mann–Whitney U test was used for the analysis of independent variables. For dependent variables, either repeated measures Student’s t test or non-parametric repeated measures Wilcoxon’s test was conducted.
Spearman’s correlation coefficient (ρ) was calculated with regard to the RPE scores and changes in the salivary parameters before and after the training session. Similarly, the correlations between the DMFT scores, as well as the OHI-S scores, and changes in the salivary parameters before and after the training session were examined.
A logistic regression analysis was performed to determine the salivary parameters which had an influence on the dental and oral hygiene status.
Bivariate logistic regression analyses were carried out for the swimmers and the basketball players, for both independent (the salivary parameters) and dependent variables (DMFT and OHI-S, and light or high training load according to Foster’s RPE scale).
The level of significance was set at p < 0.05. All analyses were performed with the use of the Statistica software package, v. 13.3 (StatSoft, Inc., Tulsa, USA).
Results
DMFT and caries prevalence
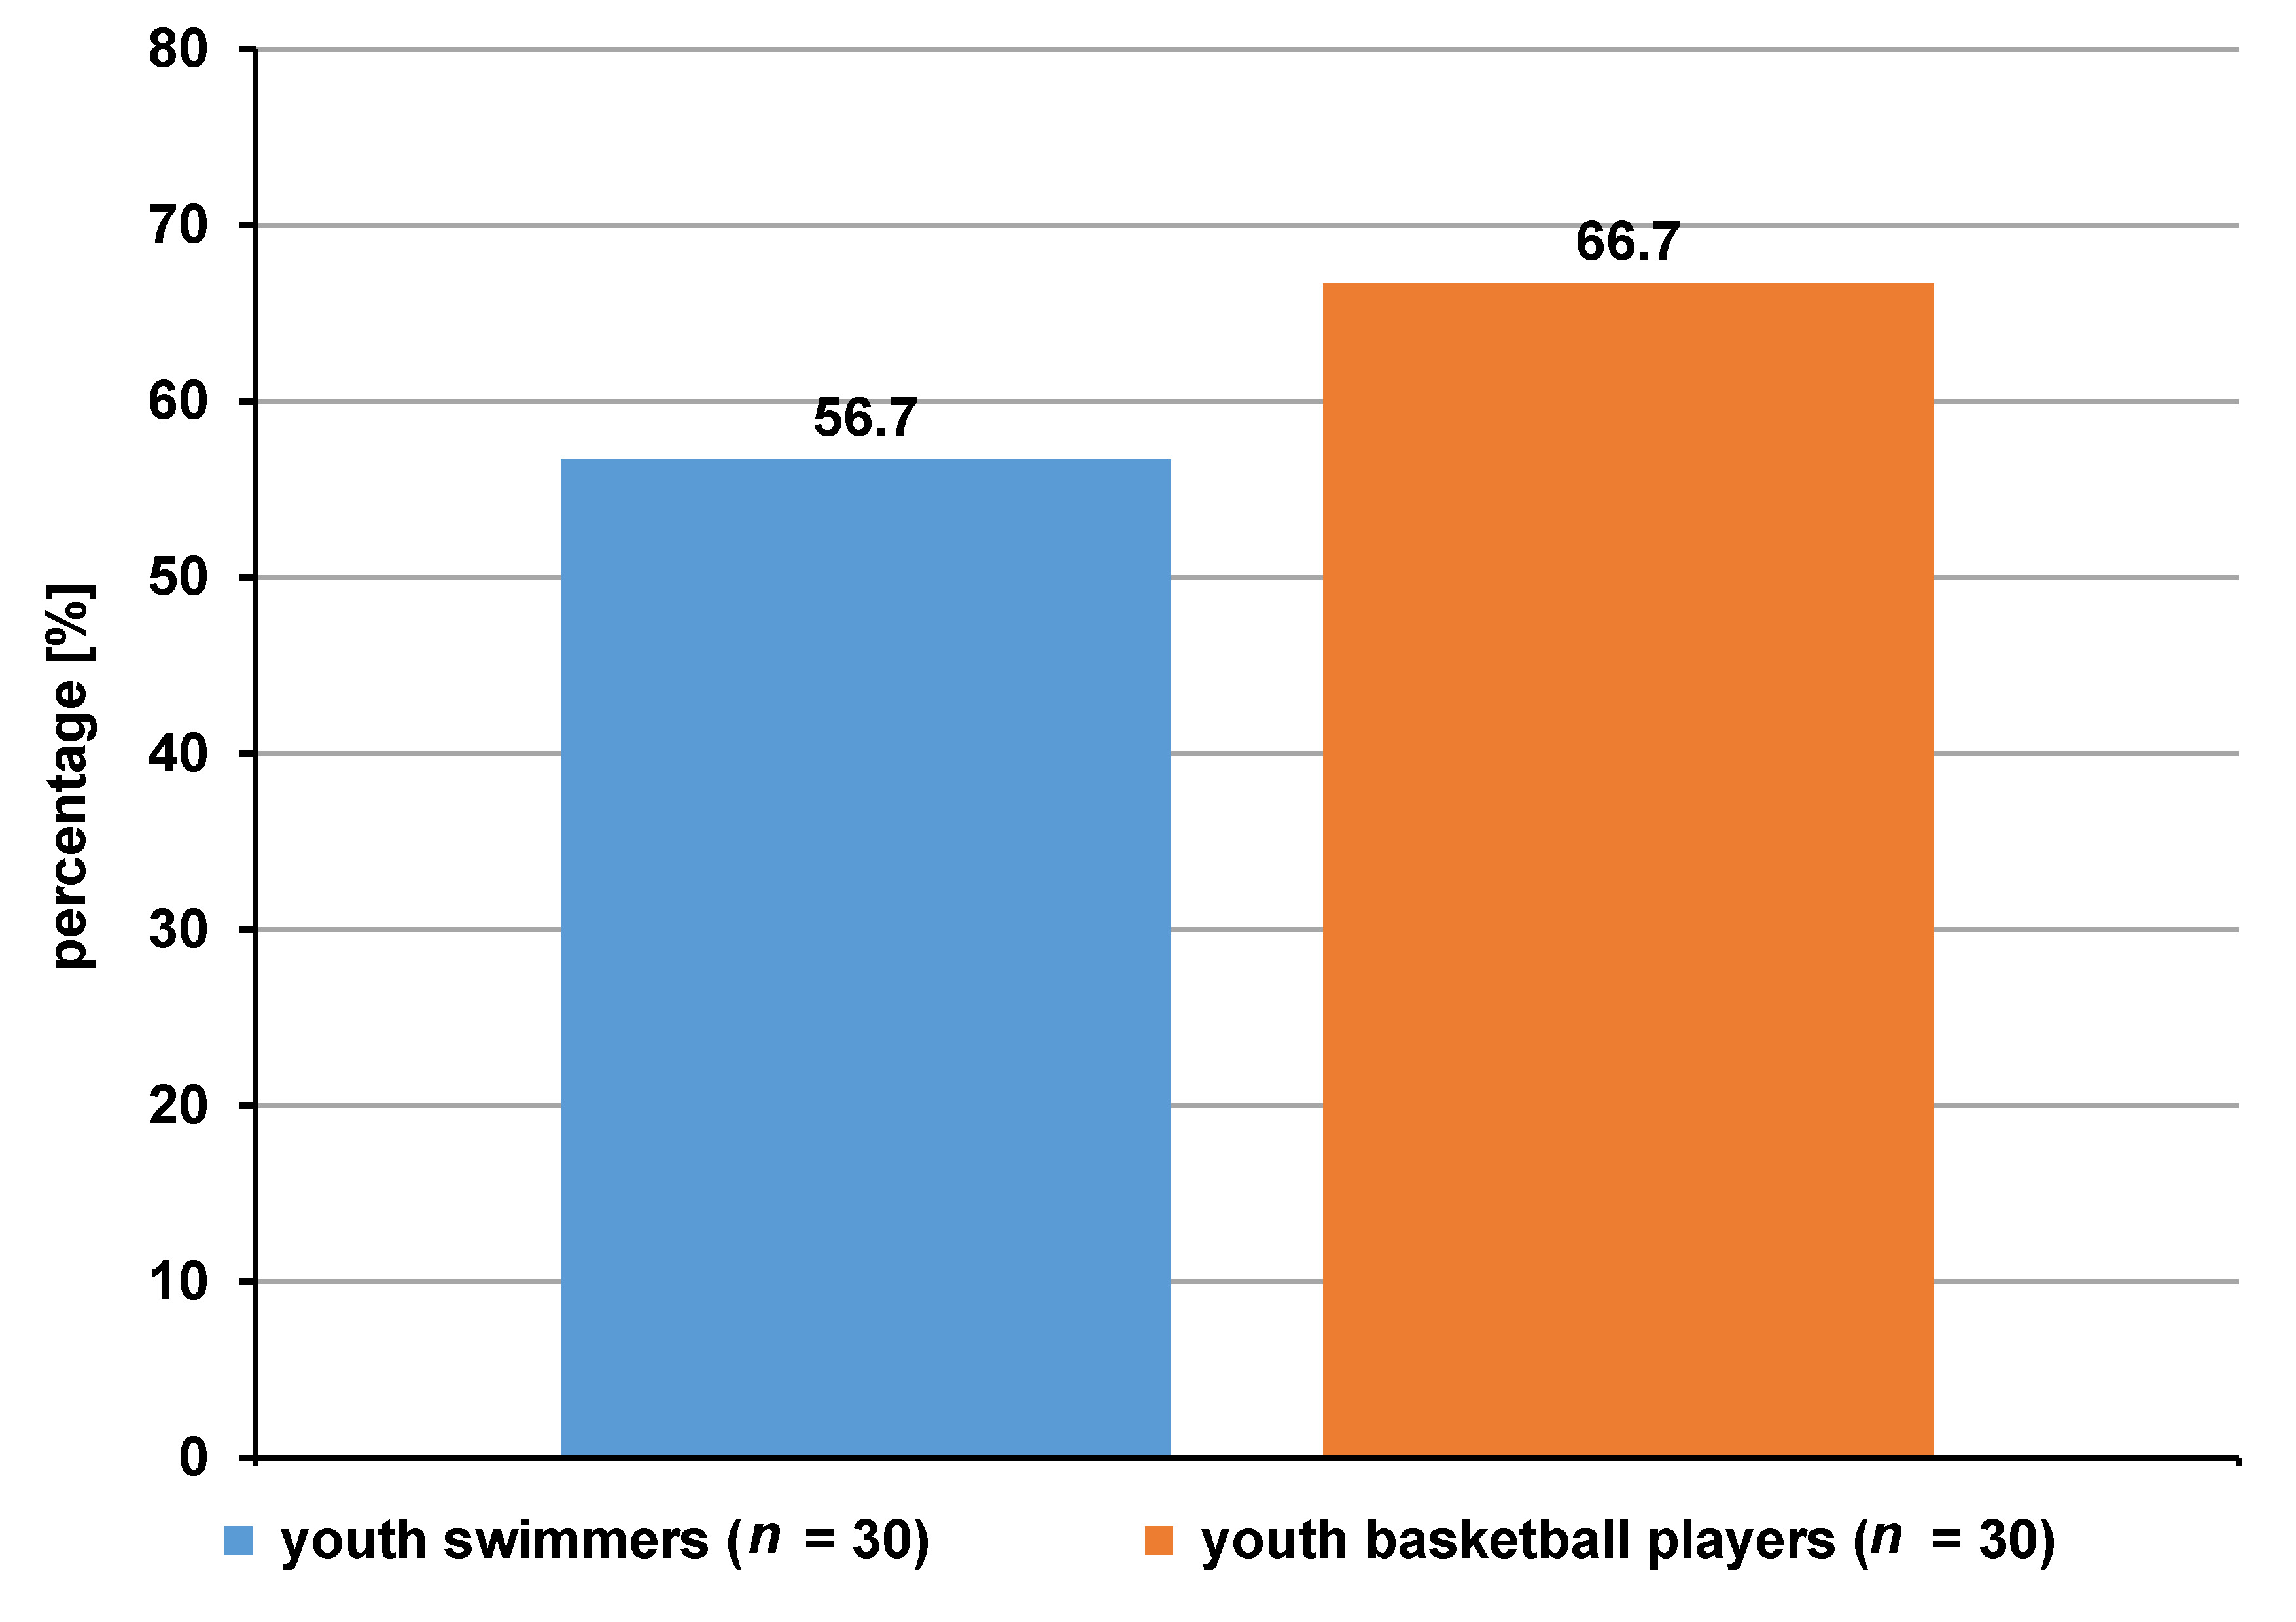
The prevalence of caries in the swimmers was 56.7%, while in the basketball group, it was 66.7% (Figure 1).
In the group of swimmers, the following mean scores were recorded: DT = 1.20 ±1.27; MT = 0.00 ±0.00; and FT = 3.33 ±3.19. On the other hand, in the group of basketball players, the mean values of the DMFT components were as follows: DT = 1.10 ±1.04; MT = 0.00 ±0.00; and FT = 2.33 ±2.34. In total, the mean DMFT score was 4.53 ±3.54 in the swimmers and 3.43 ±2.45 in the basketball players. The mean (M), standard deviation (SD), median (Me), as well as minimum (min) and maximum (max) values for DT, MT, FT, and DMFT are shown in Table 1. There were no statistically significant differences in DMFT and dental caries incidence between the groups.
OHI-S
For the group of swimmers, the mean OHI-S score was 0.73 ±0.58, which was significantly higher (p = 0.006) as compared to the group of basketball players with a mean OHI-S value of 0.34 ±0.37. Supragingival calculus was present only in the swimmers, while plaque was present in both groups (0.62 ±0.46 vs. 0.39 ±0.41, respectively), with a significantly higher value in the group of swimmers (p = 0.035) (Table 2).
Salivary parameters before and after the training session in swimmers
After the training session, the salivary V showed a significant decrease (p = 0.009), while significant increases in pH (p = 0.013), Ca (p = 0.001) and sAA (p = 0.028) were observed. Moreover, after the training, a decrease in buffer capacity and an increase in sPO were noted; however, the changes were not statistically significant (Table 3).
Salivary parameters before and after the training session in basketball players
After the training session, the salivary V showed a significant decrease (p = 0.047), while there was a significant increase in pH (p = 0.011). Furthermore, after the training session, decreases in buffer capacity, Ca and sPO, as well as an increase in sAA, were observed; however, the changes were not statistically significant (Table 3).
Salivary parameters in swimmers before the training session as compared to basketball players
Higher salivary V and sPO were found in the swimmers before the training session as compared to the basketball players, with only the difference in sPO being statistically significant (p = 0.005). In contrast, lower values of pH, buffer capacity, Ca, and sAA were observed before the training session in the swimmers as compared to the basketball players. Among these results, only the differences in pH and sAA were statistically significant (p = 0.050 and p = 0.041, respectively) (Table 3).
Salivary parameters in swimmers after the training session as compared to basketball players
Statistically significantly higher values of the salivary parameters were observed in the swimmers after the training session for Ca (p = 0.050) and sPO (p = 0.001), and lower for pH (p = 0.000) and sAA (p = 0.000) as compared to the basketball players (Table 3).
Assessment of the perceived exertion
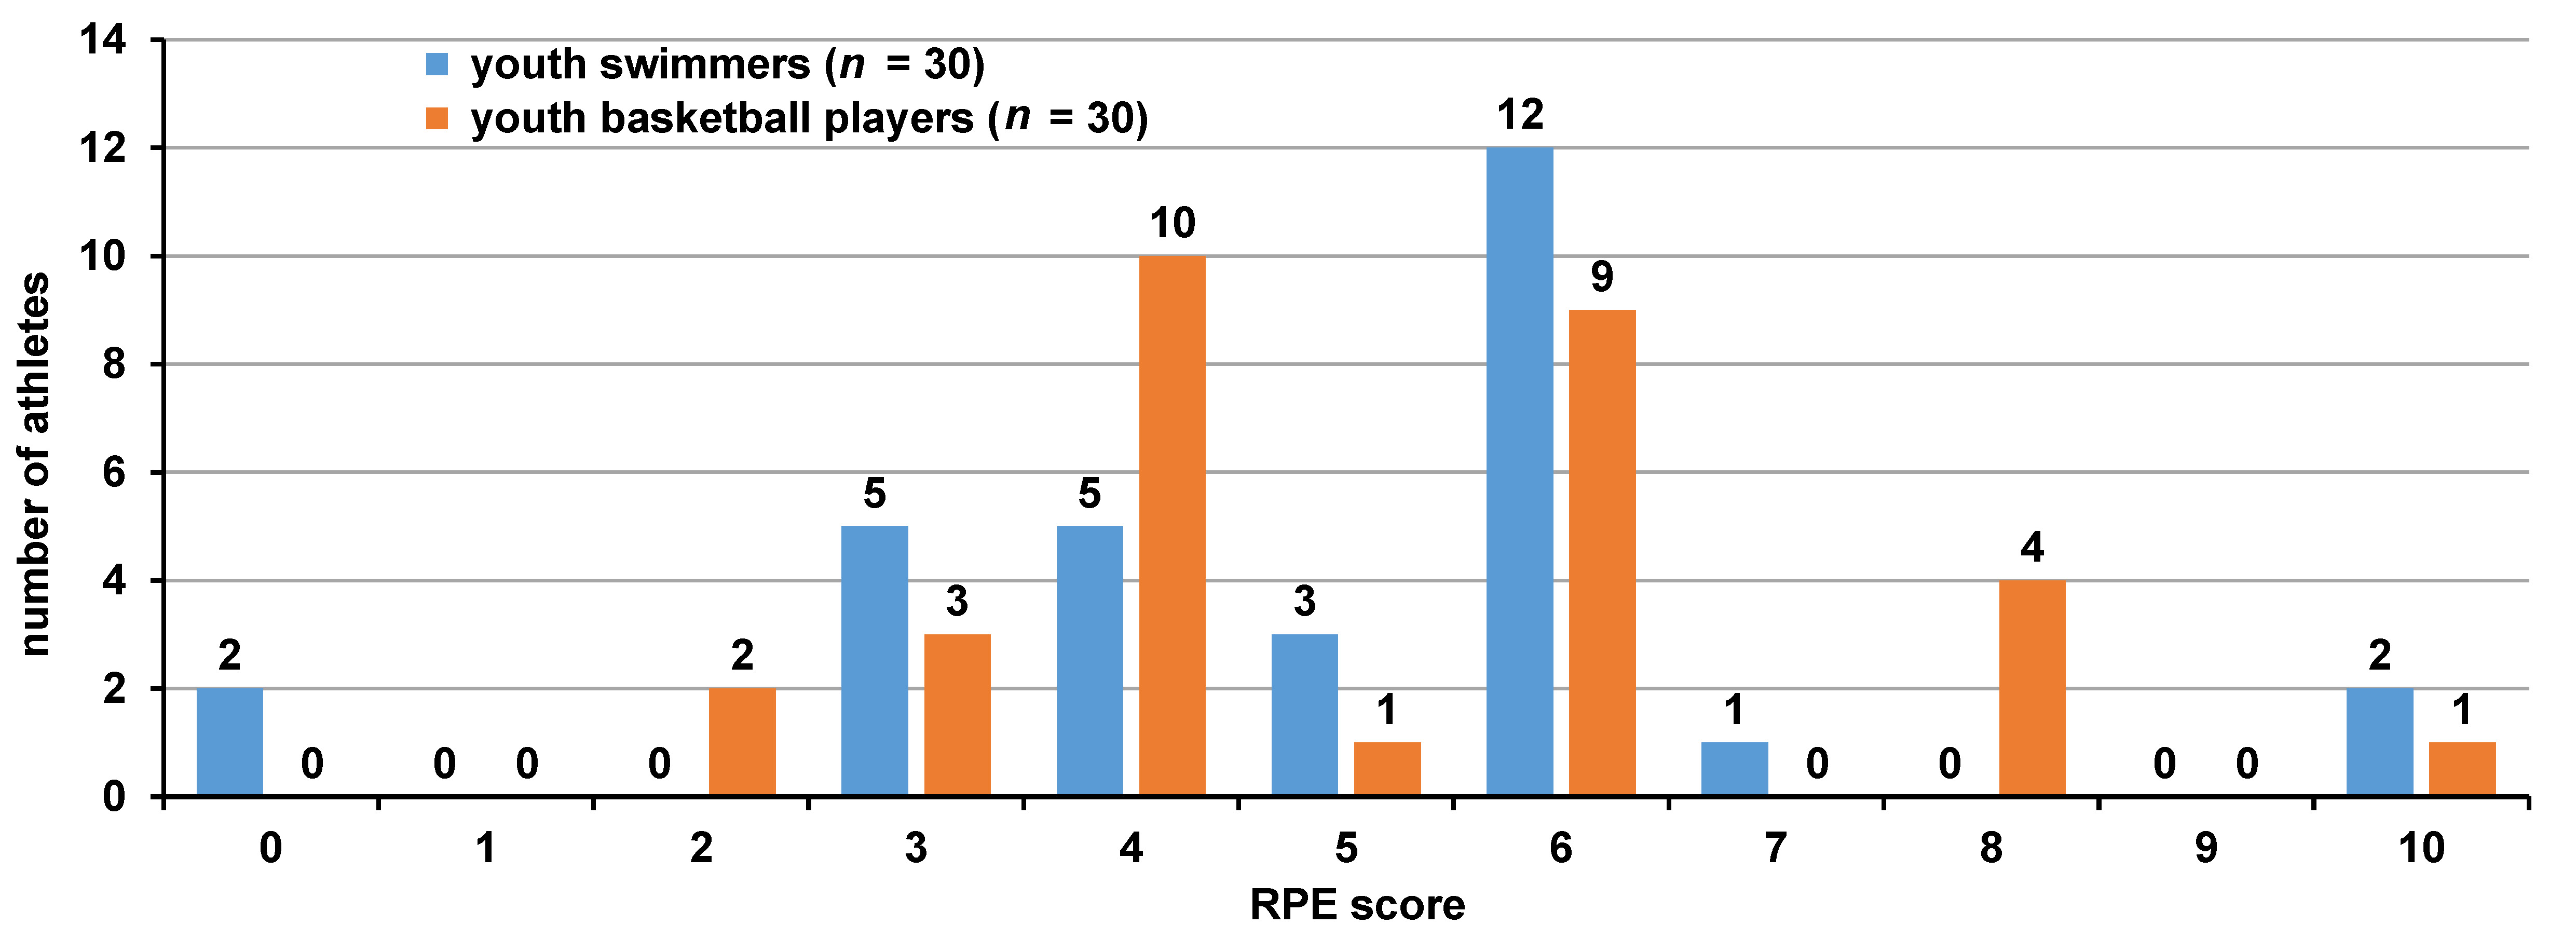
The mean value on Foster’s RPE scale for youth swimmers was 4.96 ±1.75, and the scores ranged from 0 to 10. Most youth swimmers perceived the training as ‘moderate’ (score 3; n = 5), ‘somewhat hard’ (score 4; n = 5) or ‘hard’ (score 5–6; n = 15). The mean value on Foster’s RPE scale for youth basketball players was 5.13 ±1.91, and the values ranged from 0 to 10, too. Most youth basketball players perceived the training as ‘somewhat hard’ (score 4; n = 10) or ‘hard’ (score 5–6; n = 10). The distribution of the RPE scores among the participants, and the percentages of athletes according to the perceived light and heavy training load are presented in Figure 2 and Figure 3, respectively.
Correlation between changes in the salivary parameters in swimmers and basketball players before and after the workout session
The analysis of correlation between the pre- and post-training salivary parameters showed a significant positive relationship between V and pH (ρ = 0.550; p = 0.002), and between buffer capacity and sAA (ρ = 0.416; p = 0.022) in the swimmers. In the basketball players, a significant positive correlation was noticed between buffer capacity and Ca (ρ = 0.364; p = 0.048), and between sPO and pH (ρ = 0.457; p = 0.011). Moreover, a significant negative correlation was found in the group of basketball players between sAA and sPO (ρ = −0.362; p = 0.050), as well as between sPO and V (ρ = −0.363; p = 0.048) (Table 4).
Correlation between changes in the salivary parameters and the DMFT and OHI-S scores in swimmers and basketball players before and after the workout
No correlation was found between the salivary parameters and the indicators of dental caries in swimmers. However, the analysis of Spearman’s correlation between the pre- and post-training salivary parameters and the oral health status showed a significant positive relationship between sAA and oral hygiene (DI-S and OHI-S) (ρ = 0.457; p = 0.011 and ρ = 0.476; p = 0.007, respectively) in the swimmers. The analysis showed a significant negative correlation between buffer capacity and DT (ρ = −0.444; p = 0.014) in the basketball players; as the salivary buffer capacity increased, the tooth decay index decreased (Table 5).
Correlation between changes in the salivary parameters due to the training session and the perceived exertion in swimmers and basketball players
The analysis of Spearman’s correlation between differences in the pre- and post-training session salivary parameters and the RPE scores showed a significant negative correlation between V and RPE, and between Ca and RPE (ρ = −0.473; p = 0.008 and ρ = −0.427; p = 0.018, respectively) in the swimmers. No correlations were noticed in the group of basketball players (Table 6).
Logistic regression analysis
The bivariate logistic regression analysis conducted in the group of athletes showed only a significant effect of sAA on OHI-S (p = 0.054) in the swimmers and of pH on DMFT (p = 0.018) in the basketball players (Table 7).
The logistic regression analysis showed that of the salivary variables analyzed separately, only V, pH, buffer capacity, and Ca were associated with the perceived training load in youth swimmers. In contrast, in youth basketball players, none of the saliva variables were associated with the perceived training load (Table 8).
Discussion
The aim of the study was to assess the oral health status in terms of caries and oral hygiene in adolescents participating in various sports, and the effect of regular exercise on changes in selected saliva parameters in different sports environment. Significant changes in the oral ecosystem can be caused by lifestyle, oral hygiene, the diet, the frequency and duration of training, climatic conditions, and psychophysical stress.3
The most common diseases affecting the oral cavity of athletes are dental caries disease and periodontal disease, caused by plaque biofilm.3 In a study by Needleman et al., examining young athletes, caries was found in 15–75% of subjects, and periodontitis in 15% of subjects; it was concluded that sports activities might be a risk factor for these oral diseases in athletes.48
In our study, caries prevalence in the study group of swimmers was 56.7%, which was lower as compared to the group of basketball players (66.7%). With regard to carious disease activity, as defined by the DT number, the study showed an average of 1.2 teeth in swimmers and 1.1 in basketball players. The MT number was 0 in both groups of subjects. On the other hand, the average FT number was 3.3 vs. 2.3, respectively. The average DMFT score in the 2 groups differed, and amounted to 4.5 in swimmers and 3.4 in basketball players. In Kaczmarek’s study conducted among swimmers aged 13–43 years, the mean DMFT value was 4.71.44 The author also reported the values of the components of the index, with DT = 1.42, MT = 0.19 and FT = 3.10, while the prevalence of caries in the group of swimmers was 54.8%.44 A similar study assessing oral health was conducted by D’Ercole et al. in young swimmers (mean age: 12.5 years).49 She found tooth decay in 38.24% of competitive swimmers, and the DMFT average score was 0.08.49 In a study by Popa et al. on the prevalence of dental caries among children (mean age: 13 years) from the competitive soccer and field hockey groups, lower DMFT values were found in athletes as compared to the control group; soccer players had an average DMFT score of 2.10 and hockey players had an average DMFT score of 1.32, while the mean score in the control group was 3.4.41 A number of studies show that for athletes, where good oral health is expected, the actual results do not confirm it. A review on the oral health of elite athletes found that caries was present in up to 75% of them.43
Oral diseases can be prevented by simple actions performed every day, like maintaining proper oral hygiene (effective plaque removal), among other things. Poor oral hygiene is a primary factor in the development of oral and systemic diseases.3 In our study, all 3 oral hygiene indices (DI-S, CI-S and OHI-S) had significantly higher values for swimmers than for basketball players (p = 0.035, p = 0.014 and p = 0.006, respectively). Oral hygiene analyzed with the use of OHI-S showed a value of 0.73 for swimmers and 0.34 for basketball players. The abovementioned study by Popa et al., who examined the impact of regular physical activity in young soccer and hockey players, found lower OHI-S values in these groups as compared to the control group; at the same time, the authors indicated a positive effect of competitive sports on oral hygiene in adolescents, in contrast to adults.41 In another study,49 the DI-S score in adolescents involved in swimming was similar to our own results (0.60 vs. 0.62).
It should be noted that some group sports require the use of mouthguards. Such mouth splints can be designed both for protective purposes and to deliver prophylactic substances to the tissues of the teeth, e.g., fluoride or chlorhexidine. However, they must be well designed, and replaced according to wear and tear, as worn or improperly made splints can damage the oral mucosa, the teeth and the periodontal tissues.3
Prolonged physical exertion, such as playing sports systematically, can reduce the unstimulated flow or amount of saliva, leading to dehydration and local dryness in the mouth, which considerably impairs the protective properties of saliva. This, in turn, may reinforce the negative impact of plaque biofilm, thereby increasing the cariogenic effect of dietary carbohydrates.48 This finding was taken into account in the current study, and the salivary parameters were determined before and after the training in both groups of athletes. The literature shows that with reduced saliva secretion, and decreased pH and buffer capacity, the incidence of caries increases.5 In both groups of young athletes studied (swimmers and basketball players), significantly reduced saliva secretion was observed after the training, i.e., by 22% in swimmers and by 26% in basketball players. It is likely that the greater decrease in saliva secretion in basketball players was related to the specific environment of the training performed, which is associated with greater exhaustion and dehydration. Decreased saliva secretion after exercise confirms the results of previous studies.45, 50 Different results were reported by Anttonen et al., who observed a significant increase in saliva secretion after exercise, which returned to the baseline value after 30 min.51 Such a result was explained by the fact that the study was conducted at 10°C, which reduced dehydration.51
The pH of saliva is not a constant value, and under the influence of various factors, such as the rate of saliva secretion, a diurnal cycle, the diet, or autonomic nervous system or systemic diseases, it changes significantly. The pH of mixed saliva is 6.8. At night, when saliva secretion slows down, the pH value lowers to 6.2–6.5.24 In our study, we observed a significant increase in the salivary pH, both after the swimming (by 2%) and basketball training (by 3%), a finding almost unanimously supported by other studies.45, 52 Different results were reported by Tanabe-Ikegawa et al., who observed a decrease in pH following a cycling exercise.53 This would support the rationale that as salivary secretion decreases, pH also decreases, which is explained by changes in the salivary pH in association with the blood carbon dioxide (CO2) levels. The blood concentration of CO2 increases with athletic performance, resulting in a high concentration of CO2 being transferred from the bloodstream to saliva, thereby causing a decrease in the salivary pH.53 In our study, the regression model showed that pH could be a predictor of DMFT in basketball players. The buffer capacity of saliva and its ability to maintain a neutral pH is important for maintaining a healthy oral microbial composition, and thus it is responsible for maintaining adequate salivary homeostasis.9 Our own research showed that both in swimmers and basketball players, buffer capacity decreased (by 10% vs. 12%, respectively). A significant decrease in buffer capacity was observed by Frese et al., who studied the effect of endurance training on the oral health of triathletes, in relation to tooth decay, among other things.45 In our study, we found a negative correlation between buffer capacity and tooth decay in basketball players.
Micronutrients present in saliva are of great importance for the mineralization and maturation of the hard dental tissues. One of the elements necessary for the remineralization of tooth enamel is Ca.5, 54 Physical exercise of varying intensity and duration can alter the concentration of ions in saliva.11 In our own study, a significant increase of 19% in Ca ions was observed in swimmers (p = 0.001), while a decrease of 11% was observed in basketball players. Similarly, a significant increase of Ca in saliva in male competitive swimmers exposed to a 2-hour swimming training session in a gas-chlorinated swimming pool was presented by Bretz and Carrilho.50 In contrast, Chicharro et al. observed a decrease in Ca in athletes after intensive exercise on a cycloergometer.55 The obtained results may be mainly related to the sport-specific environment.
Some saliva proteins can inhibit the adhesion of bacteria to oral surfaces. One of them is sAA, which is most abundant in saliva, as well as in the salivary membrane and plaque, and has a high affinity for oral bacteria; through binding to them, it inhibits their adhesion to various surfaces in the mouth.9, 12, 24 Salivary alpha-amylase is involved in the formation of the glycoprotein complex in the salivary membrane, created on the surfaces of the teeth immediately after cleaning.24 It also participates in the initial digestion of food, leading to the degradation of starch and glycogen into maltose to form more soluble compounds, which can dissolve in saliva.9, 12, 24 Alpha-amylase is activated at pH above 6 and is inactivated in the acidic environment of the stomach.9 In our study, the pre-training sAA levels were lower in swimmers as compared to basketball players. In both groups, the sAA levels increased after the training. Although the increase in basketball players as compared to swimmers was greater, the increase in swimmers was found to be statistically significant (p = 0.028). The association of the enzyme level with exercise has been extensively investigated. Other studies conducted in both swimmers and basketball players have reported an increase in this enzyme in response to exercise.33, 56 In our study, we found a significant positive correlation between sAA and DI-S and OHI-S in swimmers. The regression model showed that sAA could be a predictor OHI-S in swimmers.
An increased respiration rate during exercise raises oxygen demand due to increased metabolism, which leads to increased production of harmful reactive oxygen species (ROS) and free radicals. Their negative effects can be neutralized by antioxidants. Salivary peroxidase is produced by the salivary gland cells and catalyzes the oxidation of thiocyanate ions by hydrogen peroxide (H2O2), thereby preventing the toxic accumulation of H2O2.57 Sariri et al.58 and Damirchi et al.59, 60 observed an increase in sPO activity in athletes immediately after intense treadmill running, which returned to baseline 1 h after exercise. Our data confirmed those results only in swimmers, as we found higher sPO levels after the swimming training session. In basketball players, on the other hand, the sPO levels decreased after the training session.
The assessment of training intensity in athletes can vary due to the environment of the sport played, as well as athletes’ age and experience in competitive sports.61 In a study by Barroso et al., examining swimming coaches and young swimmers, it was suggested that the more experienced the swimmers, the more accurate the RPE scores.61 In addition, they observed that younger swimmers (11–12-year-olds) rated training intensity differently than coaches.61 In the case of swimmers, exercise intensity may be experienced differently as compared to basketball players, as the swimming training takes place in a water environment, which alleviates the feeling of exhaustion. In contrast, in team sports, such as basketball, due to the situational nature of exercise, the subjective perception of intensity may be greater. Basketball requires frequent specific movements – from acceleration to deceleration, as well as changes in the direction of movement during the game. In a study by Lupo et al., the mean RPE score among 66 youth basketball players during the training session was 6.7 ±1.3.31 The mean RPE values for our swimmers and basketball players after one training session were 4.96 ±1.75 and 5.13 ±1.91, respectively. Moreira et al., studying RPE in male basketball players using Foster’s protocol, observed significantly higher scores after the official game as compared to the training session.62 In our study, we found a negative correlation with the self-assessment of the exercise sensation according to Foster’s RPE scale for both the salivary V and Ca level in swimmers. This finding meant that an increase in training severity correlated with a decrease in V and Ca. The regression model showed that the salivary V, pH, buffer capacity, and Ca level could be predictors of the effort rating among swimmers.
The project requires further research due to the wide variety of sports types. Its limitation is the size of sports club facilities and the number of members who can train in them. In addition, depending on the type of sport, gender separation is a limitation. Some sports divide teams by gender (basketball), while others are mixed (swimming). If the study continues, it will be necessary to take into account the disciplines by gender of the athletes, and in mixed disciplines, to survey an equal number of women and men.
If oral disease prevention and the promotion of oral health are accomplished through greater awareness of the impact of the diet and oral hygiene on the overall health of the body, the performance of athletes can be better and more stable, and prevention itself can become an important part of athlete care.
Conclusions
There were no significant differences in the DMFT values between the athletes, while significantly higher oral hygiene rates were found in swimmers. The exertion related to the swimming and basketball training caused a significant increase in pH and a decrease in the rate of saliva secretion. The level of sAA was positively correlated with DI-S and OHI-S in swimmers, and an increase in effort was negatively correlated with the salivary V and Ca levels among swimmers. However, the buffer capacity of saliva was negatively correlated with tooth decay in basketball players. The data suggests that the salivary V and pH, and the levels of Ca and sAA are associated with the swimming training session, whereas V and pH are also associated with the basketball training session. Both swimmers and basketball players rated the training as ‘somehow hard’ and ‘hard’. The oral health status in athletes should be considered a priority during sports participation.
Ethics approval and consent to participate
The study protocol was approved by the Bioethics Committee of Wroclaw Medical University, Poland (approval No. KB-327/2009). All examinations were conducted in accordance with the relevant guidelines and regulations, and all the recruited participants provided written informed parental consent.
Data availability
The datasets supporting the findings of the current study are available from the corresponding author on reasonable request.
Consent for publication
Not applicable.
Use of AI and AI-assisted technologies
Not applicable.